Post-drought increase in regional-scale groundwater nitrate in southwest Germany
Abstract
Elevated nitrate concentrations in groundwater are a common challenge for water management. One important factor in this context is higher frequencies and intensities of wet-dry cycles that may cause increased nitrate concentrations in groundwater due to nitrate flushes after drought termination. Yet systematic studies on regional-scale impacts of droughts on groundwater nitrate concentrations are missing so far. Here we analyzed time series of 44 shallow groundwater wells and 41 springs all across the German Federal State Baden-Wuerttemberg from 2000 to 2018 to characterize patterns of post-drought nitrate increase in groundwater. In general, half of the exceptional nitrate concentrations, which exceeded the 80th percentile of long-term nitrate measurements, could be related to droughts in the research timeframe. The 2003 drought event stood out in terms of drought severity and post-drought nitrate concentration increases in our data. The great majority (91%) of all monitoring sites showed at least one exceptionally high nitrate concentration in the 4 years following the 2003 drought event. Springs were mainly located in forests of steep low mountain ranges and wells in cropland of flat river valleys. Therefore, delay times between drought intensity and nitrate concentration increases as well as magnitudes of nitrate concentration increase were diverse among wells and springs. We derived two distinct nitrate response patterns: (i) nitrate increases immediately following drought events (more common for springs and fractured rock aquifers) and (ii) delayed nitrate increases (more common for wells and porous aquifers). Springs generally showed quicker (median of 101 days) but weaker (median of +1.3 mg/L) post-drought nitrate increases than wells (185 days, +3.4 mg/L). Only few sites exhibited no post-drought nitrate increase and post-drought mean-nitrate concentrations of groundwater reservoirs were extraordinarily high in 2006. Overall, we demonstrate that post-drought nitrate increase in groundwater is omnipresent, while different landscapes and hydrogeological characteristics create a diverse regional pattern. As severe droughts become more frequent in a changing climate, post-drought nitrate increase may intensify problems regarding water quality and supply.
1 INTRODUCTION
Throughout the world, elevated nitrate concentrations in groundwater violate drinking water standards and pose a risk to human health (Canter, 1997). In aquifers overlain by agricultural fields, nitrate inputs into groundwater largely originate from a nitrogen surplus of intense agriculture (Goulding, 2000; Hansen et al., 2011, 2017; Menció et al., 2016). Sources of nitrate contamination are well known. They were identified by for example, statistical analysis of landuse types and vadose zone characteristics (Lockhart et al., 2013; Vazquez et al., 2005) or by stable isotope signatures, namely 15N and 18O of the nitrate molecule (Bourke et al., 2019; Savard et al., 2010). Stable isotopes may also characterize the extent of denitrification, the main reduction pathway of nitrate within the saturated zone (Webster & Dowdell, 1984; Wild et al., 2018).
During drought events, missing rainfall creates soil moisture deficits, which, if prolonged, lead to agricultural droughts (Tallaksen & van Lanen, 2004). Then nitrogen turnover in the unsaturated zone is affected, because mineralization of organic nitrogen and nitrification are reduced under dry conditions and less nitrate is formed. At the same time, reduced or absent percolation can cause an accumulation of inorganic and organic nitrogen in the unsaturated zone. When a drought is terminated by extensive rainfall, nitrogen turnover resumes in wetter soil and may generate a quick downward nitrate response with percolating soil water (Borken & Matzner, 2009). In agricultural land intensified post-drought nitrate leaching was exemplified in pasture soil (Shepherd et al., 2018), beneath fertilized grassland (Klaus et al., 2020), under wheat and maize (Zhu et al., 2009) or sugar beet (Groves & Bailey, 1997). In principle, similar nitrate dynamics can be expected in forests, although absolute loads are less (Di & Cameron, 2002). While Tietema et al. (1997) did not find clear post-drought nitrification pulses within the acidified soils of their experimental plots, various studies reported a reduction of nitrate leaching during droughts and an increase after drought termination (e.g., Bechtold et al., 2003; Leitner et al., 2020).
Post-drought nitrate leaching has negative effects both on surface and on sub-surface water resources. After an early summer drought in 2005, Lange and Hänsler (2012) measured elevated nitrate concentrations in springs and inside a small first-order stream draining a forested headwater catchment. Opsahl et al. (2017) found increasing post-drought nitrate concentrations in wells of a karst aquifer using high-frequency in situ optical sensor measurements. During droughts, river flow is largely sustained by baseflow from groundwater reservoirs, and the river water resembles the water quality of discharging aquifers (Smakhtin, 2001). Due to the strong relationship between water quality and below average streamflow (Hellwig et al., 2017), exceptional nitrate responses in springs and groundwater are directly relevant for the ecological status of rivers. Morecroft et al. (2000) found evidence for a post-drought stimulation of mineralization and nitrification that was more pronounced at woodland compared to agricultural river sites. In the same area, Outram et al. (2014) identified a large transfer of nitrate following a prolonged dry period in one out of three investigated catchments. As a response to a severe drought in 2012, Van Metre et al. (2016) found anomalously high nitrate levels in 17 streams of midwestern United States (US) with concentrations outside the 95% confidence interval of the regression-predicted mean. Recently, Lisboa et al. (2020) detected post-drought peaks in phosphorous but none in nitrogen in streamflow samples of 12 tributaries in the Owasco Lake watershed, New York. In groundwater, large scale studies mainly concentrated on general factors influencing groundwater nitrate contamination (e.g., Wick et al., 2012) or revealed rising tendencies of average nitrate concentrations following drought years (e.g., LUBW, 2018). However, we are not aware of a systematic study on regional-scale impacts of droughts on nitrate concentrations in groundwater that included wells and springs of diverse aquifer types. This is also important in the context of climate change, since potential impacts of climate change on nitrate concentrations in groundwater are complex and not yet well enough understood (Stuart et al., 2011). Droughts are one factor in this relationship, and the long-term effects of extreme drought events for groundwater processes like recharge are still unclear (Riedel & Weber, 2020). They have become more frequent in the last years in Europe (Jacob et al., 2012) and climate change projections predict a higher frequency of extreme events in future (Xu et al., 2019).
- How significant are increases in site-specific nitrate concentrations in groundwater following drought events?
- How much does post-drought nitrate increase and how long are average response times?
- Do wells and springs behave differently for dominant aquifer types?
2 MATERIALS AND METHODS
2.1 Study area and data
We analyzed observational data of the groundwater monitoring network of the State Environmental Agency of Baden-Wuerttemberg (LUBW) (LUBW, 2019). All our sites are located in the 35 750 km2 federal state of Baden-Wuerttemberg in southwest Germany. The federal state is characterized by mean annual precipitation of 970 mm which varies from less than 600 mm in the central Upper Rhine Valley to more than 2000 mm in the mountain regions of the Black Forest or Swabian Alb. Mean annual temperature is 8.3°C and varies between 5 and 10°C (Kopp et al., 2018).
The LUBW groundwater monitoring network contains both water quality and quantity data. Nitrate sampling and analysis is based on LUBW quality guidelines for groundwater sampling (LUBW, 2013), which set strict rules to provide a representative sample of groundwater at a given well screening depth. Stagnant water must be removed prior to sampling and a drawdown of the water table kept as low as possible. Springs are directly sampled at their source. All samples are collected in glass or polyethylene bottles and stored at 2–5°C until analysis the following day. Analysis is performed in laboratories that are accredited following DIN EN ISO/IEC 17025 standards and use liquid chromatography (DIN EN ISO 10304-1) or spectrophotometry (DIN EN ISO 38405-9). Analytical errors vary among the laboratories but are typically below 5%. While in our data nitrate sampling was irregular at monthly or seasonal intervals, spring discharges and groundwater levels were measured at daily or weekly intervals. We selected 41 springs and 44 wells (Figure 1) that met the following three criteria: (a) at least four nitrate measurements per year were available in 2002–2005 (all years used in this study refer to the hydrological year November 1–October 31), (b) a record of groundwater levels or spring discharges existed for 2000–2018, and (c) metadata allowed for accurate localisation. Construction data was available for 39 out of 44 wells. Since screening depth of wells in porous and fractured aquifers was between 2 and 19 m, our dataset is primarily representative for shallow groundwater. Five karst wells stood out with screening depths between 37 and 55 m. Hourly precipitation data was derived from 14 climate stations of the German weather service (DWD Climate Data Center (CDC), 2021) that were located at an average distance of 32 km to the respective groundwater sampling site. Missing data in precipitation time series were filled by linear interpolation.
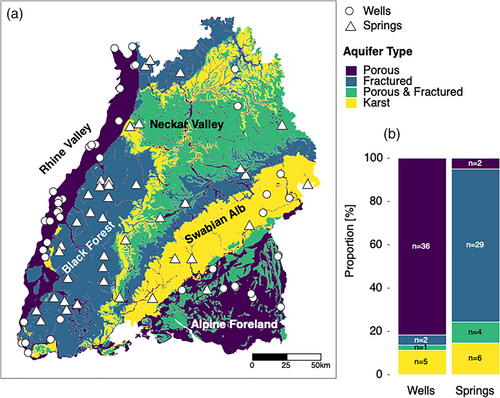
Groundwater resources in Baden-Wuerttemberg can generally be categorized into large porous aquifers in the Upper Rhine Valley and in the Alpine Foreland, fractured aquifers in the Black Forest, karst aquifers in the Swabian Alb and mixed aquifers in the Neckar Valley (Figure 1). We derived maps of hydrogeological and land use characteristics from a water and soil database (WaBoA, 2012) and determined for all sites the dominant (highest proportion) aquifer porosity and land use type in a surrounding 500 m circular buffer area. These buffers contained all dominant aquifer types of the state. However, springs mostly drained fractured rock aquifers, whereas the majority of wells was situated in porous aquifers (Figure 1(b)).
2.2 Nitrate responses to the 2003 drought
To investigate the site-specific nitrate response to drought, we focused on the severe 2003 Central European summer drought, which was one of the major drought events of the last decades in Central Europe (e.g., Fink et al., 2004; Van Lanen et al., 2016). We analyzed data until October 31, 2007 and determined the delay time T [days] as the time period between the end of drought development and the exceptional nitrate concentration. We then calculated the drought induced concentration increase ΔC [mg/L] as the difference of the exceptional nitrate concentration from the expected value of the detrended time series (i.e., 0 mg/L).
We applied further criteria to disentangle characteristic temporal patterns of nitrate responses. Sites with a post-drought exceptional nitrate concentration were classified as “direct response”, if only a single drought event occurred before the nitrate concentration rose to exceptional levels. If two or more separate droughts occurred, the site was classified as “delayed response”. Sites without post-drought exceptional nitrate increase were categorized as “no response” or “no recovery” depending on the occurrence of a recovery from the 2003 drought (i.e., spring discharge/water level above the 60th percentile before the end of 2007).
Differences in T and ΔC were further investigated using the analysis of variance (ANOVA). In an ANOVA, a sample is split for levels of a predictor and explained residual variances are compared. We used drainage type (well/spring), aquifer type (porous/fractured/porous and fractured/karst), land use (cropland/pasture/forest) and response type (direct response/delayed response) as predictors. If the ANOVA indicated that the split into predictor levels significantly reduced the residual variance, we applied the Tukey's honest significant difference test (TukeyHSD) as a post-hoc test to determine which predictor levels differed significantly from each other (Abdi & Williams, 2010). For all tests we used a significance level of α = 0.05.
3 RESULTS
3.1 Droughts and exceptional nitrate responses 2000–2018
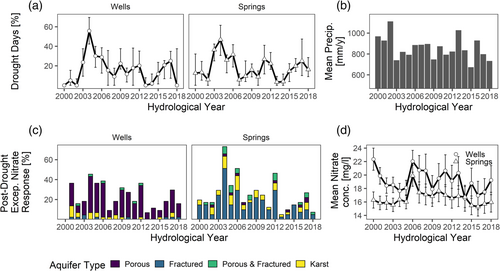
The largest number of drought days in the 2000–2018 period occurred in 2004 (Figure 2(a)) after extraordinarily low precipitation in 2003 (Figure 2(b)). This maximum was more accentuated for wells (56%) than for springs (47%). Also 2005 and 2006 showed above-average occurrence of drought days for wells and springs. For springs there was also a 37% decline in flow in 2003, whereas the drought developed slower in wells (23%). The proportion of sites with an exceptional nitrate response to the 2003 drought event also peaked in 2004 (Figure 2(c)). The percentage of sites with maximum nitrate response in 2004 was more accentuated for springs (73%) than for wells (46%). While the number of nitrate responses in wells remained high until 2006, we found a considerable decrease for springs in 2005. This difference was partly related to longer drought events for wells than for springs during the period of 2003–2006 (TukeyHSD, p = 0.04) and to a larger number of sites that experienced multi-year droughts (eight for wells and three for springs). The average nitrate concentrations resembled the temporal pattern of the responses with a delay of approximately 2 years (Figure 2(d)). Both for springs and wells values reached their maxima in 2006 (19.9 and 22.0 mg/L, respectively), when nearly all sites had reacted. Average nitrate concentrations of springs decreased by 2.5 mg/L already in 2007, while wells remained high at 20.6 mg/L up to 2008.
3.2 Nitrate responses to the 2003 drought
The 2003 drought event was clearly defined in time, as it was characterized by extreme precipitation deficits that ended in 2004 (e.g., Hänsel et al., 2019; Rebetez et al., 2006), and at the same time well documented, as the number and frequency of nitrate measurements in groundwater peaked in 2006. These two facts facilitated unique insights into nitrate-drought-dynamics in our study region and also statements on multi-year impacts. 91% of the observation sites, 38 wells und 39 springs, showed at least one exceptional nitrate response in the 2003–2007 period. Karst aquifers responded most often (mean = 3.3), whereas the number of exceptional responses was significantly smaller in porous (mean = 1.8, TukeyHSD, p < 0.01) and fractured aquifers (mean = 2.1, TukeyHSD, p = 0.02). A higher variability in spring discharge compared to groundwater level led to more exceptional post-drought nitrate concentrations in springs (TukeyHSD, p = 0.02). Nitrate responses were heterogeneous in space, although some regional patterns became apparent in annual maps of the nitrate responses that suggested both landscape and hydrogeological influences (Figure 3). Most sites, mainly springs in the Black Forest and Swabian Alb, showed nitrate responses already in 2004. In 2005, nitrate responses were more distinct in the southern parts of the study area, particularly in a cluster of wells in the Alpine Foreland. In 2006, nitrate responses were evenly distributed all over the region. In 2007, most sites had recovered and did not show nitrate responses anymore.

Delay times T exhibited a large variability ranging from a few days up to more than a year (Figure 4). In accordance with the different maxima of nitrate responses in the annual time series (Figure 2(c)), T was shorter for springs (median = 101 days) than for wells (median = 185 days, Figure 4), though not statistically significant (TukeyHSD, p = 0.252). This corresponds to a faster drought propagation from precipitation to base flow than from precipitation to groundwater (Hellwig et al., 2020). Furthermore, the porosity (i.e., aquifer type) theoretically dictates the water volume and hence transit times in a groundwater system: the higher the water volume, the longer the mean transit time (if water fluxes are the same). Nevertheless, T did not significantly differ between aquifer types in our data (ANOVA, p = 0.13). However, four springs stood out and responded with T > 2 years. These long T might have been caused by missing responses due to a coarse seasonal sampling resolution. Excluding these four outliers, the difference of T between the aquifer types became significant (ANOVA, p < 0.01). Then T in porous aquifer (median = 350 days) was, on average, 9 months longer compared to fractured (median = 84 days) and karst aquifers (median = 78 days) (TukeyHSD, p < 0.05). These values resemble results of two studies that simulated T of slow flow components that dominate streamflow during droughts. For a set of 10 meso-scale catchments in Europe, Longobardi and Van Loon (2018) reported T of 87 ± 53 days (maximum 203 days), and Stoelzle et al. (2014) used a groundwater box model to translate recharge signals into base flow responses. For the same drought event in 2003 and for the same region their median recharge ages varied between approximately 80 days for karstic, 220 days for fractured and 600 days for porous aquifers.
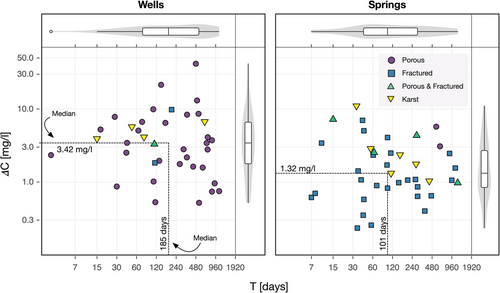
Drought induced increases of nitrate concentrations ΔC were significantly (TukeyHSD, p < 0.01) smaller for springs (median 1.3 mg/L) than for wells (median 3.4 mg/L, Figure 4). The surrounding land use types of wells were cropland and pasture, whereas springs were mostly located in forests. For these land use types ΔC differed significantly (ANOVA, p < 0.01) with ΔC in cropland being on average 4.6 mg/L higher than in forests (TukeyHSD, p < 0.01). This reflects the higher nitrogen input in cropland, which has been reported for other regions as well, for example, for the Central Valley, California (Ransom et al., 2017). However, the influence of aquifer type on ΔC was not significant (ANOVA, p = 0.09), because sample sizes were too different (Figure 1(b)). Lange and Hänsler (2012) reported similar ΔC between 0.2 and 4.0 mg/L in springs draining a crystalline fractured aquifer in a forested headwater and also the post-drought nitrate peaks of 0.9 mg/L measured in a well by optical sensors (Opsahl et al., 2017) fell in these ranges.
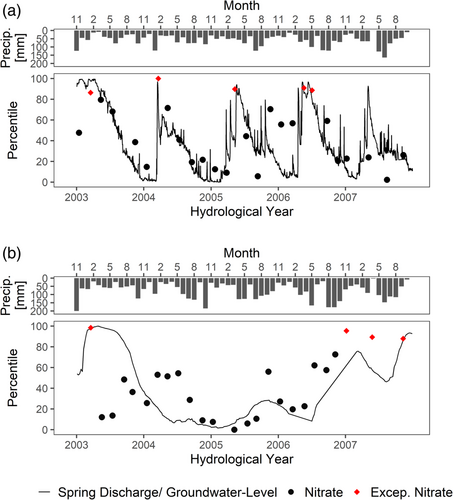
As a next step, we classified water quantity and quality dynamics and defined four characteristic response types (Figure 5). A direct nitrate response (type A) was identified in 21 wells and 29 springs (in total 59% of all wells and springs). These sites showed a strong seasonal signal, and both responded and recovered in the first wet season following the 2003 drought. Nitrate concentrations exhibited marked increases in the first wet season and secondary responses in following years. A smaller number of sites (17 wells and 10 springs, 31%) showed a delayed nitrate response (type B) with at least one additional drought event before nitrate concentrations increased. In general, examples of direct and delayed nitrate responses suggest that sites with direct response were directly influenced by precipitation, whereas both the hydrograph and the nitrate concentration were smoother at sites with delayed response and responded only after a long period of strong precipitation (Figure 5). In three wells, the water tables did not fully recover after the drought and nitrate concentrations remained below the 80th percentile until 2007 (type C, 4%). A group of three wells and two springs did not show any nitrate response (type D, 6%), despite a recovery from the 2003 drought. Here, missing nitrate responses might have been caused by a too coarse sampling interval that excluded short-term exceptional nitrate peaks. According to the definition of the response types, T largely differed between response types A (direct) and B (delayed). However, the difference in ΔC was only 9% lower for type A compared to type B (Table 1). Out of 39 wells with known screening depth, 33 wells had an post-drought exceptional nitrate concentration but relationships of screening depth with T (ANOVA, p = 0.64) and ΔC (ANOVA, p = 0.71) were non-significant. Screening-depths were different for wells in porous and fractured (n = 29, 2–19 m) and karst aquifers (n = 4, 37–55.2 m) but not for the different response types (direct response: n = 18, 2–55.2 m; delayed response: n = 15, 2.9–54 m; no response/no recovery: n = 6, 1.4–32 m).
| Response types [%] | |||||||||
|---|---|---|---|---|---|---|---|---|---|
| Characteristics (median) | All sites | Drainage type | Aquifer type | ||||||
| Response type | Δc [mg/L] | T [d] | All sites (n = 85) | Well (n = 44) | Spring (n = 41) | Porous (n = 38) | Fractured (n = 31) | Por. & frac. (n = 5) | Karst (n = 11) |
| A (direct) | 2.25 | 67 | 59 | 48 | 71 | 42 | 75 | 80 | 64 |
| B (delayed) | 2.46 | 536 | 31 | 38 | 24 | 45 | 19 | 20 | 27 |
| C (no response) | - | - | 6 | 7 | 5 | 5 | 6 | 0 | 9 |
| D (no recovery) | - | - | 4 | 7 | 0 | 8 | 0 | 0 | 0 |
4 DISCUSSION
In the Black Forest, springs are located on steep hillslopes with permeable soils and drain fractured hard rock aquifers overlain by periglacial drift covers (WaBoA, 2012). For two springs, Uhlenbrook et al. (2002) estimated mean residence times of 28 and 36 months using 18O Isotopes. This means that fast runoff components may reach these springs within a few weeks or months. This was also shown by Lange and Hänsler (2012) who documented nitrate responses in various hillslope springs only a few weeks after the termination of an early summer drought. Karst springs of the Swabian Alb are known to instantaneously respond to recharge events (Goldscheider, 2005). In contrast, wells are located in flat and slightly sloping terrain on large unconsolidated aquifers (WaBoA, 2012). This generally suggests a more delayed passage of diffuse recharge through the unsaturated zone, although in shallow groundwater (3–4 m depth) a quick leaching of for example, pesticides by preferential flow components was observed in other areas (e.g., Haria et al., 2003; Willkommen et al., 2021). Despite delayed recharge, the proportion of exceptional nitrate concentrations that could be related to drought events was generally higher for wells (56%) than for springs (47%) in the 2000–2018 period. A possible explanation for this incoherency could be that more individual post-drought nitrate responses were missed for springs than for wells due to inconsistent seasonal sampling-intervals, particularly after 2006, when the monitoring network and frequency was gradually thinned out (LUBW, 2018).
In the terrestrial system, the severity of the 2003 central European drought has been documented from the lysimeter scale (Seneviratne et al., 2012) up to the scale of the GRACE twin satellites (Andersen et al., 2005). While the 2003 drought event is unique in our data set in terms of drought days and nitrate responses during following years, there was another severe drought that hit Central Europe in 2018/19. First studies reported that this drought event generated even larger water storage deficits (Boergens et al., 2020) and had stronger impacts on Central European forests than the 2003 drought (Schuldt et al., 2020). However, nitrate data for 2019 were not yet available for this study. Based on the post-drought nitrate patterns in 2003/2004 it can be expected that drought termination in 2018/2019 and nitrate flushes will also impact the groundwater quality for several years.
Overall, our analysis underlined that regional patterns of quantitative groundwater responses to drought are variable in space and time, because they reflect the travel times of water from the land surface to the sampling location and thus include, apart from meteorological forcing, both unsaturated zone variability of recharge areas and different aquifer characteristics. Therefore, it is also not suprising that indices such as SPI or SPEI failed to predict the severity of European groundwater droughts (Kumar et al., 2016), because these indices are pure surface water measures. As up to 75% of the public water supply in our study region originates from groundwater wells or springs (LUBW, 2020) this analysis has a direct bearing on drinking water supply. Since droughts and extreme weather events are projected to occur more often in a changing climate (Xu et al., 2019), higher intensities and frequencies of dry-wet-cycles may be expected. Then considerable nitrate flushes after drought termination will occure more often. Further studies are needed to investigate potential consequences. These may include long-term increases of nitrate concentrations with negative effects on drinking water quality and on the ecological status of rivers, like for example, found in the upper Mississippi agricultural basin (Loecke et al., 2017). Extraordinary high post-drought mean nitrate concentrations found in this study for groundwater reservoirs of southwest Germany in 2006 (Figure 2(d)) should be regarded as a warning sign.
5 CONCLUSIONS
Analyzing data from 41 springs and 44 groundwater wells all across the 35 750 km2 federal state of Baden-Wuerttemberg in southwest Germany we found that 91% of all monitoring sites showed at least one exceptionally high nitrate concentration as a response to the 2003 drought event. Quantitative and qualitative post-drought effects were different between wells and springs, mainly because wells were primarily located in agricultural valleys and tapped water from porous aquifers, while springs largely drained fractured and karst aquifers of steep forested low mountain ranges. In terms of quantity, spring discharges recovered faster and responded more often to precipitation events than groundwater levels in wells. Once affected, well waterlevels were lowered for longer times and in some cases only fully recovered after extensive precipitation. In terms of quality, springs showed quicker (median of 101 days) but weaker (median of +1.3 mg/L) post-drought nitrate increases than wells (185 days, +3.4 mg/L), mainly because nitrogen inputs are higher in cropland than in forests and travel times in the unsaturated zone longer in porous than in fractured or karst aquifers. Overall, nitrate responses to the 2003 drought event terminated in the year 2006 when mean nitrate concentration in groundwater was highest. In general, it is concluded that the termination of a severe drought with following nitrate flushes may affect groundwater quality for several years, particularly in large, porous aquifers. As droughts and extreme weather events are projected to occur more often in a changing climate, higher intensities and frequencies of dry-wet-cycles may be expected. Then nitrate flushes after drought termination could intensify problems regarding water quality and supply.
ACKNOWLEDGEMENTS
This study was carried out within the research project DRIeR, which was supported by the Wassernetzwerk Baden-Württemberg (Water Research Network) and funded by the Ministerium für Wissenschaft, Forschung und Kunst Baden-Württemberg (Ministry of Science, Research and the Arts of the Land of Baden-Württemberg). Inga Kleinewietfeld contributed to the analysis of the groundwater data.
Open Research
DATA AVAILABILITY
All data used in the study can be obtained from the responsible State Environmental Agency of Baden-Württemberg. Both groundwater/spring hydrological and water quality data are freely downloadable via https://udo.lubw.baden-wuerttemberg.de/public/ (water quantity data) and https://jdkgw.lubw.baden-wuerttemberg.de/ (water quality data).


