Streamflow generation in semi-arid, glacier-covered, montane catchments in the upper Shule River, Qilian Mountains, northeastern Tibetan plateau
Abstract
Streamflow generation was investigated using isotopic and geochemical tracers in semiarid, glacier-covered, montane catchments in the upper Shule River, northeastern Tibetan Plateau. Samples from stream water, precipitation, glacier meltwater, and groundwater were collected at the Suli and Gahe catchments along the Shule River, with an area of 1908 and 4210 km2, respectively. The samples were analysed for stable isotopes of water and major ions. Results of diagnostic tools of mixing models showed that Ca2+, Mg2+ and Cl−, along with δ18O and δ2H, behaved conservatively as a result of mixing of three endmembers. The three endmembers identified by the mixing analysis were surface runoff directly from precipitation, groundwater, and glacier meltwater. Streamflow was dominated by groundwater, accounting for 59% and 60% of streamflow on average in the Suli and Gahe catchments, respectively, with minimum groundwater contribution in July (47% and 50%) and maximum contribution in October (69% and 70%). The contributions of surface runoff were slightly higher in the Suli catchment (25%) than in the Gahe catchment (19%). However, the contributions of glacier meltwater were higher in the Gahe catchment (21%) compared to the Suli catchment (17%), as a result of a higher percentage of glacier covered area in the Gahe catchment. This difference followed well the non-linear power–law trend of many glacier-covered catchments around the world. As glacier retreat continues in the future, the reduction of streamflow in glacier-covered upper Shule catchment likely will be accelerated and possibly elsewhere in the Tibetan Plateau. This study suggests that it is critical to define the turning point of an accelerated reduction in glacier meltwater for glacier-covered catchments around the world in order to better assess and manage water resources.
1 INTRODUCTION
The glaciers in High Mountain Asia (HMA) play a critical role in the water supply for a large part of Asia (Bolch et al., 2012; Cogley, 2017). The glacier-covered areas of HMA have been warming up at much higher rates than the low-elevation plains (Pepin et al., 2015). The warming has accelerated glacier melt in the past decades (Kong & Pang, 2012). When a glacier's mass balances become negative, the total meltwater from a glacier decreases due to the reduction in glacier volume and area (Ragettli et al., 2016). Kraaijenbrink et al. (2017) have estimated that glacier-covered areas would be reduced by up to 70% in the Qilian Mountains of northeastern Tibetan Plateau if the air temperature in the region increases by 1.5°C by 2100. Based on the Second Chinese Glacier Inventory, Sun, Liu & Yao (2015) estimated that the area of glaciers and ice reserves in the Shule River catchment are the largest in the Qilian Mountains, accounting for 32% and 35% of the corresponding total amount in the entire mountain range, respectively. In downstream arid and semi-arid regions, snow and glacier meltwater comprise of a significant part of river runoff, particularly during dry and warm months (Rodriguez et al., 2016). The annual glacier melt runoff accounts for 2% of the total runoff for China but as much as 13% for western China, including the Tibetan Plateau (Yao et al., 2004).
Streamflow generation processes are complicated by the presence of glaciers and studies are needed to improve understanding of hydrologic response to glacier dynamics and melting (Cable et al., 2011). Hydrological processes and runoff composition of catchments with different amounts of glacial cover vary greatly (Zhang et al., 2012). Where glaciers are present, streamflow variability is strongly influenced by the timing and amount of runoff contributed by glacier melt (Dahlke et al., 2014).
Hydrologic models have enhanced the understanding of glacier ablation processes and their hydrological role (Verbunt et al., 2003). For example, Gao et al. (2010) and Zhang et al. (2019) used hydrological models to simulate and project runoff in the upper Shule River catchment. Despite these studies, large uncertainties on the hydrologic role of glaciers in remote regions still exists due to the insufficient observational networks in these remote areas (Pellicciotti et al., 2014). In addition, conducting research on runoff processes using hydrologic models in arid and semi-arid regions is challenging because of the great temporal and spatial variability of rainfall, high evaporation rates, deep groundwater resources, poorly developed soils, and in some cases the lack of surface runoff (Baraer et al., 2009). Thus, endmember mixing analysis is the most reasonable and valuable method of hydrograph separation in remote mountain catchments. Studies on hydrograph separations using natural tracers conducted in have identified the importance of snowpack and glaciers as primary storage regulating the timing of runoff relative to precipitation occurrence (Baraer et al., 2009; Gordon et al., 2015). Fewer studies have attempted to apply such a method at larger catchment scales of hundreds or even thousands of square kilometres (Acuña & Dahm, 2007; Camacho et al., 2015; James & Roulet, 2006; Soulsby et al., 2003).
Because disturbance from human activities in the upper Shule River is limited, it is an ideal area for studying the composition of runoff in a glaciated mountainous area under natural conditions. The Shule River catchment has also been well studied, including analysis of runoff characteristics (Ding et al., 2001), distribution patterns of permafrost (Sheng et al., 2010), hydrochemical characteristics (Zhou et al., 2014), and landscape pattern changes at different altitudes (Xie et al., 2010). Using natural tracers, this study aims to improve our understanding of streamflow generation at the large catchment scale in glacier-covered upper Shule River. We are specifically interested in determining (1) the endmembers that dominate streamflow; (2) the significance of glacial meltwater in streamflow at variable catchment scales; and (3) the implication of future glacier retreat for hydrologic responses at the large catchment scale.
2 RESEARCH SITE
The Shule River catchment, one of the three biggest inland river catchments in the Hexi Corridor of Gansu Province, is located in the western Qilian Mountains on the northeastern margin of the Tibetan Plateau (Chen et al., 2012). The upper Shule River catchment (96°51′, 39°49′), above Changmabao streamflow gauge, has an area of 1.14 × 10⁴ km2 and a mean elevation of 3885 m (Figure 1). There are more than a dozen glaciers in the catchment, with a total area of 544 km2. The upper Shule River catchment is also covered by permafrost, with an area of 9447 km2, which accounts for 83% of the total catchment area. The study was carried out in the Suli and Gahe subcatchments, with drainage areas of 1678 and 4210 km2, and an altitude range of 3501–5763 m and 3847–5011 m, respectively. The total area of glaciers in the Suli and Gahe catchments are 51.8 and 233.3 km2, respectively, which accounts for 3.1% and 5.5% of the study area.
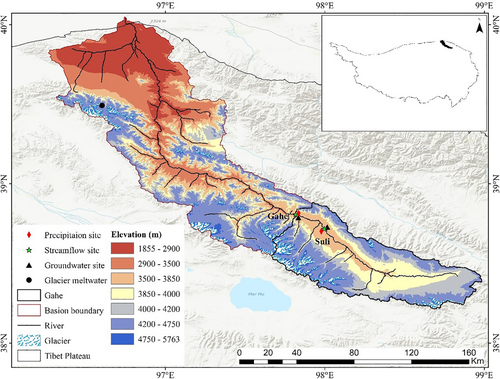
The study region has a continental arid climate and is mainly controlled by westerly winds, with low precipitation rates and annual mean air temperatures and high rates of evaporation (Pu et al., 2018). The annual mean precipitation and annual mean air temperature varied from 200 to 400 mm and −4.0 to −19.4°C, respectively from 1960 to 2010 (Yi et al., 2011). The annual evaporation rate was about 1200 mm (Xie et al., 2010). The Qilian Mountain Glacier and Ecological Environment Observation and Research Station is located at 2 km downstream from the terminus of Glacier No. 12 of Laohugou (LHG) Valley. The length and area of Glacier No. 12 of Laohugou is 10.1 and 21.9 km2, respectively, which is the largest glacier in Qilian Mountain (Wu et al., 2016). The strata in the alluvial fan of Shule River are fully exposed, with deposits ranging from Quaternary to Proterozoic and to Cenozoic. The aquifer system is dominated by Quaternary sediments, including alluvial, aeolian and lacustrine deposits.
3 MATERIALS AND METHODS
3.1 Field measurements, sample collection and analysis
Streamflow stage level was measured every 15 min at Suli and Gahe streamflow gauges using a HOBO water level sensor (Onset, U20-001-04). A rating curve between stage level and discharge was developed by instantaneous measurement of flow velocity using a StreamPro Acoustic Doppler Current Profiler (ADCP) once every 2 h of the day in various high and low flow periods. Precipitation amount was measured by Geonor T-200B weighing rain and snow metre, which has a water inlet area of 200 cm2 and the resolution of 0.1 mm. In order to reduce the loss of precipitation caused by wind and evaporation, a metal windshield was installed around the instrument and antifreeze and mineral oil were added. The instrument was installed at two altitudes, 3915 m (98°18′, 38°25′) in the Suli catchment and 3446 m (97°43′, 38°50′) in the Gahe catchment. The measurements of streamflow and precipitation began in January 2009.
Samples were collected from stream water, precipitation, glacier meltwater from May to October in 2009. Precipitation was collected immediately after each precipitation event in order to minimize the alteration of heavy isotopes by evaporation. During the sampling period, rainfall was the dominant form of precipitation. Stream water samples were collected approximately once a week along the main stream channel at Suli and Gahe streamflow gauges. Groundwater was collected from two perennial springs, approximately weekly. The springs are located at 3693.7 m (98°16′, 38°42′) in the Suli catchment and at 3469.5 m (97°44′, 38°49′) in the Gahe catchment. Glacier meltwater sampling was conducted at the Qilian Mountain Glacier and Ecological Environment Observation and Research Station. Due to the limited access, glacial meltwater was collected every week to every 2 weeks in LHG Glacial No. 12, outside of the Suli and Gahe catchments but within the upper Shule River catchment (Figure 1).
wWater samples were collected in polyethylene bottles that have been previously rinsed with deionized water. During the sampling processes, bottles were rinsed three times with the sample water. Samples were filtered through 0.45 μm Millipore membrane for major element analyses. All samples were chilled and transported to the State Key Laboratory of Cryosphere Science, Cold and Arid Regions Environmental and Engineering Research Institute, Chinese Academy of Sciences in Lanzhou where they were kept frozen until analysis.
All samples were analysed for stable water isotopes (18O and 2H) and major ions (Table 1). A Liquid-Water Isotope Analyser (DLT 100, Los Gatos, USA), with an off-axis integrated cavity output spectroscopy (OA-ICOS), was used to analyse for stable isotopes of water. The isotopic ratios are expressed in per mil (‰) relative to Vienna Standard Mean Ocean Water (V- SMOW): δ18Osample = [(Rsample/RVSMOW)-1] × 103, where R is the ration 18O/16O or 2H/1H. Analytical precision of δ2H and δ18O was ±0.6‰ and ±0.2‰, respectively. The concentration of Ca2+, Mg2+, Na+, and K+ were analysed using Atomic Absorption Spectroscopy (AAS) method. The concentration of anions (Cl−, SO42−) was analysed by Ion Chromatography (IC, DX-120, Dionex, Germany). The reported value for each sample represents the mean of two consecutive measurements. Analytical precision was less than 1% and the detection limit of all was less than 0.1 mg L−1 for all major ions.
| Location | Water type | Ca2 + | Mg2 + | Na+ | K+ | Cl− | SO42− | δ18O | δD | |
|---|---|---|---|---|---|---|---|---|---|---|
| μeq L−1 | μeq L−1 | μeq L−1 | μeq L−1 | μeq L−1 | μeq L−1 | ‰ | ‰ | |||
| Suli | Streamflow (n = 26) | Median | 1368.5 | 1837.5 | 511.5 | 53.9 | 274.9 | 622.1 | −8.75 | −59.79 |
| 25% | 1242.2 | 1588.9 | 484.67 | 40.1 | 245.5 | 497.3 | −8.85 | −60.97 | ||
| 75% | 1675.7 | 2043.5 | 538.6 | 68.9 | 319.9 | 784.5 | −8.50 | −57.77 | ||
| Precipitation (n = 19) | Median | 701.6 | 618.9 | 46.9 | 40.0 | 42.5 | 93.2 | −9.02 | −65.62 | |
| 25% | 618.5 | 416.5 | 25.2 | 11.9 | 28.1 | 34.6 | −12.42 | −90.28 | ||
| 75% | 892.9 | 780.2 | 70.4 | 73.7 | 57.5 | 154.9 | −6.50 | −39.92 | ||
| Groundwater (n = 26) | Median | 3884.1 | 4374.8 | 936.2 | 79.0 | 598.0 | 2065.4 | −8.21 | −49.16 | |
| 25% | 3273.3 | 3884.3 | 775.3 | 65.2 | 528.7 | 1968.1 | −8.56 | −50.89 | ||
| 75% | 4186.7 | 4694.9 | 1089.7 | 84.0 | 657.9 | 2196.4 | −7.64 | −42.30 | ||
| Gahe | Streamflow (n = 26) | Median | 2024.8 | 2568.0 | 585.4 | 63.9 | 334.4 | 711.4 | −8.54 | −57.81 |
| 25% | 1600.7 | 2054.7 | 544.8 | 46.1 | 303.1 | 582.8 | −8.74 | −59.12 | ||
| 75% | 2453.8 | 3049.1 | 641.1 | 75.3 | 421.9 | 947.9 | −8.32 | −56.48 | ||
| Precipitation (n = 15) | Median | 217.2 | 211.6 | 39.5 | 14.7 | 17.8 | 27.2 | −7.32 | −47.09 | |
| 25% | 172.3 | 219.7 | 20.5 | 9.6 | 14.3 | 18.1 | −9.31 | −67.85 | ||
| 75% | 401.7 | 439.4 | 52.5 | 35.1 | 28.4 | 45.4 | −5.04 | −33.27 | ||
| Groundwater (n = 27) | Median | 4092.8 | 4795.2 | 1150.0 | 130.5 | 672.9 | 1393.8 | −8.07 | −55.62 | |
| 25% | 3825.4 | 4109.7 | 890.0 | 88.5 | 509.9 | 1305.7 | −8.27 | −57.30 | ||
| 75% | 4208.3 | 5368.1 | 1230.1 | 145.3 | 746.3 | 1547.3 | −8.00 | −54.57 | ||
| Laohugou | Glacier meltwater (n = 17) | Median | 1216.9 | 1054.9 | 16.1 | 30.1 | 43.8 | 300.6 | −12.91 | −90.88 |
| 25% | 1043.1 | 878.8 | 6.1 | 27.2 | 40.9 | 207.5 | −13.85 | −97.18 | ||
| 75% | 1238.5 | 1230.7 | 28.7 | 43.1 | 48.5 | 346.2 | −12.66 | −87.96 |
3.2 Endmember mixing analysis
Endmember mixing analysis (EMMA) in this study followed the procedures of Liu, Bales, et al. (2008) and Barthold et al. (2011), which include (1) application of principal component analysis (PCA) and the Rule of One to determine the suitable dimensionality of the chemistry of stream water; (2) identification of endmembers; and (3) calculation of endmember contributions to streamflow. To determine the number of endmembers and conservative tracers, diagnostic tools of mixing models were applied using stream-water chemistry without using the information of endmembers following Hooper (2003). The PCA method was conducted to find a lower dimensional space that describe the variability of the data set. According to the Rule of One, the number of principal components plus one is then the number of endmembers (Jöreskog et al., 1976). The dimensionality of U-space is determined by the number of eigenvectors, or principal components (PCs), which is retained from PCA. Conservative tracers were identified by analysing the distribution of residuals (the difference between projected and measured values). Conservative mixing of endmembers with different chemical signals is a linear process, but the chemical equilibrium of ion with different charges is a high order polynomial (Hooper, 2003). Thus, this analysis was used to assess the fitness of stream water chemistry to a lower dimensional mixing subspace. If the distribution of residuals between the measured and projected concentrations for isotopes and ions is random, it suggests a well-defined mixing space. On the contrary, any structure in the distribution of residuals means a lack of fit in the mixing subspace, implying a violation of one of the assumptions on which EMMA is based.
To construct the mixing diagrams in the case of three endmembers, the first two PCA projections with which eigenvectors were extracted from the correlations of conservative tracers in stream water in both Suli and Gahe catchments were used following Liu, Parmenter, et al. (2008). Three criteria were used to identify eligible endmembers from potential ones (Liu et al., 2013). First, qualified endmembers should circumscribe most, if not all, stream water samples. Second, for all tracers used in the analysis, the distance between endmembers in U-space (orthogonal projections) and S-space (original observations) should be relatively short. Third, stream-water chemistry and isotopes must be well simulated for conservative tracers by using the results of EMMA. It is worth noting that this simulation is not recurring as the correlation matrix of conservative tracers in stream water was used in extracting the eigenvectors for orthogonal projections rather than the absolute concentrations (Liu et al., 2004).
3.3 Uncertainty analysis
Uncertainties were also considered for the quantification of endmember contributions. Uncertainty in hydrograph separations can be separated into ‘statistical uncertainty’ based on the spatial and temporal variability of the endmember values and the laboratory error and into ‘model uncertainty’ based on the violations of the underlying assumptions (Klaus & McDonnell, 2013). The uncertainties of tracer-based hydrograph separation were usually caused by: (i) tracer analysis and discharge measurement; (ii) intra-storm variability of isotopic and chemical concentrations; (iii) elevation effect of isotopic composition; (iv) dissolution of minerals during runoff formation; and (v) general spatial heterogeneity of tracer concentrations. Studies suggested that the uncertainty in the measurement method was generally less important than that in the temporal and spatial variations of tracer concentrations (Uhlenbrook & Hoeg, 2003).
To minimize the model uncertainties, a set of varying number of conservative tracers were tested to develop mixing diagrams following Barthold et al. (2011) and each endmember was also characterized differently using median and mean values of all samples and an individual sample with the shortest endmember distances for all tracers. Liu et al. (2020) have recently demonstrated that mean or median value of chemical concentrations in all precipitation samples may not truly represent the chemical signature of surface and near-surface runoff and using an individual sample selected following the shortest endmember distance turned out to be effective in EMMA.
4 RESULTS
4.1 Precipitation and discharge
The total precipitation during the study period was 378 mm at the higher elevation Suli catchment and 282 mm at the lower elevation Gahe catchment. The daily precipitation between sites was highly correlated, with a correlation coefficient of 0.68 (p < 0.01). The maximum daily precipitation was 19.2 and 14.1 mm in the Suli and Gahe catchments, respectively, which occurred in early September due to the monsoon rainfall.
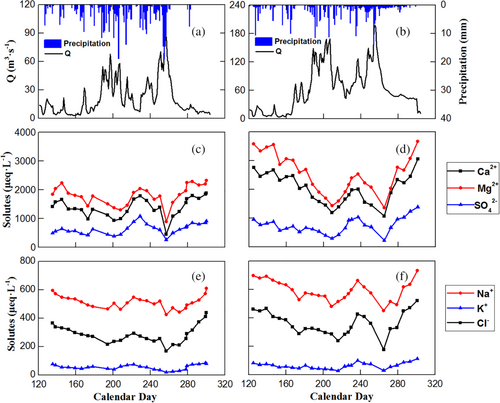
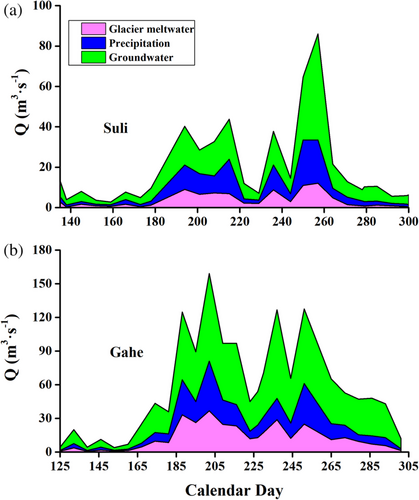
Temporal variation of daily discharge was similar at both streamflow gauges, with a correlation coefficient of 0.89 (p < 0.001). At the Suli gauge, discharge ranged from 2.8 to 87.9 m3 s−1, with a mean of 20.6 m3 s−1. At the Gahe gauge, discharge ranged from 3.8 to 198.0 m3 s−1, with a mean of 62.2 m3 s−1. The mean daily discharge at the Gahe gauge was about three times higher than at the Suli gauge. The discharge showed substantial seasonal variation and was characterized by two major peaks, which were apparently driven by precipitation events (Figure 2(a) and (b)). The first peak occurred in July, with a peak discharge of 67.9 and 168.3 m3 s−1 at the Suli and Gahe gauges, respectively, and the second one in September, with a peak discharge of 87.9 and 198.0 m3 s−1. Prior to the two rainfall driven peaks, there was a minor peak in May, which was driven by snowmelt.
4.2 Chemical composition
Ionic concentrations in stream water were higher in the Gahe catchment than in the Suli catchment (Table 1 and Figure 2(c)–(f)). For example, the median concentrations of Ca2+ and SO42− were 2025 and 711 μeq L−1 in the Gahe catchment, respectively, which were 1.5 and 1.1 times of those in the Suli catchment. However, the temporal variation of ionic concentrations was similar in both catchments, with higher concentrations in late spring and the lowest concentrations in September. For example, the concentration of Mg2+ was 2235 μeq L−1 on May 25th and gradually decreased to 886 μeq L−1 on September 14th in the Suli catchment. Ionic concentrations were all positively correlated with each other at both catchments, with a significance level at p < 0.01 for all ions except between SO42− and Na+ in the Suli catchment (Table 2). The temporal variation of ionic concentrations generally followed the opposite pattern of stream discharge. The Pearson correlation coefficients between ionic concentration and discharge varied from −0.43 to −0.67 in the Suli catchment and from −0.28 to −0.75 in the Gahe catchment (Table 2). Compared to Ca2+, Mg2+, and SO42−, the concentrations of Na+, K+ and Cl− varied only slightly (Figure 2), with relatively lower Pearson correlation coefficients with discharge (Table 2). For example, the maximum concentration of Na+ was 611 μeq L−1 on October 27th and the minimum concentration was 424 μeq L−1 on September 14th in the Suli catchment.
| Runoff | Ca2+ | Mg2+ | Na+ | K+ | Cl− | SO42− | |
|---|---|---|---|---|---|---|---|
| Suli (n = 26) | |||||||
| Ca2+ | −0.60a | ||||||
| Mg2+ | −0.67a | 0.96a | |||||
| Na+ | −0.47a | 0.67a | 0.63a | ||||
| K+ | −0.49a | 0.69a | 0.61a | 0.72a | |||
| Cl− | −0.59a | 0.74a | 0.74a | 0.88a | 0.84a | ||
| SO42− | −0.43 | 0.88a | 0.77a | 0.46 | 0.57a | 0.51a | |
| Gahe (n = 26) | |||||||
| Ca2+ | −0.75a | ||||||
| Mg2+ | −0.74a | 0.98a | |||||
| Na+ | −0.48a | 0.79a | 0.84a | ||||
| K+ | −0.28 | 0.64a | 0.65a | 0.75a | |||
| Cl− | −0.45 | 0.79a | 0.83a | 0.91a | 0.86a | ||
| SO42− | −0.36 | 073a | 0.69a | 0.68a | 0.91a | 0.79a | |
- a Indicate the correlation coefficient is statistically significant at <0.01.
The ionic concentrations in groundwater were higher in the Gahe catchment than the Suli catchment except for SO42−. For example, the median concentrations of Na+ and K+ were 1150 and 131 μeq L−1 in the Gahe catchment, respectively, which were 1.2 and 1.6 times of those in the Suli catchment. The concentrations of SO42− were 2065 and 1394 μeq L−1 in the Suli and Gahe catchments, respectively. However, the concentrations of all ions in precipitation were lower in the Gahe catchment than in the Suli catchment. For example, the median concentrations of Na+ and Cl− were 39.5 and 17.7 μeq L−1 in the Gahe catchment, respectively, which were 80% and 40% of those in the Suli catchment. The median concentrations of Ca2+, Mg2+and SO42− in glacier meltwater were much higher than those in precipitation, which were 1217, 1055 and 301 μeq L−1, respectively. However, the median concertation of Na+, K+ and Cl− in glacier meltwater was similar in magnitude to precipitation, which was 16.1, 30.0 and 43.8 μeq L−1, respectively.
4.3 Water isotopes
Isotopic values varied substantially in precipitation during the monitoring period in both catchments (Figure 3). The δ18O values in precipitation ranged between −25.2‰ and −1.0‰ and between −16.8‰ and −0.3‰ in the Suli and Gahe catchments, respectively, with a precipitation-weighted mean of −9.7‰ and −7.5‰. The difference in the mean isotopic values between the two catchments was apparently caused by the elevation effect, with more enriched isotopic composition at lower elevation in the Gahe catchment (Pang et al., 2011). Generally, most precipitation samples were close to the global meteoric water line (GMWL) of Craig (1961) (Figure 4). The local meteoric water line (LMWL) formed by these precipitation samples slightly differed from the GMWL, with a slope and an intercept of 7.7 and 7.9 in the Suli catchment and 7.8 and 10.8 in the Gahe catchment.
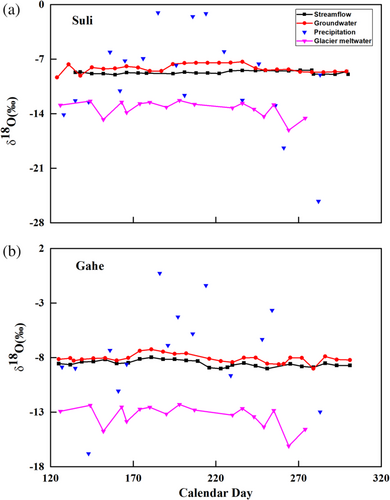
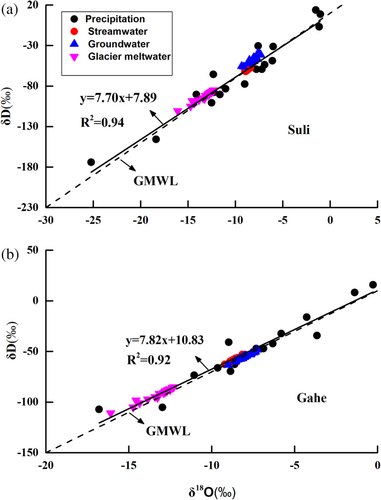
The temporal variation of isotopic values in stream water was significantly dampened compared to precipitation (Figure 3). The highest and lowest δ18O values in stream water were −8.4‰ and −9.0‰ in the Suli catchment and −9.2‰ and −8.0‰ in the Gahe catchment. Similar to stream water, the isotopic composition in groundwater varied little over time (Figure 3). δ18O values in groundwater ranged from −9.3‰ to −7.3‰, with a mean of −8.2‰ in the Suli catchment, and 9.0‰ to −7.3‰, with a mean of −8.0‰ in the Gahe catchment. Also, δ18O values in groundwater were very close to those in stream water. The δ18O values of glacier meltwater ranged between −16.1‰ and −12.3‰, with a mean of −13.4‰.
4.4 Conservative tracers and the number of endmembers
Diagnostic tools of mixing models were applied separately to both Suli and Gahe catchments in order to determine conservative tracers and the number of endmembers. The distribution of the residuals between measured and projected values of stream-water chemistry in 1- and 2-dimensional (1-D and 2-D) mixing space at both gauges are shown on Figure 5. The probability (p) for the slope was used to assess the distribution of residuals, along with the R2 value (when p > 0.05, it is considered as a random distribution). The absolute value of the slopes of linear fitted lines is equal to R2 in magnitude.
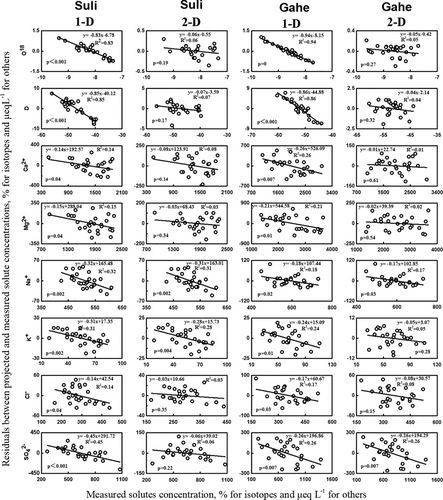
Isotopes and ionss in stream water in the Suli catchment clearly did not fit into the 1-D (linear) subspace, as evidenced by high R2 values and the pattern of the residuals (Figure 5). Even ions with modest R2 values such as Ca2+, Mg2+ and Cl− exhibit a structure in the residual distributions, with p < 0.05. When the dimensionality of the mixing subspace increased to 2, the fit was remarkedly improved for most isotopes and ions in the Suli catchment. The residual distributions of δ18O, δD, Ca2+, Mg2+, Cl− and SO42− were near a random pattern in 2-D mixing subspace (Figure 5). The R2 values (as well as the magnitude of the slope) for these isotopes and ions were less than 0.1, with p > 0.14. For example, R2 values of δD were 0.85 and 0.07 in 1-D and 2-D, respectively, with p < 0.05 and p = 0.17. In addition, the relative root-mean square error (RRMSE) values of these isotopes and ions drastically reduced from 1-D to 2-D spaces, which were less than 1% except for SO42− at 1.4% (Figure 6). The R2 and p values changed only slightly from 2-D to 3-D mixing subspaces for these isotopes and ions (data in 3-D not presented). In contrast, the residual distributions of Na+ and K+ were not a random pattern and the R2 and p values changed slightly from 1-D to 2-D mixing subspace. The R2 values in 1-D and 2-D were 0.32 and 0.31 for Na+ and 0.31 and 0.28 for K+. The RRMSE values of these isotopes and ions had little changes from 1-D to 2-D (e.g., from 3.5% to 3.4% for K+). In summary, stream water in the Suli catchment was primarily composed of three endmembers (two mixing subspaces), with 18O, 2H, Ca2+, Mg2+, Cl− and SO42− considered to be conservative tracers.
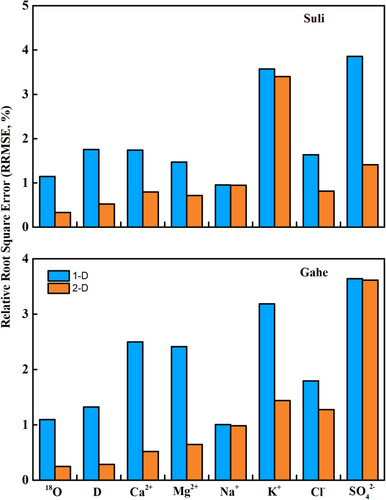
The same analysis was also performed in the Gahe catchment. In 1-D mixing subspace, the residuals between measurements and projections were highly correlated with measured concentrations in streamflow, with R2 values higher than 0.17 and p < 0.03 (Figure 5). When increased to 2-D mixing subspace, the residuals distribution had a significant change, and the residuals of most isotopes and ions were low and had no systematic pattern. The distributions of residuals were a random pattern for 18O, 2H, Ca2+, Mg2+, K+ and Cl−, with R2 values less than 0.1 and p > 0.15. Moreover, the RRMSE values of these isotopes and ions decreased sharply when mixing subspace increased from 1-D to 2-D (e.g., 2.5% in 1-D and 0.5% in 2-D of Ca2+) (Figure 6). Different from the Suli catchment, SO42− in 1-D and 2-D showed a linear relationship with the measurements (R2 = 0.26) in the Gahe catchment. The residual distribution pattern of the SO42− and the residual magnitude changed slightly from 1-D to 2-D (p = 0.007), indicating that SO42− did not behave completely conservative upon mixing. Even though R2 values were lower for Na+ than SO42−, 0.18 and 0.17 in 1-D and 2-D mixing subspace, with p = 0.02 and 0.03, respectively, the residual distribution was not a random pattern. Meanwhile, the RRMSE values of SO42− and Na+ declined little, from 3.64% in 1-D to 3.62% in 2-D for SO42− and from 1.01% in 1-D to 0.98% in 2-D for Na+ (Figure 6). Therefore, 18O, 2H, Ca2+, Mg2+, K+ and Cl− were deemed to be conservative tracers in the Gahe catchment.
4.5 Determination of endmembers and model uncertainties
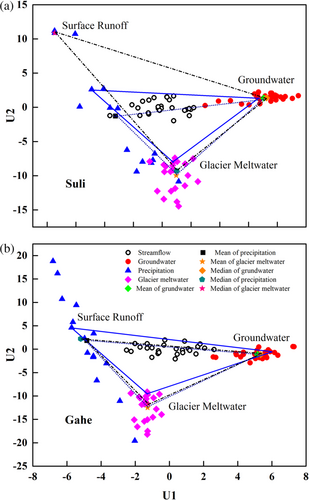
A set of varying number of conservative tracers were tested to develop mixing diagrams following Barthold et al. (2011). As a result, a total of 28 mixing diagrams were evaluated, including all potential combinations of two or more tracers identified above using the diagnostic tools of mixing models for both Suli and Gahe catchments. All mixing diagrams suggested that precipitation (in the representation of surface runoff or/and near-surface runoff), glacier meltwater and groundwater were eligible endmembers to bound most if not all stream water samples. The results also suggested that the mixing diagram constructed by δ18O, Ca2+ and Mg2+ with endmembers characterized by individual samples of shortest endmember distances were the best to meet all three criteria set forth in the method. When the medians and means of all endmembers were projected into the U-space of the stream water, the models did not conform the first two criterion. For example, many stream-water samples were out of the triangle they form if endmembers were characterized by means and medians (Figure 7). The endmember distances were also much higher for means and medians than for the selected individual samples for most if not all tracers applied in the models (Table 3). For the simulated isotopic values and ionic concentrations in stream water, the slope and R2 values between measured and simulated concentrations were much different from 1 when endmembers were characterized by means and medians. When endmembers were characterized by individual samples, however, the isotopic compositions of 18O and 2H were very well simulated for both Suli and Gahe catchments, with a slope near 1.0 and R2 greater than 0.93 between measured and simulated values (Figure 8). Linear-regression relations between simulated and measured concentrations for Ca2+, Mg2+, Cl− and SO42− in the Suli catchment showed R2 values ranging from 0.91 to 0.97, and slopes from 0.95 to 1.06, indicating that the selected EMMA model is a strong, unbiased predictor of stream solute concentrations. Even though Na+ and K+ were not completely conservative, the simulation of Na+ and K+ were reasonably good, with an R2 of 0.81 and 0.87, respectively. The concentrations of Ca2+, Mg2+, K+ and Cl− were also well simulated at the Gahe catchment, with an R2 greater than 0.94 between observed and simulated values. Similarly, the simulation of concentrations of Na+ and SO42− was reasonably good, with an R2 of 0.80 and 0.84.
| Potential endmember | Three-tracer model | Four-tracer model | Five-tracer model | |||||||||||
|---|---|---|---|---|---|---|---|---|---|---|---|---|---|---|
| δ18O | Ca2+ | Mg2+ | δ18O | Ca2+ | Mg2+ | Cl− | δ18O | δD | Ca2+ | Mg2+ | Cl− | |||
| Suli | Best | Groundwater | 0.6 | 0.4 | 0.5 | 2.1 | 0.1 | 5.2 | 8.2 | 2.0 | 47.7 | 14.4 | 11.8 | 15.7 |
| Individual | Precipitation | 1.9 | 10.6 | 13.2 | 10.7 | 2.8 | 5.1 | 0.9 | 9.7 | 63.1 | 20.5 | 35.8 | 83.8 | |
| Sample | Glacier meltwater | 0.2 | 0.6 | 0.7 | 3.0 | 18.1 | 23.9 | 19.5 | 6.6 | 48.8 | 17.1 | 30.0 | 147.2 | |
| Groundwater | 10.7 | 8.7 | 8.7 | 13.7 | 10.4 | 7.5 | 4.1 | 13.6 | 47.7 | 29.8 | 17.2 | 58.3 | ||
| Median | Precipitation | 1.9 | 12.2 | 20.7 | 0.3 | 4.2 | 39.8 | 29.4 | 16.8 | 63.5 | 23.9 | 33.9 | 170.9 | |
| Glacier meltwater | 1.3 | 4.4 | 6.0 | 7.1 | 17.3 | 10.1 | 154.4 | 23.6 | 48.9 | 17.3 | 21.3 | 154.4 | ||
| Groundwater | 12.3 | 10.3 | 9.9 | 15.7 | 12.3 | 8.5 | 4.8 | 2.5 | 2.3 | 98.8 | 30.7 | 159.9 | ||
| Mean | Precipitation | 3.1 | 14.2 | 13.2 | 0.3 | 4.2 | 39.8 | 29.4 | 15.7 | 22.4 | 32.1 | 54.6 | 129.3 | |
| Glacier meltwater | 1.5 | 5.3 | 7.4 | 6.6 | 17.5 | 8.0 | 135.9 | 0.6 | 4.5 | 56.4 | 17.3 | 120.8 | ||
| Gahe | Best | Groundwater | 0.0 | 1.0 | 1.0 | 0.7 | 0.9 | 0.9 | 1.0 | 0.0 | 0.1 | 1.7 | 2.3 | 1.0 |
| Individual | Precipitation | 0.0 | 2.5 | 6.5 | 1.4 | 1.6 | 14.1 | 7.0 | 0.6 | 1.7 | 33.4 | 25.1 | 23.5 | |
| Sample | Glacier meltwater | 0.0 | 3.9 | 3.9 | 1.9 | 2.3 | 2.7 | 3.6 | 1.4 | 1.6 | 4.6 | 11.7 | 13.1 | |
| Groundwater | 0.1 | 4.8 | 5.5 | 0.4 | 3.0 | 8.1 | 6.6 | 0.5 | 0.8 | 3.6 | 7.7 | 5.2 | ||
| Median | Precipitation | 0.0 | 28.4 | 37.4 | 0.0 | 35.3 | 38.7 | 3.9 | 0.0 | 0.1 | 54.2 | 17.7 | 30.0 | |
| Glacier meltwater | 0.1 | 26.0 | 43.4 | 0.8 | 2.3 | 81.1 | 108.6 | 1.8 | 1.8 | 12.6 | 59.2 | 48.7 | ||
| Groundwater | 0.1 | 3.9 | 4.4 | 0.1 | 3.7 | 5.2 | 1.7 | 0.6 | 0.7 | 4.3 | 4.7 | 0.1 | ||
| Mean | Precipitation | 0.1 | 27.6 | 47.2 | 1.0 | 7.4 | 96.2 | 113.9 | 2.8 | 3.1 | 9.1 | 70.6 | 57.1 | |
| Glacier meltwater | 0.0 | 12.0 | 15.9 | 0.2 | 29.9 | 0.9 | 22.6 | 0.9 | 1.1 | 40.0 | 11.1 | 35.9 | ||
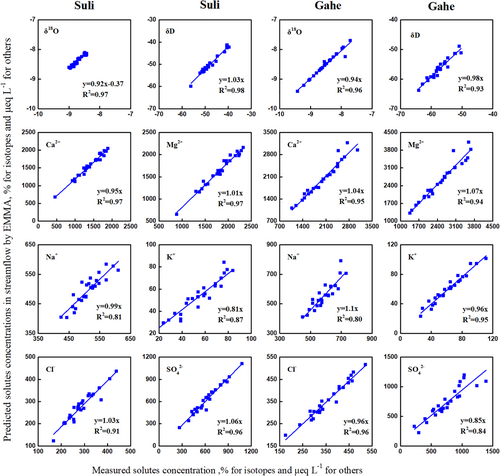
With hind sight, however, the contributions of endmembers did not change much for using individual samples compared to using means and medians of all samples for characterizing three endmembers. For example, the mean contributions of groundwater and glacier meltwater were 0.5% and 4.4% greater, respectively, when endmembers were characterized by isotopic value and ionic concentrations in individual samples than by means of all samples in the Suli catchment. The mean contributions of groundwater and glacier meltwater using medians were 2.5% and 3.3% greater than using the values of individual samples. In the Gahe catchment, the result was similar, but the difference was smaller between using isotopic value and ionic concentrations of individual samples and means and medians.
4.6 Endmember contributions and statistical uncertainties
Endmember contributions were resolved following Liu et al. (2017) and Liu et al. (2020). To estimate statistical uncertainties associated with spatiotemporal variation of tracer concentrations in endmembers and analytical errors, standard deviation was used if multiple samples were available and the analytical errors of 1% for ionic composition and 0.2‰ for δ18O were used for a single sample.
The endmember contributions were different for Suli catchment and Gahe catchment, though the same tracers were used (Table 4 and Figure 9). In the Suli catchment, the monthly mean contributions of the groundwater varied between 47% and 70%, with a mean of 58.6% and an uncertainty of 9.2%. The surface runoff contributed from 19.8% to 30.5%, with a mean of 24.9% and an uncertainty of 14.8%. The highest contribution (by both % of total flow and flow rate) of surface runoff occurred in July with the maximum precipitation. The contributions of the glacier meltwater ranged between 10.2% and 22.5%, with a mean of 17.0% and an uncertainty of 16.5%. In the Gahe catchment, the contributions of groundwater changed from 49.8% to 70.4%, with a mean of 60.1% and an uncertainty of 21.8%. The surface runoff contribution varied from 14.4% to 24.1%, with a mean of 19.3% and an uncertainty of 14%. The surface runoff contribution in the Gahe catchment was less than that in the Suli catchment, which was consistent with lower precipitation in the Gahe catchment. The contributions of glacier meltwater ranged from 17.5% to 26.1%, with a mean of 20.6%, and an uncertainty of 10.8%, which was greater than that in the Suli catchment.
| Month | Suli | Gahe | ||||
|---|---|---|---|---|---|---|
| Groundwater (%) | Precipitation (%) | Glacier meltwater (%) | Groundwater (%) | Precipitation (%) | Glacier meltwater (%) | |
| 5 | 61.9 ± 9 | 19.8 ± 16 | 18.3 ± 13 | 64.7 ± 26 | 17.8 ± 18 | 17.5 ± 14 |
| 6 | 58.2 ± 9 | 24.4 ± 17 | 17.3 ± 14 | 60.9 ± 22 | 17.2 ± 15 | 21.9 ± 12 |
| 7 | 47 ± 11 | 30.5 ± 20 | 22.5 ± 17 | 49.8 ± 17 | 24.1 ± 11 | 26.1 ± 8 |
| 8 | 50.1 ± 8 | 28.3 ± 14 | 21.6 ± 13 | 57.8 ± 20 | 20.0 ± 13 | 22.2 ± 10 |
| 9 | 55.4 ± 10 | 27.5 ± 18 | 17.1 ± 15 | 57.4 ± 17 | 22.8 ± 11 | 19.8 ± 8 |
| 10 | 69 ± 8 | 20.8 ± 14 | 10.2 ± 12 | 70.4 ± 29 | 14.4 ± 16 | 15.2 ± 13 |
5 DISCUSSION
5.1 Streamflow generation in large glacier-covered catchments
In the upper Shule River, groundwater is the major source of streamflow during the monitoring period from May to October. Our study showed that groundwater contributed 50%–70% in the Suli and Gahe catchments, with lower contributions in July and August and the highest contribution in October (Table 4). It is interesting that the percent contributions of groundwater did not change much from smaller Suli catchment (1678 km2) to larger Gahe catchment (4210 km2). Our results are consistent with other glacier-covered catchments of montane regions across the world, including smaller to larger catchments than ours. For example, the maximum groundwater contributions were 62% in two nested glacierized catchments (18.6 km2) in the Eastern Italian Alps from June 2011 to August 2013. In the Querococha catchment (63.8 km2; 12.8% glacier coverage) of the southern Cordillera Blanca, Peru, the entire catchment received 70% of groundwater during the 2006–2007 dry season (Baraer et al., 2009). The hydrograph separation results demonstrated that the Urumqi River was a groundwater-dependent, with groundwater accounting for more than 87% at Yingxiongqiao station (924 km2) right before it enters the mountain-front pediment plain (Kong & Pang, 2012). In the Kaap catchment (1640 km2) in South Africa, the hydrograph separations revealed that groundwater contribution varied from 64% to 98% of the total runoff (Camacho et al., 2015).
However, glacier meltwater comprises a significant portion of streamflow in the arid regions, and glacier meltwater can supply a very high percentage of river runoff during the dry, warm months of summer, particularly in smaller catchments. Our results showed that glacier meltwater contributed 17% and 20% on average in the Suli and Gahe catchments in the upper Shule River. The glacier meltwater contribution in the upper Shule River appears to be much lower than small glacier-covered catchments. Engel et al. (2016) reported that the maximum contribution of glacier melt reached to 65% in August in two nested glacierized catchments in the Eastern Italian Alps. In the Heishui Valley (7240 km2), hydrograph separation analysis showed that the contribution of snow and glacier meltwater varied from 63.8% to 92.6% (Liu et al., 2008). Estimated fractions of water sources as a results of hydrograph separation along the Kumalak River showed that glacier and snow meltwater accounted for 57%–64% of river flow at 14 km down from the glacier front and more than 57% at the downstream Xiehela hydrological station (12 800 km2) (Kong & Pang, 2012). In the Baishui River catchment (29.4 km2) of the Yulong Mountains, the two-component mixing model showed that the contribution of glacier meltwater varied from 40.7% to 62.2% with a mean of 53.4% (Pu et al., 2013). Xing et al. (2015) used path analysis and isotopic measurements in the upper Hailuogou Valley (94.7 km2) in Southwest China. The result showed that the majority of streamflow is dominated by glacier meltwater that represents about 63%–78% of the total discharge. Though much lower percent contribution than small catchments, glacial meltwater in the upper Shule River is still significant by volume (302 572 m3 at Suli and 1 128 556 m3 at Gahe stations from May to October in 2009) and plays an important role as “buffers” in regulating regional hydrology.
5.2 Implication for understanding climate change effect on regional hydrology
Glacier meltwater contributions to streamflow of glacier-covered catchments around the world were compiled based on recent publications (Table 5). The contributions were calculated by various methods, mainly numerical models and natural tracers. Climate, catchment size and elevation ranges vary significantly amongst these catchments. The percent contribution of glacier-meltwater to streamflow was significantly (R2 = 0.63, p < 0.001) correlated with percent of glacier-covered area to catchment area by a power–law relation (Figure 10). Five sites from Lambrecht and Mayer (2009) apparently showed a totally different trend and were not included in this analysis. In their study, the glaciers were divided into two groups. For these two groups the mass balance series of the two reference glaciers (Hintereisferner and Vernagtferner) were used to determine the volume loss per year for the different catchment areas, scaled to the volume loss determined for the entire period from 1969 until 1998. We assume that the discrepancy may be caused by the mismatch between the year corresponding to the glacier-covered area and the runoff data and the calculation method of glacier volume loss. The results from our study in the Suli and Gahe catchments followed the power–law curve very closely (note that they were included in the trend analysis).
| Catchment (country) | Area-km2 (elevation range) | Glacier area (% of glacier coverage) | % Glacier runoff | Covered periods (years and seasons) | Methods | References |
|---|---|---|---|---|---|---|
| Yarkant River (China) | 32 900 (—) | 4712 (14.3%) | 51.3% | 2011–2050 | Degree-day model | Zhang et al., 2012 |
| Brahmaputra River (China) | 204 863 (Above 2000 m) | 4261 (2.1%) | 5.5% | 2010–2100 | VIC-CAS | Zhao et al., 2019 |
| Yellow River (China) | 123 023 (Above 2000 m) | 129 (0.1%) | 0.35% | 2010–2100 | VIC-CAS | Zhao et al., 2019 |
| Yangtze (China) | 140 073 (Above 2000 m) | 1249 (0.9%) | 3.7% | 2010–2100 | VIC-CAS | Zhao et al., 2019 |
| Mekong (China) | 53 644 (Above 2000 m) | 219 (0.4) | 1.3% | 2010–2100 | VIC-CAS | Zhao et al., 2019 |
| Salween (China) | 75 506 (Above 2000 m) | 1041 (1.4) | 4.4% | 2010–2100 | VIC-CAS | Zhao et al., 2019 |
| Shiyanghe (China) | 41 600 (2000–5000) | 30.21 (0.07%) | 3% | 2010–2100 | Isotopic balance (18O, deuterium excess) | Li et al., |
| Urumqi River (China) | 924 (1500–2900) | 38 (4.1%) | 14.7% | 2012.5–2.13.5 | Isotopic and chemical balance (TDS, 18O) | Sun et al., 2016 |
| Yushugou River (China) | 308 (3500–4369) | 22.85 (7.4%) | 63% | 2013.4–2013.5 | Isotope balance (18O) | Wang et al., 2015 |
| Tarim River (China) | 1 020 000 (—) | 19 877.7 (1.9%) | 41.5% | 1961–2006 | Degree-day model | Gao et al., 2010 |
| Baishui River (China) | 29.4 (4365–4880) | 3.41 (11.6%) | 53.4% | 2009.5–2009.9 | Isotope balance (18O) | Pu et al., 2013 |
| Hailuogou (China) | 94.75 (1235–7645) | 25 (40%) | 63–78% | 2008.4–2009.10 | Path analysis | Xing et al., 2015 |
| Querococha (Peru) | 62 (4000–5150) | 3 (4.8%) | 30% | 1956–1996 | Water-balance computation | Mark & Seltzer, 2003 |
| Hulugou (China) | 23.1 (2960–4820) | 0.83 (3.6%) | 11% | 2012.7–2013.11 | Isotopic and chemical balance (18O, EC, Cl−, TDS) | Li et al., |
| Tarfala (Italian) | 18.6 (1632–3725) | 2.28 (12.3%) | 49–53% | 2011.7–2013.8 | Isotopic and chemical balance (EC, 18O) | Engel et al., 2016 |
| Vent | 165 (1877) | 66 (40%) | 8.6% | 1969–1999 | Degree-day model | Lambrecht & Mayer, 2009 |
| Oberried | 623 (1160) | 124.6 (20%) | 4.5% | 1969–1999 | Degree-day model | Lambrecht & Mayer, 2009 |
| Tumpen | 786 (931) | 141.5 (18%) | 4.5% | 1969–1999 | Degree-day model | Lambrecht & Mayer, 2009 |
| Mayrhofen | 611 (622) | 51.9 (8.5%) | 2% | 1969–1999 | Degree-day model | Lambrecht & Mayer, 2009 |
| Hart | 1095 (531) | 54.8 (5%) | 1.6% | 1969–1999 | Degree-day model | Lambrecht & Mayer, 2009 |
| Juncal River | 236.2 (2200–6100) | 47 (19.9%) | 50% | 2011.1–2012.4 | The Bayesian approach | Rodriguez et al., 2016 |
| Rhone | 95 590 (—) | 937.3 (1%) | 25% | 1908–2008 | Transient modelling | Huss, 2011 |
| Rhine | 160 800 (—) | 320.4 (0.2%) | 6.6% | 1908–2008 | Transient modelling | Huss, 2011 |
| Danube | 807 000 (—) | 469.9 (0.06%) | 9% | 1908–2008 | Transient modelling | Huss, 2011 |
| Shule | 11 391 (2054–5841) | 403.5 (3.5%) | 23.6% | 1971–2013 | VIC-CAS | Zhang et al., 2019 |
| Suli | 1908 (3841) | 51.8 (2.7%) | 17% | 2009.5–2009.10 | Isotopic and chemical balance (18O, Ca2+, Mg2+) | This paper |
| Gahe | 4210 (3521) | 233.3 (5.5%) | 20.6% | 2009.5–2009.10 | Isotopic and chemical balance (18O, Ca2+, Mg2+) | This paper |
- Note: — indicate the information is missing.
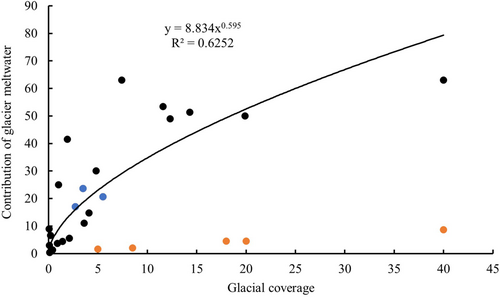
Based on the power–law relation, the glacier meltwater contribution (%) was extrapolated for the upper Shule River at the mountain-front section with a catchment area of 11 391 km2. The total area of glaciers in the upper Shule River catchment is 403.5 km2 between 2006 and 2010 according to the Second Chinese Glacier Inventory (Guo et al., 2015), which gives 3.5% of glacier-covered area. Thus, the glacier meltwater contribution was estimated, using the power–law relation, to be 18.6% of the total streamflow at the mountain-front section for the same study period. This result lies between the mean contributions of 17.0% in the Suli catchment and 20.6% in the Gahe catchment from EMMA (Table 4), consistent with their percentages of glacier-covered area to catchment area. Though this result is lower than that using a VIC-CAS (Variable Infiltration Capacity 4.2.0 model coupled glacier module with a dynamic glacier area scheme) model (23.6%) by Zhang et al. (2019) and that using a degree-day mass balance model (>30%) by Gao et al. (2011) for the same study area, it agrees reasonably well particularly if the difference in the study periods amongst and the uncertainties from these studies are considered. In addition, the discrepancy may be caused by the difference in the definition of glacier runoff. In glacio-hydrologic models, glacier runoff refers to the runoff from glacierized areas (Gao et al., 2017; Gao et al., 2020). But the glacier runoff defined by isotope and chemistry presents runoff generated from glacier itself. It is thus not surprising that glacier runoff is greater from the hydrologic modelling than from our tracer study.
The non-linear relationship between the percentage of glacial area and meltwater contribution may have a broader implication for understanding the regime change in glacier-melt over time following the theory of space for time substitution. Many studies have demonstrated that global warming leads to increased volume of glacier meltwater and increased mountain streamflow (e.g., Kong & Pang, 2012). However, the magnitude and timing of glacial runoff caused by future climate warming depends on the size of the glaciers and the rate of warming (Ye et al., 2001). With a scenario of continuous glacier retreat over time, there would be a turning point from which glacier meltwater would be reduced and the reduction could become accelerated with a significant reduction in glacier size (Ye et al., 2003). Consider that the curve on Figure 10 follows the time course in the upper Shule River catchment, that is, percent of glacial area gradually decreases over time and thus the progress of glacial coverage in time moves towards 0% on x-axis. The current percentage of glacial area appears to be near the turning point, defined by Ye et al. (2003), from which a further reduction in glacier area leads to an accelerated reduction in percent of glacier meltwater (the nature of the power–law yields accelerated changes towards zero). Based on the observed hydrologic data in the past 50 years in the upper Shule River catchment, Lan et al. (2012) found that summer streamflow has significantly increased and attributed the increase to an increased glacier meltwater. With a continuous glacier retreat in the upper Shule River catchment in future, however, summer streamflow increase may be reversed and become decreased due to a significant reduction in glacial area based on the power–law relation, which is in principle consistent with Ye et al. (2003) and Ragettli et al. (2016). This application in the upper Shule River suggests that it is critical to define the turning point of an accelerated reduction in glacier meltwater for glacier-covered catchments around the world in order to better assess and manage water resources.
6 CONCLUSIONS
Streamflow in the upper Shule River catchment was primarily generated from groundwater. However, glacier meltwater was an important flow component at varying catchment scales from 1908 to 11 391 km2 (~20% of streamflow). Glacier meltwater is of great importance in regulating regional hydrology in arid region. The percent contribution of glacier-meltwater to streamflow was significantly (p < 0.001) correlated with percent of glacier-covered area to catchment area by a power–law relation. With a continuous glacier retreat in future, glacier meltwater likely will be significantly reduced and the reduction may be accelerated in the upper Shule River catchment. This study suggests that it is critical to define the turning point of an accelerated reduction in glacier meltwater for glacier-covered catchments around the world in order to better assess and manage water resources.
ACKNOWLEDGEMENTS
This research was supported by several projects of the National Natural Science Foundation of China (41730751, 41771084, 41771087). The authors thank all participants in the field and in the laboratory for their contribution, which allows this study to progress in good conditions, particularly Qiudong Zhao and Yaping Chang.
Open Research
DATA AVAILABILITY STATEMENT
The data that support the findings of this study are available from the corresponding author upon reasonable request.


