Seasonal and short-term controls of riparian oxygen dynamics and the implications for redox processes
Abstract
Riparian zones are highly-dynamic transition zones between surface water (SW) and groundwater (GW) and function as key biogeochemical-reactors for solutes transitioning between both compartments. Infiltration of SW rich in dissolved oxygen (DO) into the riparian aquifer can supress removal processes of redox sensitive compounds like NO3−, a nutrient harmful for the aquatic ecosystem at high concentrations. Seasonal and short-term variations of temperature and hydrologic conditions can influence biogeochemical reaction rates and thus the prevailing redox conditions in the riparian zone. We combined GW tracer-tests and a 1-year high-frequency dataset of DO with data-driven simulations of DO consumption to assess the effects of seasonal and event-scale variations in temperature and transit-times on the reactive transport of DO. Damköhler numbers for DO consumption (DADO) were used to characterize the system in terms of DO turnover potential. Our results suggest that seasonal and short-term variations in temperature are major controls for DO turnover and the resulting concentrations at our field site, while transit-times are of minor importance. Seasonal variations of temperature in GW lead to shifts from transport-limited (DADO > 1) to reaction-limited conditions (DADO < 1), while short-term events were found to have minor impacts on the state of the system, only resulting in slightly less transport-limited conditions due to decreasing temperature and transit-times. The data-driven analyses show that assuming constant water temperature along a flowpath can lead to an over- or underestimation of reaction rates by a factor of 2–3 due to different infiltrating water temperature at the SW–GW interface, whereas the assumption of constant transit-times results in incorrect estimates of NO3− removal potential based on DADO approach (40%–50% difference).
1 INTRODUCTION
The notion that surface water (SW) and groundwater (GW) should be perceived as one entity rather than two separate components has been established over the last 20 years (Fleckenstein et al., 2010; Winter et al., 1998). Water and solute fluxes between SW and GW can significantly impact water quantity and quality of both compartments (Boano et al., 2010; Brunner et al., 2017). These fluxes vary seasonally due to periodic fluctuations of stream stage and GW elevations (Bernard-Jannin et al., 2017; Ranalli & Macalady, 2010), but also at shorter, event-driven temporal scales (Shuai et al., 2017). Disentangling reaction and transport processes and their importance for subsurface reactions modulated by seasonal variations and short-term events is challenging due to highly dynamic bio-geophysical characteristics of riparian environments (Kolbe et al., 2019; Pinay et al., 2015; Song et al., 2018).
Stream stage variations can increase exchange magnitudes within hyporheic and riparian zones, and enhance subsurface solute-turnover (Trauth et al., 2015; Trauth & Fleckenstein, 2017). Trauth et al. (2018) showed that, particularly in riparian zones along losing stream sections, infiltrating stream water can improve the availability of dissolved organic carbon (DOC) as an electron donor in the subsurface and in turn enhance denitrification of agricultural nitrate (NO3−). However, as denitrification requires low DO concentrations it also hinges on prior DO consumption in the infiltrating, oxygen-rich stream water, typically via aerobic respiration (Boano et al., 2010). Understanding the key controls and the spatio-temporal variations of these redox reactions is essential for defining appropriate measures to improve the natural attenuation of potentially harmful substances such as nitrate in river corridors (Abbott et al., 2016; Oldham et al., 2019).
The reactive potential along a subsurface flowpath depends on the time that a water parcel stays in contact with the reactive media (Oldham et al., 2013). The greater water travels through the riparian subsurface, the greater the exposure to potentially reactive zones. However, discharge events can reduce GW transit-times in riparian zones due to sudden increase of SW–GW hydraulic gradients, limiting the exposure time to reactive zones and reducing net reactions (Sharma et al., 2012). In the riparian zone, subsurface transit-times have been quantified applying natural tracers like: heat, electrical conductivity (EC), stable water isotopes, and noble gases (e.g., 222Rn, 37Ar; Schilling et al., 2017). Among them, cross-correlation analyses of natural EC variations is a simple, robust approach to derive transit-times in losing stream reaches by estimating time lags between the input (stream) and the output EC-signals measured in a monitoring well (Diem et al., 2013; Vieweg et al., 2016). However, Nixdorf and Trauth (2018) reported that the observed EC-signals in some riparian wells at losing stream sections could not only be attributed to direct surface water infiltration, but were instead also affected by stream water that had previously been stored in the banks. They found the estimated transit-times to be as much as two orders of magnitude lower compared to ‘true’ transit-times derived from introduced (e.g., natural gradient) tracer-tests. This indicates that transit-time estimates based on natural tracers such as EC may be uncertain under non-ideal conditions and that artificial tracers or a combination of both might be a more reliable alternative.
In addition to transit-times and DO concentrations, the biogeochemical reactions are temperature regulated (Pietikäinen et al., 2005; Sharma et al., 2012). Thus, seasonal and short-term temperature fluctuations driven by SW-GW exchanges may either fuel or hinder reactions depending on characteristics of infiltrating water in contrast to GW (Greskowiak et al., 2006; Zarnetske et al., 2011). Besides, water and heat propagate along subsurface flowpaths at different rates, with heat being strongly retarded due to interaction with the sediment matrix. There is a complex interaction between hydrological variations at different time scales, the associated heat and solute transport between SW–GW, and the biogeochemical reactions controlled by these variations. However, these complex interactions are difficult to characterize in the field and hence it is not surprising that to date only a few studies have attempted to explore them in field studies of GW–SW systems (Vieweg et al., 2016; Zarnetske et al., 2012).
This study extends these previous studies and aims to address major features controlling spatio-temporal variations of transit-times and DO consumption rates in riparian aquifers with a specific focus on the interplay between seasonal and event-scale variability. A fourth-order reach of the Selke Stream, a well instrumented and studied site (Nixdorf & Trauth, 2018; Vieweg et al., 2016) within the Bode Observatory of the TERENO initiative (Wollschläger et al., 2017) is used as a test case. At the site, we combined GW tracer-tests with high-frequency data of water levels, EC, and DO in the stream and in groundwater. We carried out a suite of well-to-well groundwater tracer-tests, employing salt (NaCl) and DO as tracers, in the riparian zone under a range of hydrologic conditions in terms of stream flow to: (i) derive GW transit-times; and (ii) acquire in-situ DO consumption rates (kDO). A simple DO consumption model was parameterized based on the acquired data and subsequently applied to high-frequency observation data. We show how temporal variations of temperature and transit-times affect riparian DO reactions and transport processes. Finally, the relationship between DO consumption rates and transit-times was evaluated using the concept of Damköhler numbers in order to characterize the reactive state of the system.
2 METHODS
2.1 Study area
Our field site is located at the Selke River, central Germany (51°43′37.79″N, 11°18′51.0″E), Figure 1. Previous studies at the site covered different aspects of flow, transport and reactions at the SW–GW interface with focus on in-stream and near-stream hyporheic processes (Munz et al., 2017; Trauth et al., 2014; Vieweg et al., 2016), however the interplay between transit-time and temperature variations in regulating redox state and processes within the riparian zone has been faintly explored. Measurements of hydraulic heads in the streambed and in riparian wells reveal that the stream reach is characterized by predominantly losing conditions (Munz et al., 2016). Mean annual discharge at the site is 1.5 m3/s. During summer, baseflow can be below 0.2 m3/s, while bankfull discharge (about 15 m3/s) can occur during spring snowmelt.
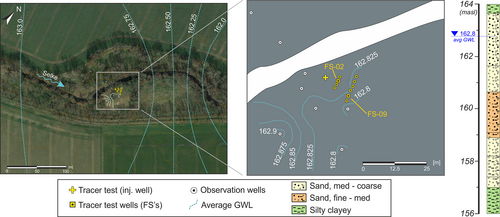
The riparian aquifer consists of fluvial sediments of up to 8 m thickness, ranging from medium sands to coarse gravels, underlain by clay-silt deposits forming the bottom of the alluvial aquifer. Groundwater levels are generally shallow, with mean depths to groundwater of 0.5 and 1.8 m in the winter and summer, respectively. Drilling core samples from the vicinity of the stream showed a layered system (Figure 1), with a continuous less-permeable unit (fine sand) at around 3–4 m below ground separating the system into two connected aquifer compartments, referred to as shallow and deep groundwater. The hydraulic conductivity of the aquifer material, determined by salt-tracer and slug-tests in the riparian wells, ranges from 1.7 × 10⁻³ to 1.2 × 10⁻² m/s (geometric mean: 3.72 × 10⁻³ m/s).
2.2 High-frequency data collection
Water levels, electrical conductivity (EC) and water temperature in stream (TSW) and groundwater (TGW) were measured by self-contained Solinst Levelogger Junior loggers (LTC). DO concentrations were monitored by self-contained DO loggers (HOBO Dissolved Oxygen Data Logger) in both stream and in groundwater. For capturing short temporal fluctuations, all loggers were set to a 10-min measuring interval from November 2017 until December 2018, comprising one full year of high-frequency measurements with few data gaps in between (10% of total dataset) due to probe malfunctioning and probe removal during maintenance. Stream discharge was calculated from a stream stage-discharge relation (Figure S1), based on stage readings and monthly manual discharge measurements using an electromagnetic flow meter (MF pro, Ott, Germany).
2.2.1 Discharge time-series decomposition
Discharge time-series were divided into baseflow and discharge events components to assess their different effects on subsurface processes. Baseflow separation was based on a rolling 5 days local minima (Gustard & Demuth, 2009); discharge events were defined according to the first derivatives of the discharge time-series using the functions findpeaks and local minima in MATLAB®. Significant events were defined as having a minimum peak prominence of at least 15% above the preceding baseflow value, with a minimum peak separation of 5 days imposed to avoid diminutive discharge variations and overlapping/double peak events that were counted as one large event.
2.3 GW transit-times from tracer-tests in the riparian aquifer
We carried out eight natural gradient tracer-tests in the riparian aquifer adjacent to the stream between November 2017 and September 2018 (Table 1). The tracer-tests captured changes in main flow directions and transit-times of the infiltrating stream water. A total of 11 nested 2″ PVC monitoring wells (including an ‘injection-well’), screened at depths between 1 and 6 m below ground (mbg), were equipped with LTC-loggers to monitor tracer breakthrough curves in different depths, at a 1 min interval and over a minimum period of 7 days after injection. The monitored locations were the same as for the long-term high-frequency data collection. Tracer (NaCl diluted in stream water) was injected below the groundwater table in the injection-well using a peristaltic pump. A packer isolated the well at 2.5 mbg to optimize tracer insertion by releasing it where maximum transport is expected. The tracer-test protocol was kept identical between different experiments with only the injection volumes and NaCl concentrations varying according to the hydrologic conditions. Injection durations varied, but were no longer than 20 min. Groundwater level variations in the injection-well were minimal during tracer-tests and considered to be negligible. In three of the experiments, a packer system was inserted in one of the monitoring wells to evaluate inner well mixing as the wells are fully screened. However, no significant differences between the wells with and without packer system were found. The specification of tracer-tests are summarized in Table 1.
| Tracer-test | Date | Stream | Groundwater (average) | Tracer | Injection | ||||||||
|---|---|---|---|---|---|---|---|---|---|---|---|---|---|
| Q (m3/s) | EC (mS/cm) | DO (mg/L) | Temp (°C) | EC (mS/cm) | DO (mg/L) | Temp (°C) | NaCl (g/L) | EC (mS/cm) | Vol. (L) | Rate (L/min) | |||
| 1 | 
|
15 November 2017 | 0.7 | 0.39 | 11.3 | 12 | 0.39 | 3.5 | 8 | 83.3 | 118.5 | 30 | 2.0 |
| 2 | 
|
28 November 2017 | 3.3 | 0.31 | 12.4 | 5 | 0.40 | 5.0 | 6 | 100.0 | 140.7 | 30 | 2.0 |
| 3 | 
|
17 January 2018a | 3.2 | 0.31 | 12.2 | 4 | 0.44 | 6.5 | 4 | 100 | 146.0 | 30 | 2.0 |
| 4 | 
|
28 February 2018a | 0.3 | 0.60 | 13.3 | 1 | 0.55 | 7.5 | 3 | 92.3 | 133.0 | 130 | 7.2 |
| 5 | 
|
11 April 2018a | 1.7 | 0.35 | 10.7 | 10 | 0.50 | 6.0 | 5 | 100 | 145.0 | 32 | 4.0 |
| 6 | 
|
30 May 2018 | 0.4 | 0.51 | 9.2 | 23 | 0.51 | 4.0 | 11 | 100 | 135.9 | 40 | 4.0 |
| 7 | 
|
10 July 2018 | 0.1 | 0.59 | 11.6 | 16 | 0.57 | <2.0 | 15 | 95 | 132.0 | 105 | 7.0 |
| 8 | 
|
28 August 2018 | 0.2 | 0.65 | 8.5 | 23 | 0.60 | <2.0 | 16 | 100 | 121.0 | 40 | 2.8 |
- Note: ‘Q’ represents mean stream discharge during the tracer-test.EC is the electrical conductivity, DO is the dissolved oxygen.
- a With packer system.
Mean transit-times were derived according to VGW and distance to injection point (τ = x/VGW) for the 16 BTC of well FS-02, eight from shallow (Fs) and eight from deep groundwater (Fd). We hypothesize that τ can be correlated to stream discharge values since the stream reach is predominantly losing and GW heads are directly influenced by stream stage variations. This conceptually implies that GW transit-times are driven by stream stage variations and no stream water infiltrates to the subsurface when Q = 0. Thus, high-frequency GW transit-times (τQ) can be computed from an independent hydrological variable for periods not covered by the tests.
2.4 DO consumption rates
2.5 Simulation of riparian DO concentrations
In order to assess effects of short-term fluctuations of temperature and stream discharge on riparian DO dynamics, which are likely not captured by tracer-tests, we extended the analyses of GW transit-times and DO consumption rates to a high-frequency dataset. We simulated DO concentrations based on Equation (3), assuming stream DO concentrations prior to infiltration (t-τ) as C0 in each time-step with negligible input of other DO source. In a first step, we used results acquired from tracer-tests and the relation between stream stage and transit-time to simulate riparian DO concentrations. We compared results with a range of constant transit-time scenarios based on tracer-tests results, and with transit-times based on EC-cross correlation following the procedure of Vieweg et al. (2016).
2.5.1 Effective temperature between stream and groundwater
2.5.2 Theoretical transit-times
To evaluate our transit-time and discharge relation we also computed the theoretical transit-times (τ*) that would be required to perfectly match observed DO concentrations based on kDO-Teff. τ* were calculated with kDO-Teff while allowing transit-time in Equation (3) to vary boundless in each time-step to match observed DO concentrations. Thus, we can analyse the patterns and values of independently computed τ* and whether differences from empirical τQ were physically plausible changes (i.e., realistic ranges for the field site) not captured by our streamlined model, or if other variables and processes influence the biogeochemical system.
2.6 Damköhler numbers for dissolved oxygen
3 RESULTS
3.1 Hydraulic conditions and high-frequency measurements
Time-series of stream discharge, precipitation, SW and GW temperatures, and DO for the hydrological year of 2018 are presented in Figure 2. Stream discharge was highest between January and March (up to 14 m3/s), whereas from July until December, extremely low baseflow discharges of 0.1 m3/s occurred as a result of the dry summer of 2018. A total of 16 discharge events (most in winter) were identified for the year 2018 (grey shaded areas in Figure 2a). We also observed that most of the discharge events (around 60%) resulted in reduced stream water temperatures (TSW) and consequently under the prevailing losing conditions also in lower GW temperatures (TGW) (up to 4.5°C lower in January) relative to the temperature prior to the event (Figure S2).
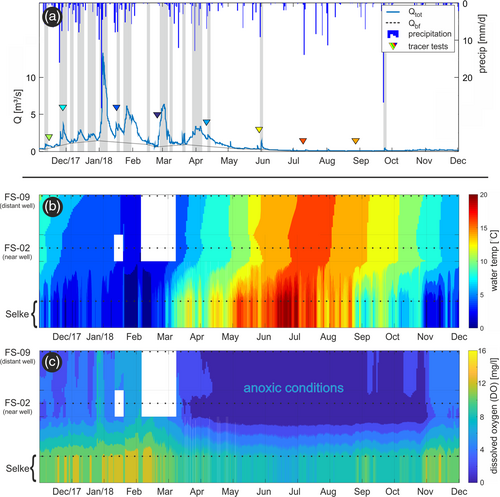
TSW and TGW followed a seasonal pattern as imposed by ambient air temperature, with higher values in summer and lower values during winter. The variation of TGW is increasingly lagging behind variations in TSW with increasing distance from the stream (Figure 2b). Highest and lowest temperatures were slightly different for TSW and TGW, maximum and minimum water temperatures were 23°C and 0°C for TSW (μ = 8.7°C), and 20°C and 2.7°C for TGW (μ = 13.5°C), respectively. TGW and DO concentrations in Figure 2 are vertically averaged values over the entire saturated thickness of the aquifer since temperature differences between shallow and deep GW were generally below 2°C and DO concentrations differences were smaller than 2 mg/L at different depths.
Stream DO remained close to saturation (corrected for temperature) with only minor diurnal fluctuations linked to stream metabolism. In groundwater, DO concentrations exhibited a high spatio-temporal variation, generally decreasing with increasing distance from the stream (Figure 2c). During summer, prolonged periods of anoxia (DO < 2 mg/L) occurred in all observation wells. DO concentrations in the stream and in groundwater increased during discharge events, especially during winter (Figure 2c; Figure S2).
3.2 Groundwater transit-times
3.2.1 GW tracer-test transit-times
Transit-times (τ) were derived based on performed groundwater tracer-tests. The resulting τ from fitting Equation (2) to the 16 EC BTC from Fs and Fd of well FS-02 are presented in Figure 3a in relation to stream discharge at the time of tracer injection.

The range of GW transit-times for Fs was between 0.5 and 0.8 day (μ = 0.7 day), whereas for Fd the range and values were slightly longer, between 0.6 and 1.0 day (μ = 0.8 day). Even though temporal changes of τ were small, GW transit-times were statistically different between the experiments (Kruskal–Wallis-Test, p-value = 0.03), and decreased with increased stream discharge. Based on the results, we observed that GW transit-times were correlated with stream discharge through a power law (τ = aQb, Figure 3a). For Fs, the fitting parameters a and b were 0.64 and −0.12 (R2 = 0.72), and for Fd, 0.73 and −0.06 (R2 = 0.53) respectively. We use this power law relationship for deriving high-frequency transit-times directly from stream discharge. High-frequency GW transit-times based on stream discharge (τQ) are presented for Fs and Fd in Figure 3b. For both locations, τQ increased from winter to summer (lower Q), whereas a decrease in values during discharge events could also be observed, however not to a large extent.
Groundwater velocities (VGW) derived from Equation (2) were on average 8 and 11 m/day for Fs and Fd, respectively, with values up to 16 m/day for Fd under high stream discharges. Peclet numbers computed between 2 and 10 for the Fs, and between 2.5 and 19.5 for the Fd, also increasing with Q, indicated an advection-dominated transport for the range of stream discharges covered by the tests.
3.2.2 EC cross-correlation transit-times (τEC)
The EC time-series between the Fs and Fd were not significantly different and, therefore, EC cross-correlation transit-times (τEC) were only calculated based on Fs EC time-series. The resulting τEC was highly variable in time, but with similar mean values to transit-times from tracer-tests for the same depth (μ = 0.7), Figure 3b. However, despite the pre-processing applied, such as detrending and optimized smoothing of stream EC-values to increase signal correlations (Figure S3), and testing of different cross-correlation window sizes (Vieweg et al., 2016), the resulting τEC were very noisy and mostly unreliable (PCC < 0.75), indicating that transit-times based on EC cross-correlation do not perform well at our site.
3.3 DO consumption rates (kDO)
Computed kDO was higher for Fs, with averages values of 2.9 and 2.0 day−1 for Fs and Fd, respectively. Rates increased with TGW, Figure 4a, and were significantly different among tests (Kruskal–Wallis-Test, p-value < 0.001). The kDO values showed strong negative correlation with stream discharge (Rspear = −0.71, p-value < 0.01), because high Q is typically associated with lower temperatures at our site, which seems true also for short-term discharge events (Figure 3a,b). Coefficients of variation of kDO were 0.51 and 0.65 for Fs and Fd, respectively. The activation energies fitted from tracer-tests according to the Arrhenius equations were 1.03 eV for Fs and 0.93 eV for Fd.

TGW explained 87% of kDO variations for Fs and 91% for Fd, indicating a strong temperature control of the reactions. There was a systematic increase of rates towards the summer, however differences between the shallow and the deep groundwater can be seen, Figure 4b. In the winter, TGW in the deep groundwater was slightly warmer than in the shallow groundwater. Therefore the resulting kDO values were slightly higher in the deep groundwater. In the summer the opposite was observed.
3.4 Controls of riparian DO
In order to further constrain the interplay and major short/long-term controlling factors of riparian DO concentrations, we used different parameterizations of Equation (3) to simulate riparian DO concentrations. As kDO can only be estimated based on observed DO concentrations and given transit-times, uncertainties in transit-time are directly reflected in the value of kDO.
3.4.1 Explicit simulations of DO concentrations
Firstly, we simulated DO concentrations applying the stream discharge tau relationship (τQ) for transit-times and consumption rates based on TGW (kDO-TGW). To assess effects of different transit-times on riparian DO concentrations, simulation results are presented alongside simulations employing τEC (for the shallow groundwater) and with optimized constant transit-times (opt-τ). Optimal constant transit-times were obtained from different simulations using values between the upper and lower limits of transit-times from tracer-tests (in a 0.025 day interval) and taking into account kDO-TGW. Only the best fitting constant transit-time models for each depth are presented.
For Fs the simulations using constant and varying transit-times based on stream discharge captured low-frequency/seasonal fluctuations of DO concentrations well, suggesting that transit-time variations have a minor influence on DO at seasonal timescale, Figure 5a. The opt-τ found for Fs was 0.48 day (below the average τ of 0.7 from tracer-tests), and resulted in a NSE = 0.881 and R2 = 0.946. The model with τQ had a poorer fit in comparison to the former, NSE = 0.633 and R2 = 0.935, however main DO variations were captured equally well. High frequency variations in DO were not captured well by either model.
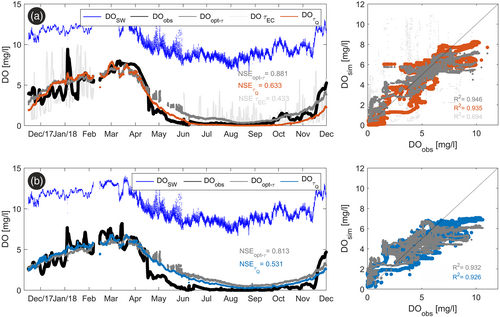
Simulated DO concentrations based on τEC had the poorest fit (NSE = 0.433 and R2 = 0.694). Similarly to EC-transit-times, resulting DO values were very noisy and highly variable. Satisfactory results were only achieved after strongly smoothing τEC, leading to smoothed DO values and a NSE = 0.826 and R2 = 0.909. Since posterior smoothing of τEC is not meaningful, results are discarded from further analyses.
Simulation of DO concentrations for Fd yielded different results than those for Fs. The model with opt-τ = 0.73 day (near average value of 0.8 day from tracer-tests) performed much better than the model using τQ, Figure 5b. The former had NSE = 0.813 and R2 = 0.932, while the latter had NSE = 0.531 and R2 = 0.926, even though main DO dynamics were captured. However, both models systematically overestimated DO concentrations during summer.
3.4.2 DO simulations with effective temperatures
Although model fits of Section 3.4.1 were acceptable, subsurface temperatures in the riparian zone are affected by both the temperature of the freshly infiltrating stream water as well as the local groundwater temperature, Figure 2b. To better represent the true, yet unknown temperature that best represents the temperature dependent consumption rate (kDO-Teff), we computed an effective temperature (Teff) for the different transit-time scenarios of Section 3.4.1. Hence, we can jointly assess the sensitivity of DO concentrations to kDO-Teff and to different transit-times.
Since more degrees of freedom were added to the model, simulations employing kDO-Teff had better model fits in comparison to simulations relying on TGW. By employing kDO-Teff, the scenario with opt-τ was better than the simulation using τQ for Fs (NSE = 0.926 and NSE = 0.897, respectively). However, the opposite was observed for Fd, where the model using τQ had a slightly higher NSE than the model considering opt-τ (NSE = 0.953 and NSE = 0.938, respectively). Comparing to kDO-TGW, the kDO-Teff exhibited earlier summer peak times, Figure 6b,d. There, the resulting kDO-Teff was two to three times higher than kDO-TGW, which can be attributed to a higher Teff caused by infiltrating warmer stream water. If this is not taken into account and kDO is purely based on TGW, consumption rates could be underestimated in summer, whereas they could be overestimated in the winter.
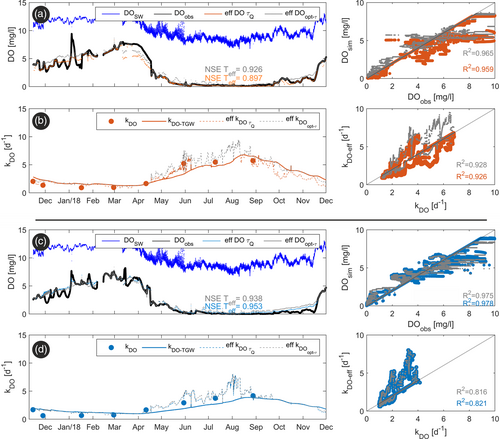
Teff showed a shift from being close or at TGW towards TSW especially in the summer when transit-times were generally longer and TSW > TGW (Figure S4). We noted that Teff reached the warmer temperature boundary in winter when TGW > TSW and on average 47% and 35% of the simulated time for Fs and Fd, respectively, which implies that the simulated DO concentrations were still not perfectly matching observed values. This suggests, for instance, longer transit-times than the previously computed values may be required to match the measured concentrations at those specific times. One way to test whether the residuals between simulated and observed values have the structure of random noise or reflect a systematic error of the models is to analyse their distribution and evaluate the theoretical transit-times needed to match the observed concentrations.
3.4.3 DO residuals and theoretical transit-times
Simulations employing kDO-Teff had good NSE (≥0.9) but did not match all of observed DO variations. DO residuals were approximately normally distributed for both depths, which indicates that there is no substantial systematic error in the models. Thus, we calculated the required theoretical transit-times (τ*) to perfectly match observed DO concentrations based on kDO-Teff (Section 2.5.2) in each time-step. Theoretical transit-times were calculated based on kDO-eff since we consider the rates as the best estimates employing all local knowledge.
Equally to τQ, computed τ*resulted in shorter transit-times under high stream discharge, Figure 7b. For instance, during the high discharge event of January/2018 (Q > 10 m3/s), τ*resulted in 0.2/0.5 day and τQ were 0.47/0.59 day for Fs/Fd respectively. VGW computed on the basis of τ* would be 25 and 11 m/day during this event for Fs and Fd, respectively. These high VGW would still be close to the range of measured velocities based on tracer-tests and thus plausible at the site.
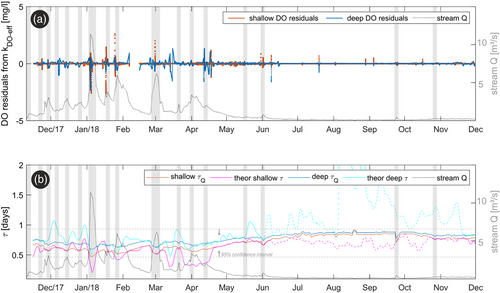
During summer, residuals between observed and simulated DO concentrations were very small in absolute values. But since DO concentrations were equally low and consumption rates were the highest, big changes in τ* are needed to match even small deviations in DO concentrations. Nevertheless, stream discharge was nearly constant at the same period and it is not likely that we can attribute variations of τ* to true variations since changes in transit-time during baseflow conditions are not expected. Thus, theoretical transit-times during baseflow should be considered implausible. Overall, the back-calculation of τ* from best estimates of kDO corroborate the applicability of the relation between stream stage and transit-times.
3.5 Damköhler numbers for DO (DADO)
To assess changes of the reactive regime, we derived Damköhler numbers for Oxygen (DADO) applying computed GW transit-times and DO consumption rates according to Equation (6).
3.5.1 Low-frequency DADO
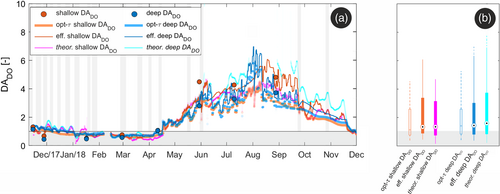
Low-frequency DADO values (shallow DADO and deep DADO) were computed directly from the results of the tracer-tests. They captured main seasonal changes in the system. For both Fs and Fd, the conditions changed from reaction limitation (DADO < 1) during the winter to transport limitation (DADO > 1) in late spring, Figure 8a. For Fs, resulting DADO ranged from 0.5 to 4.5 (μ = 2.2), whereas for Fd DADO ranged between 0.5 and 3.3 (μ = 1.7). From the tracer-tests it was apparent that DADO for shallow groundwater was generally higher than DADO for the deeper system. Even if transit-times were somewhat longer for Fd, consumption rates were slightly lower, resulting in similar DADO.
3.5.2 High-frequency and theoretical DADO
High-frequency DADO were based on kDO-eff to assess short temporal variations of stream water temperature on the reactive regime of the subsurface system. On average, low-frequency and high-frequency mean DADO values look similar, however, a much greater variability can be observed in the high-frequency data, Figure 8b. Especially for Fd, high-frequency DADO can be two to three times higher than low-frequency DADO based on kDO-TGW. Still, general regime patterns are very similar since its main control is the seasonal water temperature variation and the effect of discharge events was minimal.
Independent of whether DADO is computed considering constant or varying/theoretical transit-times, results corroborate that the regime is mainly regulated by temperature variations controlling DO consumption rates since DADO patterns were similar despite the transit-time scenario. Nevertheless, especially during summer constant transit-times DADO were smaller in comparison to DADO computed using varying transit-times, which can have implications when assessing redox sensitive related processes.
4 DISCUSSION
4.1 GW transit-times
Transient groundwater transit-times have often been computed based on signal analysis methods such as deconvolution (Cirpka et al., 2007; Liao et al., 2014) or cross-correlation (Vieweg et al., 2016; Vogt et al., 2010) of natural tracer data. Here, we obtained transient GW transit-times directly from stream discharge values (Q) through a power-law relationship developed from salt tracer-test results. This approach yielded better results, mainly because of the fact that at the site natural EC stream signals were strongly dampened in the observation wells, limiting the use of signal analysis methods for the EC data. Additionally, Nixdorf and Trauth (2018) had argued that for using EC time-series to calculate riparian transit-times, EC variations and their propagation into the subsurface are a necessary but not sufficient condition to constrain travel times. Additionally, it is also required EC variations to be higher relative to stream discharge variations for successful application of EC-based transit-times analysis. At our site relative EC variations are smaller than relative Q variations and the transmission of EC signals to the observation wells may be affected by other processes that we could not account for.
Conceptually, the τQ relationship is based on the dependency of infiltrating stream water transit-time on stream discharge, and the assumption that at Q ≈ 0 no water infiltrates into the subsurface, and therefore, infiltration time goes to infinity. The method is straight-forward and conceptually simple, with the advantage of providing transient riparian transit-times for infiltrating water from a losing stream section directly from an independent and usually continuously measured hydrologic variable, while requiring only small field calibrations on the fitted function from tracer-tests. Computed theoretical transit-times based on kDO-eff allowed us to evaluate that the power-law seemed a good approximation of transit-times. We compared our relation with median transit-times from Munz et al. (2017), who simulated flow and heat transport at a losing reach a few meters downstream from our site. The relationship between their modelled median transit-times and stream discharge could also be well represented by a power-law of the same type (τQ = 0.268Q−4.6, R2 = 0.87). The greater exponent in their study compared to ours seems to indicate that transit-times to their observations wells were more sensitive to stream discharge than at our observation well, in agreement with the greater distance of our well to the stream in comparison to their observation wells.
At our site, GW transit-times decreased with increasing stream discharge as it has also been reported based on modelling of a larger losing stream by Sharma et al. (2012). In their work, simulated VGW around 10 m/day were observed during discharge events, whereas at our site VGW was higher, but in the range of values acquired from tracer-tests. High values could be related to high conductive layers at the site leading to shorter transit-times, or along tree roots in the riparian zone (Tobella et al., 2014). Nevertheless, very short theoretical transit-times and thus very high VGW during or just after flood events (Q > 10 m3/s) are likely related to a shortening of the dominant flowpaths (e.g., by infiltration from the upper soil due to inundation of the riparian zone caused by flooding) rather than really meaningful VGW.
DO simulations using constant transit-times also yielded high NSE values, but we believe this is an oversimplification of the system since we observed differences in transit-times during tracer-tests. Nevertheless, time-invariant transit-time has been used to simulate losing stream systems as demonstrated in Diem et al. (2013) through EC-signal deconvolution.
4.2 DO consumption rates
4.2.1 Temperature dependency of DO consumption rates
Temperature was found to be the main driver of kDO variations in our system, explaining about 90% of its variations. Our kDO-TGW relation was close to the one derived by Vieweg et al. (2016) (Vieweg et al., 2016: k = 0.34 exp[0.2Temp]). Our rather higher intercept values may be explained by the consumption of organic matter that is either stored in the aquifer or imported from other sources than stream water (Diem et al., 2013). This could be related to additional autochthonous DOC mobilized during high flow events (Sawyer et al., 2014; Trauth & Fleckenstein, 2017), or DOC produced within the unsaturated and root zones (Adeleke et al., 2017; Baker & Vervier, 2004). Since respiration sensitivity to temperature can differ in time and space, it is usually described by the activation energy (Ea) from the Arrhenius equation. Ea values of 1.03 and 0.9 eV, respectively, for Fs and Fd were lower than values found by Vieweg et al. (2016) for an instream gravel bar few meters upstream of our site (1.47 eV in average). However, also our values confirm that aerobic respiration at the site is more sensitive to temperature than reported for other sites (in average, 0.62 eV, Yvon-Durocher et al., 2012).
Due to high temporal dynamics of TGW near losing stream sections, a constant ambient groundwater temperature at some distance from the stream is not a good estimate of the effective temperature relevant for DO consumption, which can lead to incorrect estimations of solute turnover due to erroneous temperature-dependent rates (Munz et al., 2017). The kDO-Teff based on Teff was two to three higher than the empirical kDO-TGW in summer (Figure 6), leading to underestimations of DO consumption rates if only TGW is considered. Our results are in line with results from an analysis by Song et al. (2018) on temperature effects of high-frequency flow variations on thermal regimes and biogeochemical processes within hyporheic zones. Using a numerical model, they showed that temperature contribution to DOC consumption was greater within the fluctuation zone, where infiltrating cold water and its long-term storage led to locally reduced reaction rates (0.1C decrease resulted on about 1% decrease in reaction rates).
4.2.2 Hydrologic and temperature controls on DO consumption rates
Our findings elucidate strong effects of temperature on reactions in the biogeochemical system of the near-stream riparian zone, which seem to be more pronounced than the effects of variable groundwater transit-times. In contrast to Sharma et al. (2012), who attributed short temporal changes in reaction patterns mainly to changes in transit-times, we found that discharge events did not significantly alter subsurface transit-times, but instead changed groundwater temperatures in the near-stream aquifer with effects on DO consumption rates. Furthermore our field data suggest that even for short transit-times, water temperature is not constant along a flowpath from the infiltration point at the streambed to the observation well, but instead changes according to stream dynamics and water temperature differences between the stream and ambient groundwater. This is different from Diem et al. (2013) who assumed constant water temperature along stream-groundwater flowpaths for all hydrologic conditions ranging from discharge events to baseflow conditions. In contrast, Vieweg et al. (2016) used Teff for computing temperature dependent DO respiration rates by shifting TSW time-series based on EC-derived transit-times. However, one expects that heat presents different transit-times from other solutes due to different transport mechanisms.
Accounting for temperature effects on reactive turnover in riparian groundwater requires a thorough characterization of temperature patterns. Methods as the use of heat as a tracer and direct temperature measurements in the streambed (Munz et al., 2011; Schmidt et al., 2007) alongside measurements in GW can assist in obtaining an improved understanding of local heat exchange patterns and drivers.
4.3 DADO controls and variations
4.3.1 DADO variations and biogeochemical implications
Computed DADO exhibited small ranges (0.5 ≤ DADO ≤ 6), mainly regulated by temperature fluctuations and the resulting variations of kDO. The DADO values varied within a hydrological year, indicating shifts in the limiting factors of the reactive system (Figure 8). During 61% of the observation period DADO > 1 prevailed. The limitation in DO supply (DADO > 1) can mainly be attributed to high effective temperatures and rapid DO depletion. In the winter, however, DADO was slightly below one for both aquifer depths, the system becomes reaction limited, and although transit-times do not dramatically changed compared to summer low flow conditions, smaller DO mass is consumed and longer periods of oxic conditions tend to prevail.
Zarnetske et al. (2012) showed how a riparian system can be classified as either net-nitrifying (DADO < 1) or net-denitrifying (DADO > 1). In the winter the site shows potential for net-nitrification, whereas in summer favourable conditions for denitrification dominate (DADO ≈ 4). As denitrification is known to occur at the site (Trauth et al., 2018), we can estimate the NO3− fractions remaining after a water parcel has travelled through the riparian zone directly from DADO values taking into account that sufficient DOC is available for the process after DO depletion (see Section 4.2.1). This was done using an S-shaped curve (Figure S5), which approximates the relation between DADO values and NO3− fractional changes according to model results presented by Zarnetske et al. (2012), established in a site with similar conditions to ours. Using this relation to derive denitrification rates from DADO values yields to values between 0.2 and 0.6 mg-N/L/day for DADO of 3–6, respectively, within the range previously assessed by Trauth et al. (2018) using NO3− isotopic data for the site (0.2–1.0 mg-N/L/day, 15%–75% NO3− removal fractions, respectively).
However, depending on how DADO was computed (e.g., constant or varying transit-times), an underestimation of net-potentials might arise. For instance, the NO3− fraction removal potential is only 40% if constant transit-time are considered (DADO ≈ 3) in contrast to 70% under varying transit-times (DADO ≈ 6). Although temperature is the main control of the system, assumptions of constant GW transit-times could lead to a misrepresentation of actual net-potentials. Even larger removal fraction underestimations would occur if DO consumption rates were solely based on TGW instead of Teff (reduction from 70% to 30% of NO3− fraction removal potential). This is not surprising given that other studies observed the importance of temperature and transit-times on NO3− removal potential (Boano et al., 2010; Shuai et al., 2017; Zarnetske et al., 2011), but our findings highlight the dominant control of temperature variations in regulating riparian net-turnover potentials for redox sensitive species compared to effects of changes in transit-times. Nevertheless, it is important to highlight that, even if the bulk conditions indicate aerobic conditions (DO > 2 mg/L), anoxic microsites (DADO < 1) may develop at pore scale within the sediments, and denitrification may occur at substantial rates (Briggs et al., 2015; Song et al., 2018).
4.3.2 Baseflow and discharge events DADO
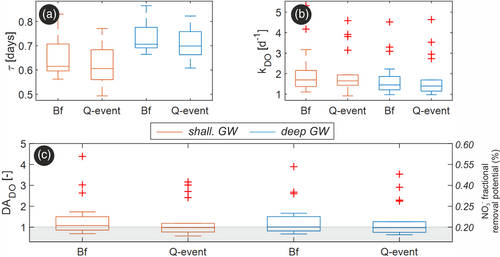
For both Fs and Fd, we observed only small drops of DADO during events in comparison to baseflow, indicating a tendency towards less transport limited conditions, Figure 9. As suggested by Vieweg et al. (2016), extra influx of DO during events might lower DADO. However, two other mechanisms could also be responsible for this decline during events. Firstly, transit-times are somewhat shorter during events, resulting in less time for DO consumption, thus bringing the balance of the system towards less transport limited. Secondly, most of the discharge events (~60%) result in a drop of TSW and TGW contrary to conditions immediately prior to the event, leading to smaller consumption rates, and reinforcing the decrease of DADO. This minor impact of events on the system regime goes alongside findings of Trauth et al. (2018) who argued that discharge events at the site had a subordinate effect for the riparian reactive potential for DO and consequently NO3−. However, their findings were still not fully conclusive in terms of short temporal effects of events, which becomes more apparent from our high-frequency DADO.
Discharge events do not have the potential to completely shift the biogeochemical regime of the system, mainly because of the superimposed seasonal temperature controls and the observed weak effect of discharge events on transit-times. Nevertheless, discharge events especially during summer might carry greater DOC to be stored in the streambed that affect DO consumption rates at a later point and stimulate other biogeochemical processes, such as denitrification. Further high spatio-temporal analyses of DOC concentrations in the streambed and in different points of the aquifer alongside temperature, as well as numerical modelling of reactive transport in the riparian zone can help to better depict associated time-lags and transport/reaction processes influenced by stream dynamics at different time scales.
5 CONCLUSIONS
In this study we combined GW tracer-tests with high-frequency data to assess spatio-temporal variations of GW transit-times (τ) and DO consumption rates (kDO) in a riparian aquifer under different hydrological conditions. To evaluate the effect of different transit-times on kDO, we simulated riparian DO concentrations under different transit-time scenarios based on acquired field data. Results demonstrate that τ and kDO in our near stream GW system are influenced by seasonal and short-term stream stage and temperature fluctuations. Our data showed that transit-times decreased with increased stream stage, whereas kDO was strongly temperature dependent. The variability of kDO was higher than the variability of τ, with coefficients of variation equal to 0.51/0.65 and 0.18/0.14, respectively, for the shallow/deep riparian aquifer.
At our losing stream reach, estimates of τ directly from stream discharge and of kDO from an effective temperature appropriately captured spatio-temporal variations in DO concentrations. We observe that seasonal temperature fluctuations and short-term stream water temperature oscillations conveyed to GW pose stronger controls on the reactive regime of the near stream riparian aquifer and the variability of DO concentrations than transport processes (transit-times). Neglecting temperature influences of infiltrating SW can result in an underestimation of riparian DO consumption rates by a factor of 2–3, which should be considered when assessing reactive turnover processes in the zone of active exchange between SW and GW. Due to a strong temperature control, the DO simulations were equally sound regardless of whether variant or constant transit-times were assumed. Nevertheless, estimated removal potentials of redox sensitive compounds like NO3− based on DADO were significantly different for variant and constant transit-times, 70% and 40%, respectively, highlighting the importance of considering variant transit-times rather than using oversimplified constant values.
Finally, the calculated riparian DADO values indicated distinct seasonal-shifts in the reactive regime of the system (from transport to reaction limited conditions in summer and winter, respectively), that superimpose effects of short-term event fluctuations, which can move the system to slightly less transport limited conditions (shorter transit-times and smaller consumption rates). During short-term events the variations of transit-times caused by discharge fluctuations on DO consumption were smaller than changes in consumption rates caused by changes in water temperature, which were generally lower than before the event. Under climate-change scenarios (e.g., greater/longer discharge events, higher temperatures), these effects might increase, and impact the reactive state of the system (oxic-anoxic conditions) ultimately leading to short-term transitions of the redox-state of the near stream aquifer. Our findings indicate that event-driven changes in SW–GW exchange not only affect riparian oxygen consumption via associated variations in subsurface transit times, but predominantly via induced changes in subsurface temperatures that affect the reaction rates. Also at seasonal time-scales, subsurface temperature is a major controlling factor for biogeochemical reaction rates. Short-term, event-scale as well as seasonal temperature variations are a common feature of most coupled SW–GW systems. Thus, assessments of riparian reactive potentials and solute turnover have to consider not only the hydrological variability, but also the variability of temperature conditions.
ACKNOWLEGDEMENT
Open access funding enabled and organized by Projekt DEAL.
Open Research
DATA AVAILABILITY STATEMENT
The data that support the findings of this study are openly available in HydroShare at https://doi.org/10.4211/hs.51b3933c4987427e94e51e3339237755.


