Hydrological resilience to forest fire in the subarctic Canadian shield
Funding information: Cumulative Impacts Monitoring Program, Grant/Award Number: GNT CIMP180; POLAR Canada, Grant/Award Number: NST-1617-0009 and 1516-107
Abstract
Understanding the role of forest fires on water budgets of subarctic Precambrian Shield catchments is important because of growing evidence that fire activity is increasing. Most research has focused on assessing impacts on individual landscape units, so it is unclear how changes manifest at the catchment scale enough to alter water budgets. The objective of this study was to determine the water budget impact of a forest fire that partially burned a ~450 km2 subarctic Precambrian Shield basin. Water budget components were measured in a pair of catchments: one burnt and another unburnt. Burnt and unburnt areas had comparable net radiation, but thaw was deeper in burned areas. There were deeper snow packs in burns. Differences in streamflow between the catchments were within measurement uncertainty. Enhanced winter streamflow from the burned watershed was evident by icing growth at the streamflow gauge location, which was not observed in the unburned catchment. Wintertime water chemistry was also clearly elevated in dissolved organics, and organic-associated nutrients. Application of a framework to assess hydrological resilience of watersheds to wildfire reveal that watersheds with both high bedrock and open water fractions are more resilient to hydrological change after fire in the subarctic shield, and resilience decreases with increasingly climatically wet conditions. This suggests significant changes in runoff magnitude, timing and water chemistry of many Shield catchments following wildfire depend on pre-fire land cover distribution, the extent of the wildfire and climatic conditions that follow the fire.
1 INTRODUCTION
Fire is a widespread natural occurrence in subarctic forests. As recent trends show increased fire activity and extent (Brown et al., 2015; Gillett, Weaver, Zwiers, & Flannigan, 2004; Kasischke et al., 2010; Kasischke & Turetsky, 2006; Turetsky et al., 2011), understanding forest fire's influence on permafrost thaw and hydrological regime change has become increasingly important. This is because fire can change the land cover and soil properties that control watershed hydrology and biogeochemistry (Buffam, Laudon, Temnerud, Mörth, & Bishop, 2007; Schiff et al., 1998). Fire influences four critical microclimate variables that control hydrological response; snow cover, organic layer thickness, soil moisture and the vegetation canopy by changing soil properties, the energy budget and interception capacity (Burn, 1998). Fire has decreased albedo and net radiation in some northern regions (Liu, Randerson, Lindfors, & Chapin, 2005; Yoshikawa, Bolton, Romanovsky, Fukuda, & Hinzman, 2003), but not in others (Rouse & Kershaw, 1971). Whether measurements are made with climate towers (Liu et al., 2005; Rouse & Kershaw, 1971) or airborne methods (Amiro, MacPherson, & Desjardins, 1999), studies show sensible heat fluxes are enhanced and latent heat fluxes are suppressed following fire. Fire removes the insulation of shallow organic soils, increasing average thermal conductivity and ground heat fluxes. The result is an increase in soil temperatures and thaw depths (Burn, 1998) which may promote talik development (Gibson et al., 2018) and maybe widespread changes in hydrologic regimes (Walvoord & Kuryluk, 2016).
The effect of fire on frozen ground and permafrost, and in turn, hydrology, depends on site conditions, fire severity and frequency, and past and future climate (Zhang, Wolfe, Morse, Olthof, & Fraser, 2015). Under particular landscape conditions the effects of fire on permafrost extent may outweigh those of climate, such that there exists “fire sensitive permafrost” (Zhang et al., 2015). This sensitivity of permafrost to fire is a function of landscape position, dictated by heterogeneity in topography, aspect, microclimate, soil, surficial geology, vegetation and ground ice content (Nossov, Jorgenson, Kielland, & Kanevckiy, 2013; Swanson, 1996). These factors dictate incoming radiation, snowfall and air temperature, which represent secondary influences on frozen ground and runoff response to fire. Among the most important controls on permafrost is surficial organic layer thickness. Where this layer is removed by fire, thermal conductivity of the new ground surface can be substantially higher (Yoshikawa et al., 2003), enabling rapid increases in soil energy storage that can prevent complete freeze back of the ground in winter (Viereck, Werdin-Pfisterer, Adams, & Yoshikawa, 2008), and enable talik formation (Nossov et al., 2013). This effect can be augmented by deeper snowpacks allowed to develop because of reduced interception (Burn, 1998; Nossov et al., 2013; Yoshikawa et al., 2003). Snowpack development may change with a loss of the forest canopy due to changing wind regimes and loss of longwave radiation from the canopy, but there has been no definitive study on how these factors interact. Deeper thaw increases storage capacity for liquid water but an increase in soil moisture content after fire is uncommon (Brown et al., 2015; Nossov et al., 2013). An increase in water storage could explain why the only change attributed to fire in Precambrian Shield streams is increased baseflow (Schindler et al., 1980).
The current trend in larger fire extent and higher fire frequency (Hanes et al., 2018) is expected to continue. Wotton, Flannigan, and Marshall (2017) predict a tendency towards drier conditions will mean an increase of 50% more days in the fire season in Canada's boreal forest between 1985 and 2030. An increase in extent means fires that are more likely to influence entire catchments. In the subarctic, permafrost in discontinuous zones is by definition spatially variable. How this heterogeneity in permafrost extent influences hydrological response to fire will become important to understand as fires become larger.
As forest fire size increases, hydrological resilience to fire of subarctic catchments with discontinuous permafrost may decrease. Resilience, in ecological literature, was originally defined as the ability of a system to maintain function while exposed to a stressor (Holling, 1973). Subsequent literature defined resilience as the ability to resist and/or recover from stress (Grimm & Wissel, 1997). Hodgson, McDonald, and Hosken (2015) contend there are several features of systems that make them resilient, including latitude (the distance to a tipping point, past which the system will move to a predominant function), resistance (how difficult it is to overcome the latitude) and elasticity (the speed at which a system recovers from a stressor and returns to original function). Because of catchment characteristics such as land cover distribution there may be less latitude in the ability of some catchments to maintain function with perturbations and therefore less resilience. Catchments may be less resilient because process and state thresholds (e.g., soil storage capacity) are more easily overcome (i.e., lowered resistance) after disturbance. Finally, after a disturbance such as forest fire, those catchments that experience faster vegetation succession and recovery may also be more resilient because of higher elasticity.
Carey et al. (2010), following Holling (1973), define hydrological resilience as the degree to which a catchment can maintain function following a perturbation. Catchments have different functions—storing and discharging water; for instance (Black, 1997), the most frequent being the predominant function (Spence et al., 2011). It could be assumed that when the water budget is negative the catchment function is to predominantly store water, and when the water budget is positive the catchment function is to predominantly discharge water. The hydrological resilience of a catchment then depends on how much resistance, latitude and elasticity there is in water budget and hydrological function response to forest fire.
Water budget and hydrological function response to forest fire is dictated by how intensely and extensively fire changes the four critical microclimate variables discussed above (i.e., snow cover, organic layer thickness, soil moisture, and the vegetation canopy) (Burn, 1998). The degree to which forest fire will alter function depends on how these four critical microclimate variables differ in the new, burned landscape from that which preceded the fire. The amount of forest cover present before the fire could dictate how much latitude is in the system to buffer the altered response in the snowpack in burned areas. Fire severity and extent control loss of insulating organic matter, increases in active layer depth (Gibson et al., 2018) and soil storage capacities, and in turn, resistance to runoff generation. Precipitation following fire also influences resistance by controlling water supply and storage states relative to runoff generation thresholds. Conceptually, the mechanisms controlling hydrological resilience to forest fire can be categorized into three groups that all influence resistance and latitude—antecedent landscape characteristics, fire conditions and subsequent climate conditions. A fourth factor, time, could also be included as it is related to the elasticity in land cover characteristics after disturbance and how they may influence hydrological states and functions.
Few studies investigate the effect of fire on hydrology at the scale of medium- to large-sized (>100 km2) subarctic and boreal basins (Holloway et al., 2020). Those that have, have been conducted in permafrost free, mountainous or Interior Plain landscapes (Burke, Prepas, & Pinder, 2005). For example, Emmerton et al. (2020) discovered that only during brief rainfall events could a fire-induced change in water chemistry be observed in large basins draining water through burned areas following the 2014 Fort McMurray forest fire, and that there was no shift in monthly and annual metrics of river water quality. There remains a large knowledge gap about how subarctic Precambrian Shield catchments respond hydrologically and biogeochemically to fire (Holloway et al., 2020). Few studies have assessed the resilience of boreal or subarctic catchment water budgets to forest fire, or the spatial variability of this resilience. The objective of this research was to evaluate the effect of fire on the water budget of a subarctic Precambrian Shield catchment north of Great Slave Lake in Canada's Northwest Territories (NWT), develop a conceptual framework for assessing catchment hydrological resiliency to forest fire and apply it across a portion of the region north of Great Slave Lake to future fire. This region is typical of the subarctic Precambrian Shield, which is an important landscape to consider because it represents a vast area of the northern circumpolar region (6.5 × 10⁶ km2) in Canada, Scandinavia and Russia.
2 STUDY AREA
The study domain is a portion of typical Precambrian Shield within the Great Slave Lowland and Great Slave Upland ecoregions (Ecosystem Classification Group, 2008) (Figure 1) bounded by Great Slave Lake to the south, 114°W, 116°W and 63°N. Two terrestrial land cover types dominate this landscape: exposed Precambrian Shield bedrock with sporadic jack pine (Pinus banksiana) (35%) and mixed black spruce (Picea mariana)—deciduous forest (35%). Surface water accounts for 20% of the landscape. The remaining 10% is occupied by peat-filled bedrock depressions and fens surrounding and between lakes (Morse, Wolfe, Kokelj, & Gaanderse, 2016). This area is in the zone of discontinuous permafrost. Large changes in topography, vegetation, winter snow accumulation, local hydrology and surficial geology over short distances result in abrupt transitions from permafrost to non-permafrost conditions. Permafrost is typically found in peat bogs and plateaus where organic material lies over glacio-lacustrine clays. Permafrost is absent from areas of exposed bedrock and well-drained coarse thin overburden (Wolfe, 1998).
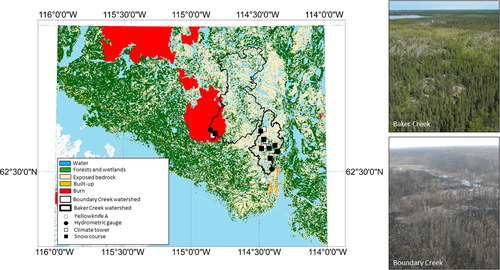
The 1981–2010 climate is characterised using the record from the Meteorological Service of Canada climate station Yellowknife A (Figure 1). Yellowknife has a July daily average temperature of 17°C and a January daily mean temperature of −27°C. Annual unadjusted precipitation averages 281 mm, with 42% falling as snow. Convective cells in July and August produce much of the highly variable summer precipitation. Annual snow cover begins in October and lasts until the end of April or beginning of May. The hydrological regime of the region is described best as subarctic nival (Church, 1974), though there is some evidence that autumn rainfall is becoming more important (Spence, Kokelj, Kokelj, & Hedstrom, 2014) as some years the region exhibits a nival-pluvial regime with dual runoff peaks in late May and October. Winter streamflow in small basins in this landscape often approaches or is zero (Spence et al., 2014). It is not uncommon for this flow to freeze below lake outlets and in stream channels, enabling the continuous buildup of icings.
The 2014 fire year was indicative of the expected pattern towards larger fires in Canada's NWT. In an average year in the NWT, 279 fires consume 5,700 km2 (Walker et al., 2018). In 2014, 385 fires burned a record 33,900 km2 (Walker et al., 2018). The area burned was more than eight times greater than the annual mean, while the number of fires remained within 1 SD of the mean. Overall, the 2014 fires were quite severe with complete combustion of the surface organic layer documented in jack pine stands regardless of plot moisture class, while black spruce forests experienced complete combustion of the surface organic layer across dry and moderately well-drained landscape positions (Walker et al., 2018). Many of the fires occurred immediately north of Great Slave Lake, and 95% were caused by lightning (Kochtubajda et al., 2019).
Two catchments within the study domain were observed to elucidate the effect of fire on the water budget (Figure 1 and Table 1). The 155 km2 catchment draining Baker Creek at Lower Martin Lake (Figure 1) was not subject to any forest fire in 2014 and has not burned since records began in the 1960s. Vegetated patches of open black spruce forest, peatlands and wetlands occupy about half the watershed, with an understory of alder (Alnus alnbetula), Labrador tea (Rhododendron groenlandicum) and moss (Sphagnum spp.). Exposed Precambrian bedrock is also prevalent, sparsely vegetated by jack pine, and extensively covered with lichen (Cladina spp. and Cladonia spp.). Lakes and ponds cover 18% of the catchment. Boundary Creek at Twin Falls is 469 km2 in size but has a very similar land cover distribution (Table 1). It was partially burned in 2014. Ten percent of the basin burned (Figure 1), and 40, 51, 8 and 1% of the burned area was singed, lightly burned, moderately burned and severely burned, respectively. The gauging station at Twin Falls was selected because it was the only suitable gauging site in the Boundary Creek watershed that allowed for burn to be encompassed within the gauged area.
| Land cover | Baker Creek at Lower Martin Lake | Boundary Creek at Twin Falls |
|---|---|---|
| Open water (Fw) | 0.18 | 0.20 |
| Exposed bedrock (Fr) | 0.34 | 0.36 |
| Unburned forest, peatlands and wetlands (Ff) | 0.48 | 0.44 |
| Burn scar (Fb) | 0 | 0.10 |
3 METHODS
3.1 Ground temperatures
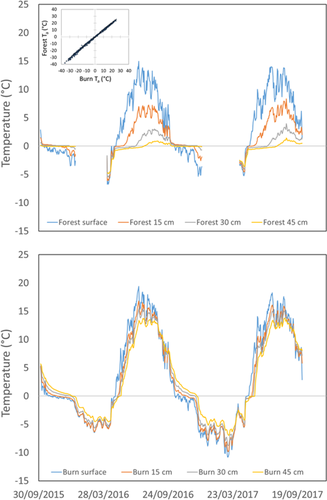
Ground temperature was measured half hourly from October 5, 2015 to January 9, 2016, April 11, 2016 to December 26, 2016 and April 13 to October 2, 2017 at a forested unburned hillslope in the Baker Creek catchment using Stevens Hydraprobes. The gaps in winter were due to a loss of power to the datalogger due to cold temperatures and snow cover on the solar panels used to recharge the batteries. Temperatures were measured in seven profiles at the ground surface and at 15, 30 and 45 cm depth. The soil profile at this site is comprised entirely of organic soils to a depth of ~60 cm, below which are sandy soils of glaciofluvial origin. Reported soil temperature values at each depth are averages of the seven profiles. Ground temperature was also measured half hourly in a fire scar near Boundary Creek at Twin Falls from October 5, 2015 to October 2, 2017 using Campbell Scientific 107B thermistors. One profile was measured at the surface and at 15, 30 and 45 cm depth. The organic soil layer of approximately 15 cm was completely removed by the fire. This was estimated using measurements of the distance of exposed roots from the soil surface (Walker et al., 2018). Soils at this site were silty sand. Thawing degree days were calculated for each site as was an end of season n-factor (Lunardini, 1978): the ratio of air to ground thawing degree-days. This term is used to demonstrate how soil conditions are responsible for ground temperature differences.
3.2 Water budget
where ΔS is change in storage, Pc is rainfall, Mc is snowmelt, ETc is evapotranspiration and Qc is streamflow, all at the catchment scale, c, and in units of mm/day. The four terms on the right of the equation were estimated from observations described below. The change in storage that is reported was solved as the residual of the water budget equation, but was compared with estimates using observations described below.
3.3 Micrometeorology
A series of five climate towers were installed to measure radiation budget components and meteorological conditions for the period October 15, 2015 to October 2, 2017 (Figure 1). These towers were deployed over the four cover types listed in Table 1: open water, exposed bedrock, open black spruce forest and a fire scar, with three towers deployed in the Baker Creek catchment, and an additional tower deployed at the Boundary Creek outlet (Twin Falls). Rainfall, P (mm/day), was measured at each tower, as well as one other location (Duckfish Lake), using Texas Instruments TE525M tipping buckets. As daily differences measured at the stations across the Baker Creek catchment were typically <1 mm, values were averaged to attain Pc. It was assumed that the rainfall captured at Twin Falls was indicative of Pc across the Boundary Creek catchment. The manufacturer of the tipping bucket claims an accuracy of 5%. The accuracy of Pc estimates is difficult to determine across each catchment but measured differences between the tipping buckets during the study period did not exceed 10%.
The climate tower used to collect data to estimate evapotranspiration rates representative of open water conditions was deployed at Landing Lake in the Baker Creek watershed. This 3-m tower was instrumented with an eddy covariance system described in Granger and Hedstrom (2010). This system consisted of a Campbell Scientific CSAT-3 three-dimensional sonic anemometer and Campbell Scientific KH-20 krypton hygrometer. Measurements of wind speed and water vapour content were taken at 10 Hz with a 30-min block averaging period. Corrections to the eddy covariance measurements included coordinate rotation (Kaimal & Finnigan, 1994), the WPL adjustment (Webb, Pearman, & Leuning, 1980), sonic path length, high frequency attenuation and sensor separation (Horst, 1997; Massman, 2000) and oxygen extinction. Complementary meteorological conditions that were observed included incoming short wave radiation, K↓ (W/m2); net radiation, Q* (W/m2) (Kipp and Zonen NR-Lite); air temperature, Ta; vapour pressure, e (Vaisala HMP45C); and wind speed, u (Met-One anemometer). Evapotranspiration from exposed bedrock surfaces was also measured directly with another eddy covariance system, located west of Vital Lake in the Baker Creek watershed. This consisted of a three-dimensional sonic anemometer and a Li-Cor 7500 open-path gas analyser. As with the system deployed over the lake, measurements of wind speed and water vapour content were taken at 10 Hz and fluxes calculated over a half-hour period. The same corrections to the eddy covariance measurements were made to these data as those over the lake. The tower on the exposed bedrock was instrumented with sensors to measure the four radiation components (Kipp and Zonen CNR-1 net radiometer), Ta and e (Vaisala HMP45C), and u (Met-One anemometer). These measurements were also used to calculate other parts of the water budget, including snowmelt, described below.
Evapotranspiration from each land surface type was prorated by its fractional coverage to obtain catchment scale evapotranspiration, ETc (mm/day). Spence and Rouse (2002) reported an accuracy of 20% with methods deployed over subarctic Precambrian Shield similar to those selected for this study.
3.4 Spring snow water equivalent and snowmelt
An end of winter land cover stratified snow survey was conducted as close as possible to the expected maximum winter snowpack depth each spring in 2016 and 2017. The snow water equivalent (SWE) of the snowpack was calculated from snow density measured with an Eastern Snow Conference snow sampler and snow depth measured with a graduated aluminium rod. Each survey included at least 25 depth samples and 6 density samples. Two snow surveys were conducted on lakes, exposed bedrock ridges, forested hillslopes and burned hillslopes. Results from each snow survey were extrapolated to the catchment by pro-rating survey results by land cover fraction (Table 1). The accuracy of such snow surveys is expected to be within 15% (Pomeroy & Gray, 1995).
Daily snowmelt, M (mm/day) from each land cover type listed in Table 1 was estimated using an energy balance method (Dingman, 1982) applied using meteorological, radiation and turbulent flux data described above. Snowmelt calculations began when images from time-lapse cameras deployed at Twin Falls and the Baker Creek forested hillslope showed melt beginning. Initial snow temperatures were estimated as the average of ground surface and air temperatures. Catchment snowmelt, Mc, was calculated by prorating M by the fractional coverage of snow covered area in each land surface type, which was estimated assuming fractional area is proportional to the depth. Heron and Woo (1978) report an accuracy of 25% with this method.
3.5 Streamflow and water chemistry
Streamflow data for Baker Creek at the outlet of Lower Martin Lake were obtained from the Water Survey of Canada hydrometric gauge 07SB013 (https://www.canada.ca/en/environment-climate-change/services/water-overview/quantity/monitoring/survey.html). At Boundary Creek at Twin Falls, immediately prior to break-up in each spring of 2015, 2016 and 2017 a Solinst Levellogger pressure transducer was deployed. This make of pressure transducer is unvented to the atmosphere so a comparable sensor was placed outside the stream to collect data to correct for the influence of barometric pressure. Water level data were logged every half hour. Streamflow was measured at low, medium and high stage above Twin Falls to develop a rating curve (Figure S1). Velocity was measured using a FlowTracker2 hand-held Acoustic Doppler Velocimeter and streamflow calculated with the cross-sectional area-velocity method. A power function fitted to streamflow and stage data exhibited a regression coefficient of 0.99. This curve was not applicable when there was ice in the stream, so when the stage record or pictures from a time-lapse camera suggested this was the case, these data were removed. The record from Baker Creek is uninterrupted during the period of study. Data from Boundary Creek are available from April 24 to October 20, 2016 and April 21 to October 1, 2017.
Samples for water chemistry were collected at the discharge sites. At the Baker Creek site, which is accessible by road, samples were collected weekly for the first month after the onset of flow in the spring, and monthly thereafter until the cessation of flow. At Boundary Creek, samples were collected during each field trip (3–4 trips by helicopter per year). Sampling at Boundary Creek included the normally dry wintertime period, following the discovery of an icing at this site through the winter season (see below). Samples were analysed at the Government of the NWTs' ISO/IEC 17025-accredited Taiga Lab. We present results for conductivity, dissolved organic carbon (DOC), and total dissolved nitrogen (TDN). DOC and TDN were both measured using a Shimadzu Total Organic Carbon Analyser equipped with a TN unit. Analyses followed Standard Method 5310 (DOC) and ASTM D5176-08 (TDN).
3.6 Possibility of widespread icing development
The only documented change in streamflow following fire in Precambrian Shield streams is increased baseflow (Schindler et al., 1980). Sometimes an increase in winter baseflow in this landscape is associated with more widespread icing development (Morse & Wolfe, 2015). Morse and Wolfe (2017) discovered two major conditions that tend to be required for numerous icings to occur in the region north of Great Slave Lake. These are September and October rainfall in excess of 65 mm and more than 25 winter warming spells (change in Ta of >5°C in less than 3 days). Morse and Wolfe (2017) suggest these two conditions are necessary for, but may not necessarily result in numerous icings. Meteorological data from the Twin Falls and Landing Lake towers were used to determine if these conditions were in place during the study period to determine if icings should be expected based on meteorological conditions or could be considered an indicator of a fire effect.
3.7 Assessing hydrological resilience
The methodology from Spence (2007) identifies hydrological function as the relative difference between ΔS and Qc so the sign of ζ denotes the hydrological function. A positive water budget is associated with a discharging function (i.e., ζ > 0) and a negative water budget is associated with a storing function (i.e., ζ < 0). A linear regression between burn fraction and ζ was performed for each watershed to determine the threshold burn fraction (Fb*) necessary to create a positive water budget (i.e., ζ > 0) in 2016. 2016 was a dry year during which water storage would be expected to be the predominant function across the region. The threshold burn fraction cannot exceed Ff (i.e., it is assumed that exposed bedrock and water bodies do not burn). The relationship between Fb* and pre-fire land cover distribution was explored to identify any land cover traits that may control a change in function from storing to discharging with forest fire using 2016 climate conditions. To assess the role of subsequent climate conditions on hydrological resilience, a series of precipitation scenarios were applied to determine how precipitation may further influence water budget and hydrological functioning response to fire. Annual precipitation was increased in 30 mm increments from levels 40% below normal as was experienced in 2016 to the normal of 281 mm, while keeping the regional snowfall to rainfall ratio at 42%. Thirty millimetre increments were selected because it is approximately 10% of the annual precipitation. The sensitivity of Fb* to annual precipitation for each catchment was then determined and mapped.
4 RESULTS
4.1 Spring SWE
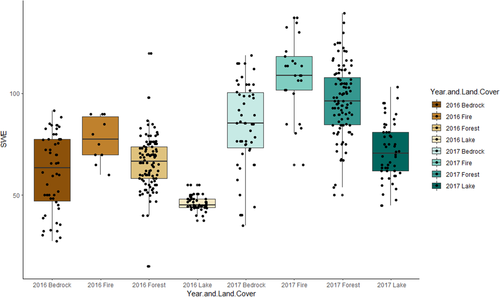
Spring SWE across each catchment was higher in 2017 than in 2016. Catchment scale SWE in the Boundary Creek watershed was an estimated 62 mm in 2016 and 85 mm in 2017. Baker Creek estimates were 60 and 82 mm for 2016 and 2017, respectively. Results imply that SWE in burned areas has median values consistently higher and different than that in any other land cover type (Figure 2). In 2016, an average 70 mm SWE was measured in forested snow courses versus 78 mm at snow courses located in the burn. This is consistent with previous experimental studies that show thinner canopies enhance snow depth (Gibson et al., 2018; Hedstrom & Pomeroy, 1998). The differences were exaggerated in the wetter 2017, with 86 mm at forested snow courses and 109 mm in the burn. These results imply the difference in SWE between burned and unburned forests is greater in years of higher snow accumulation.
4.2 Ground temperatures
The proximity of Twin Falls to the forested hillslope near Vital Lake (20 km) resulted in no appreciable difference in daily air temperatures (Figure 3). However, ground temperatures were markedly different (Figure 3). Average soil column temperatures were comparable in each April. The top ~50 cm of soil in both the forest and fire scar thawed in early May. The fire scar soils heated much faster and rose to 15°C by early to mid-July. In contrast, forest soils temperatures were slower to peak, with warmest forest soils of 6°C in mid-August. Fire scar soils were much slower to freeze in 2016. While average forest soil temperatures were at the zero curtain period by mid-October, fire scar soils did not reach this state for another month. This delay was even more pronounced at the deepest thermistor depth (45 cm) where forest soils froze in early October, but fire scar soils froze in mid-December. Ground thawing degree days from May through September at the forest site and fire scar were approximately 500 and 1,500, respectively, which resulted in summer n-factors of 0.23 and 0.71. This was reflected in active layer depths, which averaged 82 cm at the fire scar and 51 cm at the forested hillslope.
4.3 Radiative and turbulent fluxes
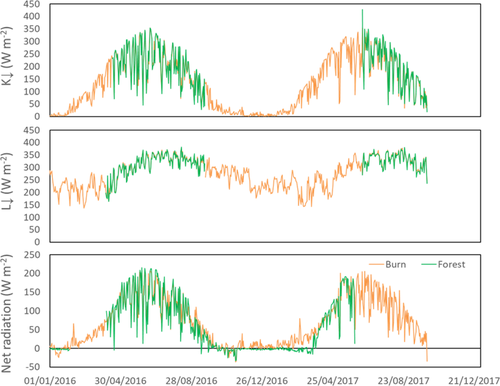
As with air temperature (Figure 3), monthly average incoming short and long wave radiation were always comparable between the fire scar and the exposed bedrock sites (Figure 4). Measured net radiation was lower at the forested hillslope (−0.5 W/m2) than at the fire scar (26 W/m2) in February and March 2017 but it is suspected this was due to snow accumulation on the sensor. Annual net radiation above the forested hillslope and fire scar were so similar (62 and 68 W m−2, respectively) that differences were almost within the 10% level of accuracy of the sensor.
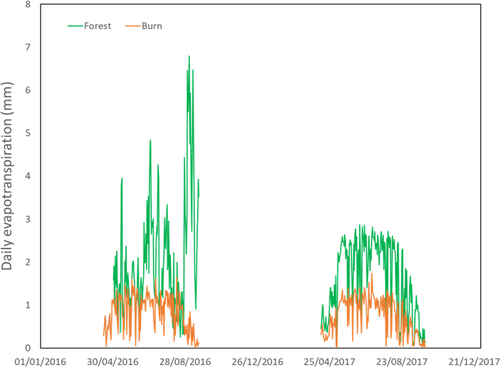
Monthly evapotranspiration rates were typically two to three times higher at the forested hillslope than at the fire scar (e.g., June 2016 53.6 vs. 32.5 mm and July 2017 69.3 and 31.6 mm) (Figure 5 and Table 2). The largest differences were in July 2016 and August 2017. This is notwithstanding September 2016 when evapotranspiration had descended to 0.3 mm/day at the fire scar, but were enhanced by a combination of sunny, windy and dry conditions (Q* = 82 W/m2; 1.2 m/s; 55% relative humidity) at the forested hillslope site for a week at the beginning of the month.
| Average daily (mm/day) | Sum (mm) | |||
|---|---|---|---|---|
| Month | Forest | Fire scar | Forest | Fire scar |
| 2016 | ||||
| April | n/a | 0.6 | n/a | 9.0 |
| May | 1.5 | 0.9 | 45.8 | 28.3 |
| June | 1.8 | 1.1 | 53.6 | 32.5 |
| July | 2.4 | 1.0 | 73.1 | 31.1 |
| August | 1.5 | 0.8 | 46.0 | 25.6 |
| September | 4.0 | 0.3 | 80.5 | 5.5 |
| Season | 2.2 | 0.8 | 299 | 112 |
| 2017 | ||||
| April | 0.8 | 0.4 | 15.6 | 7.5 |
| May | 1.9 | 0.9 | 59.0 | 28.5 |
| June | 2.1 | 1.0 | 62.7 | 30.5 |
| July | 2.2 | 1.0 | 69.3 | 31.6 |
| August | 1.6 | 0.7 | 48.8 | 21.7 |
| September | 0.6 | 0.3 | 18.3 | 7.6 |
| Season | 2.4 | 0.7 | 274 | 127 |
4.4 Water budgets
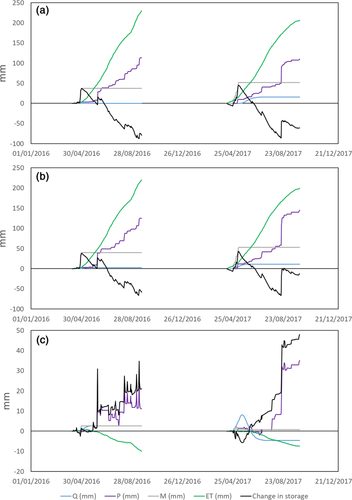
Baker Creek experienced less rainfall in both 2016 and 2017 than that observed in Boundary Creek (Figure 6 and Table 3). The Baker Creek watershed is 20 km closer to Great Slave Lake which often has strong stable atmospheric conditions that suppress convective precipitation (Blanken et al., 2000). These boundary layer conditions have been documented as far away from Great Slave Lake as Landing Lake (Granger & Hedstrom, 2010). Four storms on 7 June (28.3 mm), 11 August (10.7 mm), 14 September (15 mm) and 27 September (13.8 mm) provided half the rainfall in 2016 and one storm (18 August) provided a third of the rainfall (48.5 mm) in 2017 at Twin Falls, so this process may be responsible for the consistent difference between each watershed.
| 2016 | 2017 | |||
|---|---|---|---|---|
| Water budget term | Baker | Boundary | Baker | Boundary |
| Pc | 113.7 | 124.9 | 109.9 | 145 |
| Mc | 39.5 | 40.0 | 54.1 | 55.2 |
| ETc | 243.3 | 222.4 | 217.1 | 199.2 |
| Qc | 3.8 | 2.7 | 5.7 | 11.3 |
| ΔS | −93.8 | −60.2 | −58.9 | −10.2 |
While spring SWE was higher in fire scars than forested hillslopes, this did not compute into substantially larger catchment snowmelt volumes. Estimates were nearly identical in both 2016 and 2017. Similarly, while stand-level evapotranspiration differed by 55% between burned and non-burned sites, when evapotranspiration was pro-rated by land cover fraction to obtain catchment scale estimates the difference was reduced to 8%. The relatively small portion of the Boundary Creek catchment that burned (10%) was not large enough relative to the size of other landscape components, notably exposed bedrock and lakes (Table 1), to alter catchment snowmelt volume or evapotranspiration losses.
Only 3.8 mm of runoff was measured by the Water Survey of Canada at their gauge at Baker Creek at the outlet of Lower Martin Lake between April 10 and September 30, 2016 (Table 3 and Figure 6). This results in a runoff ratio of 0.02. A similar response was observed at Boundary Creek at Twin Falls with 2.7 mm of runoff and a comparable runoff ratio of 0.02. Wetter conditions in 2017 enhanced streamflow to 6 and 12 mm/year and runoff ratios to 0.05 in both watersheds. As with catchment spring SWE, the difference between the two basins is within the expected accuracy of the estimate. No influence of the fire could be detected in warm season streamflow response. Streamflow ceased in both creeks by mid to late summer, but then Boundary Creek started flowing again in winter.
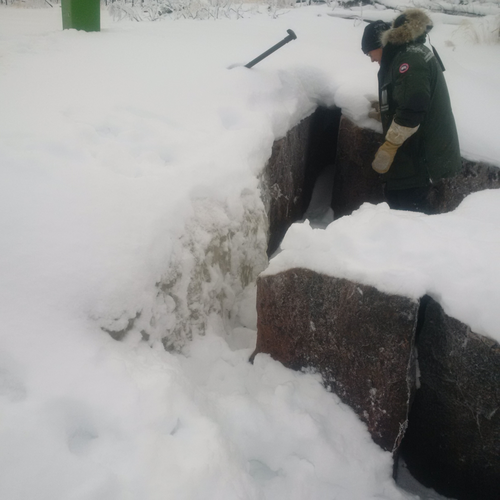
No icings were observed in the Baker Creek watershed during the study period. However, at Twin Falls a sizeable icing developed at the gauging site both winters (Figure 7). It is unknown if this icing occurred regularly prior to the fire. These icings were a surprise because of the absence of icings in the Baker Creek watershed and the cessation of flow at Twin Falls in August of each year. No liquid water was observed during site visits in January, so flow may have ceased early each winter. September–October precipitation in 2016 and 2017 were 57 and 67 mm, and the number of warming intervals (changes in Ta of >5°C in less than 3 days) were 25 and 28. This suggests that conditions previously identified as being required for icings (rainfall >65 mm, warming intervals >25; Morse & Wolfe, 2017) were absent in 2016, but present in 2017. The presence of an icing indicative of winter streamflow in Boundary Creek in both years is a departure from the behaviour in the unburned Baker Creek watershed, and that which would be expected based on the results of Morse and Wolfe (2017).
The effect of fire on the water budget of Boundary Creek relative to the unburned Baker Creek is best reflected in the difference in cumulative change in storage. The resulting differences in cumulative change in storage show that the storage deficit in the Boundary Creek catchment was roughly half that of Baker Creek (Figure 6). High mid-summer rainfall also contributed to a relatively wetter condition at Boundary Creek, especially in 2017. The fact that both catchments were predominantly in storage deficit suggests there was no change in predominant function at Boundary Creek, even if the presence of an icing suggests enhanced winter streamflow was enabled by a deeper frost table.
4.5 Water chemistry
A bi-plot of conductivity and DOC for Baker Creek showed a clear transition from relatively high DOC, low conductivity surface waters immediately after the onset of flow (range of 26 April–12 May during our three study years), to low DOC, high conductivity waters late in the flow season (last sample date ranged from late July to late October) (Figure 8). In Boundary Creek, open-water DOC and conductivity concentrations were similar to those for Baker Creek (Figure 8), although the seasonal transition was less pronounced. In contrast, however, wintertime samples from Boundary Creek had a unique chemical signature, displaying relatively high values of both DOC and conductivity. These patterns were similar for TDN (Figure 8), with Boundary Creek behaving similarly to Baker Creek during the open water period, but displaying substantially elevated concentrations during winter. These results are indicative of a wintertime water source that is organic (DOC and TDN) and mineral-rich (conductivity).

4.6 Assessing resilience
| Land cover fraction | Resilient (i.e., when Fb* > Ff) | Not resilient (i.e., when Fb* < Ff) |
|---|---|---|
| Open water (Fw) | 0.18 | 0.14 |
| Exposed bedrock (Fr) | 0.34 | 0.27 |
| Unburned forest, peatlands and wetlands (Ff) | 0.48 | 0.59 |
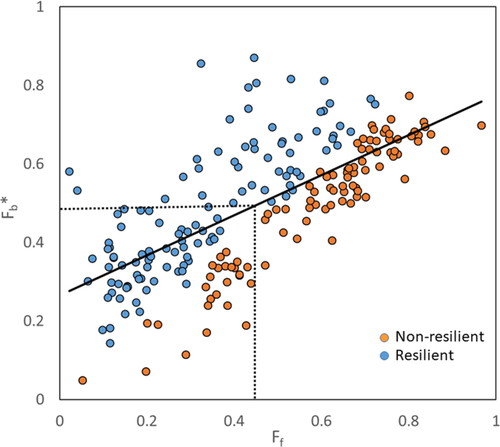
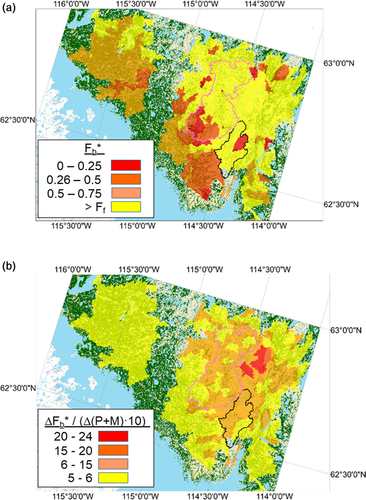
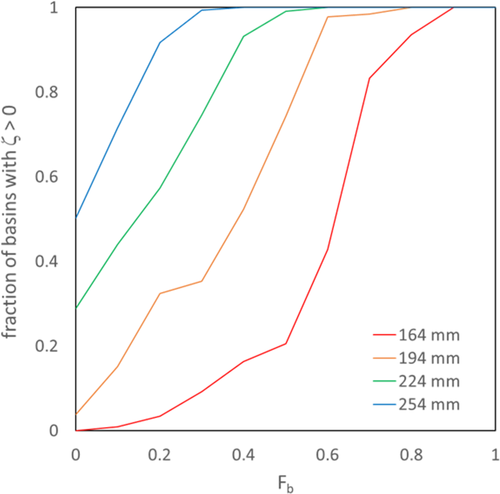
The Ff in Boundary Creek is 0.44 (Table 1), and Equation (6) implies at least 49% of the catchment would have to burn in order to remove the storage deficit that occurred in 2016 (Figure 9). Equation (6) was a much better relationship than one assuming Fb* approached zero with Ff. The 0.27 intercept suggests that in this region a threshold burn fraction of at least a quarter is needed for there to be increases in streamflow, a value aligned well with the results of studies from the contiguous United States (Hallema et al., 2018).
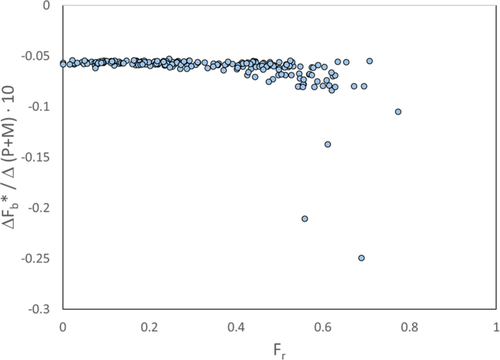
Burned areas have deeper frost table depths, collect more snow and experience lower evapotranspiration rates (Figures 2-4) and in turn are wetter than their unburned counterparts. Higher precipitation enhances wetness and reduces the fraction of the watershed that must burn in order to create excess water available for runoff generation (Figure 11). Fb* decreases approximately 0.05 with each additional 10 mm of precipitation for most watersheds. As the fraction of exposed bedrock increases to 0.8, this rate increases to 0.1 (Figure 12). There are three watersheds with high Fr that experience very high rates of change in Fb* (−0.15 to −0.24 per 10 mm) with higher precipitation (Figure 10). Although these catchments do not have the largest Fr in combination with high Fw, they have the smallest Ff (<0.05) Once Ff falls below 0.05, the ability of the catchment to retain water with increasing precipitation falls precipitously (Figure 12).
5 DISCUSSION
5.1 Effect of fire on water budgets
The effect of fire at the hillslope scale was similar or more pronounced to that observed in other subarctic environments, with notable differences. In contrast to our findings, previous studies found no response in ground temperatures below 15 cm following fire (Yoshikawa et al., 2003). Documenting sites near Whitehorse, Yukon, Burn (1998) found minimal difference in summer n-factors (0.56 vs. 0.55 for unburned and burned sites, respectively), which differs from those documented here (0.23 vs. 0.71, unburned and burned, respectively). Similar to past studies, however, spring SWE was higher following fire, indicative of a decrease in canopy interception capacity (Burn, 1998). Liu et al. (2005) found the primary impact of fire at boreal sites in central Alaska is a decrease in annual net radiation because of increased snow depth during spring and a subsequent lower incoming short wave absorbed at the surface. This was not documented in this instance, as net radiation above the forested and burned hillslopes showed no difference during the spring (Figure 4). Estimated evapotranspiration rates were substantially lower in the fire scar. The difference in evapotranspiration rates between burns and unburned forests was among the highest documented for a subarctic forest. The 55% and 53% difference in annual evapotranspiration documented here exceeds the 33% reported by Liu et al. (2005) in central Alaska. Amiro et al. (1999) surveyed a diversity of sites using airborne methods and found latent heat was suppressed 5–40% in 5-year-old burns.
In other regions, increases in streamflow yield following wildfire have been substantial. Increases in annual yield of 10% and peak flow increases of 45% have been documented for the western United States (Neary, Ryan, & Debano, 2004), while 100- to 2,000-fold increases in peak flow have been observed when intense rainfall followed fire in Arizona (Ffolliott & Neary, 2003). However, the drought that caused the 2014 wildfire continued throughout the 3-year study period, with well below average precipitation through until the end of 2017. It is well documented that when the lakes that dot the subarctic Precambrian Shield landscape have low water levels and high storage capacity, they intercept and retain upstream runoff, and reduce contributing area and water transmitted to higher order streams (Spence et al., 2010). This process was likely responsible for the suppressed streamflow response in both basins in 2016. Each summer both Baker and Boundary Creek watersheds experienced storage deficits. The result was a muted streamflow response in both catchments and no detectable difference in warm season streamflow water, despite the increase in snowpack, and decrease in evapotranspiration.
A change in winter streamflow possibly leading to icing growth following wildfire has not been documented in previous studies. There was enhanced ground thaw as observed following other subarctic forest fires. In coarse-grained upland areas, post-fire thaw may stop permafrost from acting as an aquitard and promote vertical drainage instead of downslope flow (Holloway et al., 2020). The long delay in freeze back (44 days on average in 2015 and 2016) associated with warmer ground temperatures could be responsible for the presence of icing at Twin Falls. The frost table was allowed to penetrate much deeper and longer into the subsurface in burned areas than forests. Nossov et al. (2013) documented a very warm soil after a fire that was unable to refreeze at depth, leaving a talik. This type of process could have removed barriers of frozen ground to subsurface flow long enough for excess water to seep into the Boundary Creek watercourse (Figure 13). Talik formation and continued subsurface flow through the winter is supported by water chemistry results, where wintertime samples are both organic- and mineral-rich (Figure 8). This is consistent with deepening thaw enabling flow to access previously frozen (i.e., permafrost) soils, which can have elevated mineral and organic contents as a result of protection from weathering and decomposition processes, and accumulation of inorganics at the frost boundary. This kind of frozen ground mediated fill-and-spill runoff generation process has been documented after fire in the taiga plains of Canada's NWT (Gibson et al., 2018) and during the summer near Iqaluit, Nunavut, Canada (Chiasson-Poirier, Franssen, Lafrenière, Fortier, & Lamoureux, 2020).

Connon, Quinton, Craig, Hanisch, and Sonnentag (2015) have proposed that climate warming alone can be responsible for this particular manifestation of freeze back in the taiga plains region near Fort Simpson, NWT, Canada. The evidence from the winter streamflow and icing buildup response observed here suggests that forest fire could cause a similar response in the permafrost regime. While in the Connon et al. (2015) case, it has been warming air temperatures that have allowed the ground to warm over time, after this fire it was the increase in thermal conductivity with the loss of the organic layer. Gibson et al. (2018) found that active layer depth near Fort Simpson, NWT, Canada reacted immediately to fire, and stabilised after about 10 years. Stabilisation periods may be a function of winter temperatures and snow depth as observed by Viereck et al. (2008). Lags of up to 5 years in talik extent response have been documented, but taliks stabilise and may start to freeze back after a couple of decades (Gibson et al., 2018; Viereck et al., 2008). This implies impacts of fire on subsurface storage and winter baseflow could become more pronounced than observed here. This highlights how a pulse disturbance such as fire can have profound impacts on frozen ground and subsequently hillslope hydrology and downstream water chemistry in a subarctic landscape (Vonk et al., 2015).
5.2 Resilience
The trend towards larger fires in recent years (Hanes et al., 2018) means fires are more likely to influence entire catchments. It will become more important to understand the proportion and distribution of fire as these patterns will determine watershed response (Ice, Neary, & Adams, 2004). Location is important because land cover can control hydrological resiliency to fire (Figure 9). In this particular landscape, one catchment characteristic that influences resiliency is the Ff. However, this influence is moderated by climate, specifically precipitation.
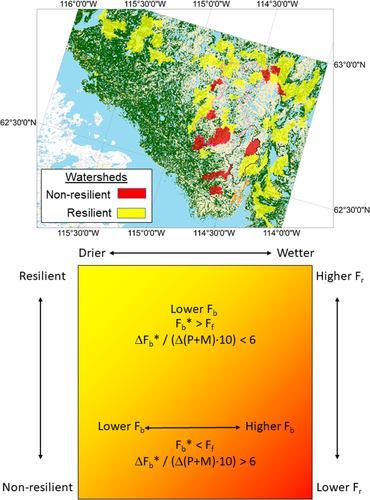
The patterns in Figures 9 and 12 can be merged conceptually into a matrix that demonstrates interaction between landscape and precipitation in controlling hydrological resiliency to fire in a subarctic Precambrian Shield landscape (Figure 14). Higher Fr increase hydrological resilience to forest fire, but results in reduced resilience to increases in precipitation. Exposed bedrock has relatively less vegetation available to burn but it tends to react relatively quickly to precipitation inputs (Allan & Roulet, 1994). Knowledge of the effects of fire on Canadian Shield catchments suggests lake and stream hydrology and chemistry in this landscape are often resilient to natural fire activity (Robinne, Hallema, Bladon, & Buttle, 2020). The enhanced post-fire ground thaw and altered winter stream chemistry results imply that in the subarctic this resilience is a function of antecedent land cover and subsequent climate conditions. If Fb* is larger than Ff, then the watershed can be considered resilient because there does not exist enough forest to burn that would alter predominant hydrological function. A low rate of change in Fb* with precipitation occurs in the lowest quartile of Fb* values found across all 211 watersheds (ΔFb*/(Δ[P + M]•10) < 6). These could be considered the most hydrologically resilient watersheds to increasing annual precipitation. Sixty-six watersheds meet all the criteria in the upper row of the resilience matrix, and these are typically in the east and northern portions of the study domain (Figure 14). Only 11 watersheds are not resilient across the full range of modelled precipitation values. The lower portions of the Boundary Creek above Twin Falls watershed include some of this non-resilient area. This could partly explain the presence of the icing at the bottom of the basin.
Zhang et al. (2015) modelled permafrost distribution change with and without considering fire for a large region in subarctic Canada just northeast of the spatial domain used in this study. Their results provide some fine tuning in regards to effects of fire that were not addressed by the coarse land cover class separation used in this study. Zhang et al. (2015) differentiated between forest and wetland land cover by assuming permafrost response to fire was a function of leaf area index and organic layer thickness. Active layer depth was more impacted where organic layers were thin and LAI was low. In addition to grouping forest and wetland, the current analysis also does not recognise that subsurface climate response to fire evolves over time. If there is a lag in talik expansion following fire as the literature suggests, catchments with smaller fires may experience the same response later than those with larger burns. Regionally, this may mean the estimate of the number of resilient watersheds is too high, as is Fb*, and the curve in Figure 9 may be shifted up over time. Finally, it is not just the frequency distribution of land cover that influences runoff response in this landscape, but topological distribution of land cover (Spence & Woo, 2006). Canadian Shield land cover types have diverse storage capacities. The data reported here implies fire can alter these capacities, and possibly disrupt how runoff is generated and transmitted through catchments. Which hillslopes and sub-catchments experience the most disruption depends on several antecedent land cover traits such as overburden depth, vegetation and perhaps even aspect (Nossov et al., 2013). Climate conditions following the fire are crucial to hydrological and water chemistry response to fire at the catchment scale. If conditions remain dry such as they did during this study, it is unlikely that water chemistry impacts at the hillslope scale will be observed at the catchment outlet, because the catchment remains hydrologically disconnected. When wet conditions return, a water chemistry signal could be detected as burned areas become connected to a more expansive stream network, and solutes associated with the fire are flushed downstream (Emmerton et al., 2020; Petrone, Hinzman, Shibata, Jones, & Boone, 2007). The proximity of heavily disrupted areas relative to the stream network connected to the catchment outlet could be an important factor in the resilience of individual catchments. This dynamic among the topologies of antecedent land cover conditions, forest fire and climate in individual catchments is an aspect of hydrological response to fire that could alter the identification of hydrologically resilient watersheds in the region.
6 CONCLUSIONS
The objective of this research was to evaluate the effect of fire on the water budget of a subarctic Precambrian Shield catchment north of Great Slave Lake in Canada's NWT, develop a conceptual framework for assessing future catchment hydrological resiliency to forest fire and apply it across a portion of the region north of Great Slave Lake. Results indicate that burns exhibited deeper snowpacks and less evapotranspiration than forested stands. Open water season streamflow was not substantially different, but the catchment that experienced fire retained 22 and 49 mm more water over each open water season during the period of study. Soil temperature response to fire was among the most dramatic documented in subarctic regions. An icing formed on Boundary Creek even though conducive meteorological conditions were not in place during the study period, nor did they form in typical places in the control watershed. The exact mechanism for the production of winter streamflow in this instance is unknown, however, wintertime water chemistry suggests a unique source with high organic and dissolved salts, possibly associated with deeper peatland flow paths where there is interaction with underlying mineral soils. A theory that could be further explored with future field campaigns is if forest fire scars on the subarctic Canadian Shield are prone to enhanced subsurface flow because of a loss of ground frost as they are in the taiga plains.
Dramatic changes in stand evapotranspiration and active layer depth did not result in dramatic changes in streamflow at the catchment scale, as a result of a low proportion of catchment burned, and the fact that the fire occurred during, and was followed by, a series of dry years. The results of hypothetical scenarios of increasing burn extent indicate that a threshold fraction needs to burn in order to alter the hydrological function of a subarctic Canadian Shield catchment from storing to discharging. This threshold is a function of the Ff, but the relationship is moderated by precipitation. In Boundary Creek, during “dry year” conditions, this threshold was estimated to be 27% of the basin, but only 10% burned in 2014. Applying a conceptual framework for assessing hydrological resilience to forest fire based upon three major factors—antecedent land cover, burn fraction relative to a threshold, and subsequent climate conditions—across the study domain north of Great Slave Lake identified several watersheds hydrologically resilient to forest fire. These tend to be watersheds with less forest cover, and more exposed bedrock and lakes. It is expected that time elapsed since the burn is also an important factor to consider in assessing hydrological resilience to fire. The period of study of this research did not fully allow for an assessment of how the evolution of ground temperature or vegetation succession may influence the identification of resilient catchments. Lags in ground thermal response are expected, as is a return to wetter climatic conditions, so many catchments in the region may be less resilient than indicated here over longer (i.e., decadal) time scales. Changes in hydrological function, runoff seasonality, and water chemistry will be expected in these watersheds. This work is perhaps the first step in designing a system that could inform forest fire management decisions on the location of non-resilient watersheds. This type of information will become important if forest fire extent continues to increase as predicted.
ACKNOWLEDGEMENTS
This work was supported by funding from POLAR Canada (NST-1617-0009 and 1516-107) and the Cumulative Impacts Monitoring Program (GNT CIMP180). Jenn Baltzer, Wilfrid Laurier University, and Merritt Turetsky, University of Guelph and National Center for Atmospheric Research, provided leadership in promoting the original post-fire workshops that led to the development of the research team. Laura Bourgeau-Chavez and Jeremy Graham of Michigan Technological University kindly provided burn severity data. Ryan Hutchins provided the watershed outline of Boundary Creek. DEMs used to delineate regional watersheds were provided by the Polar Geospatial Center under NSF-OPP awards 1043681, 1559691 and 1542736. The data that support the findings of this study are available from the corresponding author upon reasonable request.
Open Research
DATA AVAILABILITY STATEMENT
The data that support the findings of this study are available from the corresponding author upon reasonable request.


