Short amplicon reverse transcription-polymerase chain reaction detects aberrant splicing in genes with low expression in blood missed by ribonucleic acid sequencing analysis for clinical diagnosis
[Correction added on 26 May 2022, after first online publication: Co-authorship has been assigned to Catherine Mercer in place of Stephanie Greville-Heygate.]
Andrew G. L. Douglas and Diana Baralle should be considered joint senior authors.
Abstract
Use of blood RNA sequencing (RNA-seq) as a splicing analysis tool for clinical interpretation of variants of uncertain significance (VUSs) found via whole-genome and exome sequencing can be difficult for genes that have low expression in the blood due to insufficient read count coverage aligned to specific genes of interest. Here, we present a short amplicon reverse transcription-polymerase chain reaction(RT-PCR) for the detection of genes with low blood expression. Short amplicon RT-PCR, is designed to span three exons where an exon harboring a variant is flanked by one upstream and one downstream exon. We tested short amplicon RT-PCRs for genes that have median transcripts per million (TPM) values less than one according to the genotype-tissue expression database. Median TPM values of genes analyzed in this study are SYN1 = 0.8549, COL1A1 = 0.6275, TCF4 = 0.4009, DSP = .2894, TTN = 0.2851, COL5A2 = 0.1036, TERT = 0.04452, NTRK2 = 0.0344, ABCA4 = 0.00744, PRPH = 0, and WT1 = 0. All these genes show insufficient exon-spanning read coverage in our RNA-seq data to allow splicing analysis. We successfully detected all genes tested except PRPH and WT1. Aberrant splicing was detected in SYN1, TCF4, NTRK2, TTN, and TERT VUSs. Therefore, our results show short amplicon RT-PCR is a useful alternative for the analysis of splicing events in genes with low TPM in blood RNA for clinical diagnostics.
1 INTRODUCTION
RNA splicing analysis is increasingly being used to aid rare disease diagnosis through the detection of splicing variants (Murdock et al., 2021; Rowlands et al., 2020; H. A. Wai et al., 2020). This can be achieved either via targeted reverse transcription-polymerase chain reaction (RT-PCR) when testing the effects of known variants of uncertain significance (VUSs) or increasingly also via transcriptome-wide RNA sequencing (RNA-seq) (H. A. Wai et al., 2020). The limits of sensitivity of transcriptome-wide RNA-seq are yet to be fully defined or standardized but they depend upon tissue-specific gene expression values, levels of transcript degradation, library preparation methods, sequencing parameters, and subsequent bioinformatic processing such as read filtering and alignment.
Transcripts per million (TPM) values can be calculated from RNA-seq data and can be used to provide an estimate of whether sufficient coverage is likely to be achieved for specific genes of interest (Wagner et al., 2012). Publicly available expression datasets such as the TPM values from the genotype-tissue expression (GTEx) project are frequently referred to when trying to determine whether or not splicing can be assayed via whole blood RNA sampling (Lonsdale et al., 2013). However, significant experimental protocol differences between prior published data and ongoing current RNA analyses may lead to errors in predicting the detectability of abnormal splicing if such datasets are relied upon in isolation.
Conventional RT-PCR is known to be useful for the analysis of splicing as an alternative cost-effective technique to RNA-seq (Macken et al., 2021; H. A. Wai et al., 2020). Here, we sought to examine whether genes with low TPM values on RNA-seq can still be assayed for potentially abnormal splicing through the use of RT-PCR. We confirmed that exonic and junction-spanning read coverages are poor in genes with low TPM values. We then used RT-PCR to test VUSs for their effect on splicing in low TPM genes which cannot be readily analyzed using RNA-seq, designing short-amplicon PCR assays to see if they could outperform blood RNA transcriptome analysis for such genes and produce clinically actionable results.
2 MATERIALS AND METHODS
2.1 Patient recruitment procedure and RNA extraction
A total of 13 samples with low TPM genes from patients with VUSs were identified through the Splicing and Disease Research Study at the University of Southampton, UK, ethics approved by the Health Research Authority (IRAS Project ID 49685, REC 11/SC/0269) and by the University of Southampton (ERGO ID23056). Informed consent for splicing studies was provided for all patients from whom samples were obtained. Patient blood samples were collected using PAXgene Blood RNA tubes and intracellular RNA extraction from whole blood was performed with the PAXgene Blood RNA Kit (PreAnalytix). All the patient RNA sample's quality and concentration were checked with bioanalyzer before performing RT-PCR and RNA-seq.
2.2 RNA-seq and data analysis
Whole transcriptome sequencing with ribosomal RNA depletion and stranded library preparation was carried out via Novogene using NovoSeq 600 PE150. A minimum coverage depth of 70M 150 base pair paired-end reads were produced for each sample. Distribution of sequencing quality, error rate distribution, A/T/G/C distribution, the composition of raw data, and data quality summary were mentioned in the supplementary data (Data S1). Data analysis was performed on the IRIDIS 4 high-performance computer cluster, University of Southampton. FASTQ reads were aligned to the reference human genome version 38 (GRCh38) using the STAR alignment tool (2.5.2b version) (Dobin et al., 2013) with reading level filters: reads corresponding to a mapping quality of 255 and maximum mismatch of 6. These filtering parameters were used to match those employed by GTEx. Filtered aligned BAM files were visualized and sashimi plots were generated using the integrative genomics viewer (Ttir et al., 2013).
2.3 RT-PCR and polymerase chain reaction
All the experiments were conducted in the laboratory of Human Development and Health, Southampton General Hospital, University of Southampton. Complementary DNA (cDNA) was synthesized using the High-Capacity cDNA Reverse Transcription Kit (Thermo Fisher Scientific) using random hexamers. Primer pairs (Data S) were designed using the online Primer3web tool (primer3.ut.ee), selecting binding sites in exons adjacent to variants and standard desalted synthetic single-stranded DNA oligo primers were ordered from Integrated DNA Technologies. Polymerase chain reaction (PCR) experiments were performed using the GoTaq G2 Polymerase PCR system (Promega) and GoTaq Hot Start Polymerase (Promega) according to the manufacturer's protocol. PCR cycles were set up at 95°C for 5 min followed by 35 and 40 repetitive cycles of 95°C for 30 s, 60°C or the annealing temperature of individual primer pairs for 30 s and 72°C for 1 min per kilobase pair before ending the cycle with 72°C for 10 min and cooling down at 4°C. RT-PCR products were purified by GeneJET PCR Purification Kit (Thermo Fisher Scientific) and bidirectional Sanger sequencing was carried out by SourceBioscience. Where indicated, amplicons for further analysis were gel-purified by GeneJET Gel Extraction Kit (Thermo Fisher Scientific) and sequenced at SourceBioscience for Sanger sequencing. All the PCR experiments were repeated at least twice for reproducibility and all expected positive amplicons were confirmed by Sanger sequencing.
3 RESULTS
3.1 RNA-seq sensitivity is reduced for low TPM genes
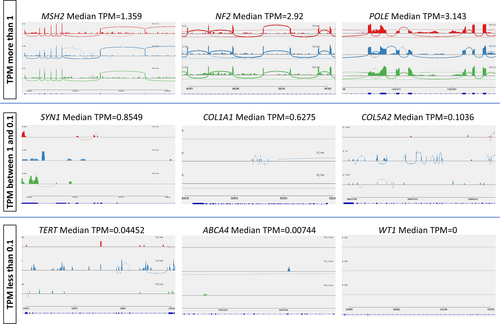
TPM is a normalized RNA abundance measurement of high-throughput RNA sequencing data. The values are calculated using the number of reads aligned to a gene of interest and they come from their respective genes or transcripts for every one million RNA molecules in the RNA-seq sample (Wagner et al., 2012). It is a useful indicator of gene expression level and for predicting the detectability of splicing events using reads spanning exon–exon junctions. Exon-spanning reads are crucial for splicing analysis using RNA-seq and these are abundant in genes where the median TPM value is more than 1 (Figure 1). Aberrant splicing events can also be readily visualized in genes where the TPM value is 1 or more in RNA-seq of blood RNA. However, exonic and exon-spanning reads of genes with median TPM below 1 show lower or no read coverage (Figure 1). Therefore, aberrant splicing events can be missed due to insufficient read coverage where TPM values are lower than 1 and cannot be easily analyzed using the RNA-seq.

3.2 Short amplicon RT-PCR is more sensitive than standard RT-PCR in detecting genes with low TPM in the blood
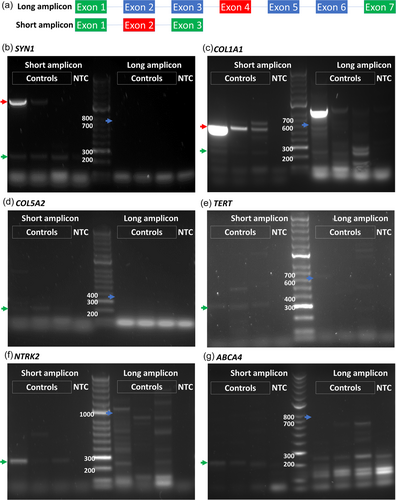
The primers we designed for conventional RT-PCR for the detection of aberrant splicing are located so as to span at least seven exons, where the exon harboring the variant is at the center of the amplicon. In this way, aberrant splicing events such as one or two exon skipping affecting upstream or downstream exons with respect to the variant of interest can be detected by gel electrophoresis. This design of PCR for aberrant splicing detection is sensitive to genes that have high TPM values in the blood (Figure 2a). However, it fails to produce any amplicons for genes that have lower TPM values (less than 1) (Figure 2b–g). On the other hand, a short amplicon RT-PCR design, in which primers span only three exons, is sensitive enough to amplify the targeted cDNA (Figure 2b–g) when performed at 35 cycles using GoTaq G2 DNA polymerase. As only three exons are spanned in short amplicon PCR, only single-exon-skipping aberrant splicing events can be detected and two exon-skipping events may be missed.

Both short and long amplicons were further analyzed using different PCR conditions such as amplification cycles and polymerases. Two different amplification cycles, 35 and 40 cycles, and two different Taq DNA polymerases, GoTaq G2 and GoTaq Hot Start polymerases, were tested for the three genes with low TPM values. Only short amplicons were detected in all different PCR conditions whereas nonspecific amplicons or no amplicons were detected in long amplicon PCR reactions, confirming that short amplicon PCR has higher sensitivity than a long one (Figure S1).
3.3 Short amplicon RT-PCR detects normal and aberrant transcripts of genes with low TPM values
Four different categories of low TPM genes were analyzed using short amplicon RT-PCRs. These categories were based on the GTEx database median TPM values: 1 to 0.1 (COL1A1, COL5A2, DSP, SYN1, TCF4, TTN), 0.1 to 0.01 (NTRK2, TERT), 0.01 to 0.001 (ABCA4), and 0 (PRPH, WT1). Amplicons were successfully detected in genes with median TPM ranges from 1 to 0.001 using short amplicon RT-PCR (Figure 3). Aberrant splicing events were detected in SYN1 c.838-2 A>G (median TMP= 0.8549) (Figure 3a), TCF4 c.550-3C>G (median TPM = 0.4009), NTRK2 c.287+3G>C (median TPM = 0.03444) (Figure 3d), TERT c.3295+5G>T (median TPM = 0.04452), TERT c.5137+3A>G (median TPM = 0.04452) (Figure 3e), TTN c.49346-1G>A (median TPM = 0.2851), and TTN c.63793G>A (median TPM = 0.2851). In comparison, sashimi plots of RNA-seq read coverage data across splice junctions for low TPM gene regions show poor or no exonic or exon-spanning reads covering these areas. The results of all VUSs tested are summarized in Table 1. Amino acid changes caused by aberrant splicing are also shown in Table 1.

| Gene | cDNA | Protein | RefSeq ID | Chr | Coordinates (g38) | Strand | SNV position from splice junction (A = acceptor, D = Donor) | Splicing result | Splice abberration |
|---|---|---|---|---|---|---|---|---|---|
| SYN1 | c.838-2 A>G | p.(=) | NM_006950.3 | X | 47576641 | Reverse | A-2 | Exonic A5SS | r.838_867del, p.(Val280_Gln289del) |
| COL1A1 | c.2644C>T | p.(Arg882Ter) | NM_000088.3 | 17 | 50189702 | Reverse | D-24 | Normal | |
| TCF4 | c.550-3C>G | p.(=) | NM_001083962.2 | 18 | 55279658 | Reverse | A-3 | Exon skipping | r.550_655del, p.(Val184MetfsTer15) |
| DSP | c.5510A>G | p.(Asn1837Ser) | NM_004415.4 | 6 | 7582772 | Forward | A+130 | Normal | |
| TTN | c.49346-1G>A | p.(=) | NM_001267550 | 2 | 178613938 | Reverse | A-1 | Exon skipping | r.49346_49532del, p(Asp16449GlufsTer2) |
| TTN | c.63793G>A | p.(Asp21265Asn) | NM_001267550 | 2 | 178587516 | Reverse | D-1 | Intron retention and exonic A5SS | r.63793_63794ins63793+1_63794-1, p.(Asp21265SerfsTer14); r.63592_63793del, p.(Val21198ThrfsTer9) |
| COL5A2 | c.961-10T>G | p.(=) | NM_000393.5 | 2 | 189079117 | Reverse | A-10 | Normal | |
| TERT | c.3295+5G>T | p.(=) | NM_198253.3 | 5 | 1254363 | Reverse | D+5 | Exon skipping | r.3158_3295del, p.(Gly1053AlafsTer35) |
| TERT | c.3157+3A>G | p.(=) | NM_198253.3 | 5 | 1255284 | Reverse | D+3 | Intronic A3SS and exon skipping | r.3157_3158ins3158-159_3158-1, p.(Gly1053AlafsTer45); r.3033_3157del, p.(Phe1012AspfsTer123) |
| NTRK2 | c.287+3G>C | p.(=) | NM_006180.6 | 9 | 84702236 | Forward | D+3 | Exon skipping | r.213_287del, p.(Ile71_Leu96del) |
| ABCA4 | c.5461-10T>C | p.(=) | NM_000350.3 | 1 | 94011395 | Reverse | A-10 | Normal | |
| PRPH | c.421G>T | p.(Met293Ile) | NM_006262.4 | 12 | 49295621 | Forward | D-125 | No product | |
| WT1 | c.871A>T | p.(Ser291Cys) | NM_024426.6 | 11 | 32427972 | Reverse | D-17 | No product |
- Abbreviations: cDNA, complementary DNA; Chr, chromosome; SNV, single-nucleotide variant; TPM, transcripts per million; VUS, variant of uncertain significance.
4 DISCUSSION
RNA-seq is being integrated into clinical diagnostic services as a tool for the identification of pathogenic sequence variants not identified by standard exome or genome data filtering (Douglas & Baralle, 2021). However, using RNA-seq to detect aberrant splicing patterns in genes not well expressed in the tissue source can be difficult due to low read coverage of exons and splice junctions. In our RNA-seq analysis, blood RNA was used to generate 70 million, 150 bp paired-end reads per sample. However, 70 million read coverage is not enough to generate exonic and junction spanning reads for low TPM genes. A possible solution to overcome low read counts is to increase the total read counts generated by RNA-seq. However, the cost of sequencing increases prohibitively for large-scale testing in a healthcare system. In addition, the generation of more read counts per sample may still not guarantee successful splicing analysis in low TPM genes, due to individual differences in gene expression (Lonsdale et al., 2013). A solution would be to source the relevant cells or tissues that have high gene expression levels of the genes of interest. However, alternative tissue sources are often not feasible or pleasant for the patient, highlighting the importance of a reliable source of RNA for splicing analysis.
Conventional RT-PCR-based splicing analysis has been traditionally used for the assessment of VUSs and their effect on splicing (H. Wai et al., 2019; H. A. Wai et al., 2020). However, even this technique can fail in genes where there is low TPM. In contrast, we found that our redefined short amplicon RT-PCR, spanning only three exons, is sensitive enough to detect low TPM genes, providing crucial clinically useful information. However, one drawback is that, unlike long amplicon PCR, short amplicon RT-PCR may miss multiexon skipping events.
Although aberrant splicing is associated with disease phenotype, the phenotypic severity may depend on the type of aberrant splicing. For example, in-frame aberrant splicing may have milder phenotypic effects than a frameshift or termination codon induced by aberrant splicing, depending on the relevant gene's pathogenetic mechanisms (Lord & Baralle, 2021). However, further studies are needed on a gene-by-gene basis to determine what usage level of alternative splicing is pathogenically significant.
RNA-seq read coverage for low TPM genes becomes sparse (TPM value 1 to 0.01) and completely disappears for genes in which TPM values are lower than 0.01. We found that short amplicon RT-PCR can detect genes beyond this threshold with TPM ranging from 1 to 0.001. Minigene assays are an alternative method for analyzing variants not detected by either RNA-seq or RT-PCR but these are time-consuming to set up and are not easily translated into a high-throughput diagnostic service (Pagani & Baralle, 2009). In contrast, this short RT-PCR method can be applied in a more high-throughput manner for aberrant splicing detection in the majority of genes of interest.
In conclusion, our findings highlight the limits of diagnostic RNA-seq for low TPM genes. Redefined short amplicon RT-PCR is a method that is cheaper, simpler, and quicker. Our findings show that short RT-PCR amplicons compensate for the shortfalls of RNA-seq in assessing splicing in low TPM genes, down to 0.001 TPM but not where TPM is zero, as a useful adjunct to large-scale transcriptomics for genomic diagnostic services.
AUTHOR CONTRIBUTIONS
Htoo A. Wai developed, designed, conducted the experiments, and wrote and revised the manuscript. Matthew Constable, Cosima Drewes, Ian C. Davies, and Eliska Svobodova contributed to the experiments. Esther Dempsey, Tessa Homfray, Anand Saggar, Sahar Mansour, Sofia Douzgou, Kate Barr, Stephanie Greville-Heygate, and David Hunt provided the patient samples. Andrew G. L. Douglas and Diana Baralle supervised the study and edited, and revised the manuscript. Andrew G.L. Douglas is co senior author with Diana Baralle.
ACKNOWLEDGMENTS
This study was supported by the National Institute for Health Research (RP-2016-07-011 research professorship awarded to Diana Baralle). The authors would like to thank all the patients recruited for this study and the CRN Musketeers' Memorandum. The authors acknowledge the IRIDIS 4 High Capacity Performance Computer and the supporting team at the University of Southampton. They would also like to thank the technical teams of Duthie and IDS buildings, University of Southampton, for their support in day-to-day lab work.
CONFLICTS OF INTEREST
The authors declare no conflicts of interest.
Open Research
DATA AVAILABILITY STATEMENT
Variants of uncertain significance information were submitted to the ClinVar database (https://www.ncbi.nlm.nih.gov/clinvar/) with accession numbers from SCV002106369 to SCV002106379.


