Systematic quantification of the anion transport function of pendrin (SLC26A4) and its disease-associated variants
Abstract
Thanks to the advent of rapid DNA sequencing technology and its prevalence, many disease-associated genetic variants are rapidly identified in many genes from patient samples. However, the subsequent effort to experimentally validate and define their pathological roles is extremely slow. Consequently, the pathogenicity of most disease-associated genetic variants is solely speculated in silico, which is no longer deemed compelling. We developed an experimental approach to efficiently quantify the pathogenic effects of disease-associated genetic variants with a focus on SLC26A4, which is essential for normal inner ear function. Alterations of this gene are associated with both syndromic and nonsyndromic hereditary hearing loss with various degrees of severity. We established HEK293T-based stable cell lines that express pendrin missense variants in a doxycycline-dependent manner, and systematically determined their anion transport activities with high accuracy in a 96-well plate format using a high throughput plate reader. Our doxycycline dosage-dependent transport assay objectively distinguishes missense variants that indeed impair the function of pendrin from those that do not (functional variants). We also found that some of these putative missense variants disrupt normal messenger RNA splicing. Our comprehensive experimental approach helps determine the pathogenicity of each pendrin variant, which should guide future efforts to benefit patients.
1 INTRODUCTION
SLC26A4 encodes an anion transporter, pendrin, essential for normal inner ear function (Choi et al., 2011; Everett et al., 2001, 1997; Kim & Wangemann, 2010; X. Li, Sanneman et al., 2013). It is the well-known causative gene for Pendred syndrome (PDS; MIM# 274600), which is the most common type of syndromic hereditary sensorineural hearing loss associated with an enlarged vestibular aqueduct (EVA), a thyroid condition called goiter, and impaired iodide organification. SLC26A4 variants are also often associated with nonsyndromic hereditary sensorineural hearing loss with EVA (DFNB4; MIM# 600791). Hearing loss in PDS and DFNB4 patients is typically congenital, from moderate to profound in severity, and often fluctuating and progressive (Choi et al., 2009; Miyagawa, Nishio, & Usami, 2014; Pryor et al., 2005). This wide phenotypic spectrum suggests an underlying pathology that can be ascribed to partial to complete loss of pendrin's anion transport activity. Therefore, it is crucial to quantify the detrimental effects of genetic alterations found in the pendrin gene to appreciate the pathology underlying various degrees of severity in PDS and DFNB4. This effort is also beneficial for excluding false-positively identified nonpathogenic functional variants from the disease-associated variant list. In this study, we established stable cell lines that express pendrin or its disease-associated exonic single nucleotide variants (putative missense variants) in a doxycycline-dependent manner so that we could reproducibly control the expressions of the pendrin constructs, and developed a plate reader-based anion transport assay that determined the transport activities of multiple pendrin constructs at once with high accuracy. We also examined the potential pathological effects of the putative missense variants on messenger RNA (mRNA) splicing by in vitro splicing assay.
In general, the rate of identifying novel disease-associated genetic variants far exceeds the subsequent time-consuming efforts to experimentally determine their pathogenicity. Consequently, the pathogenicity of many genetic variants has been solely assessed bioinformatically. Analyses of conservation and evolution of the primary sequences aided by machine learning are the basis of computational pathogenicity prediction (Adzhubei et al., 2010; Bendl et al., 2014; M. X. Li, Kwan et al., 2013; Mottaz, David, Veuthey, & Yip, 2010; Sasidharan Nair & Vihinen, 2013). However, due to the known limitation of these computational approaches (Miosge et al., 2015), such in silico predictions are not deemed compelling by the guidelines established by the American College of Medical Genetics and Genomics (ACMG) and the Association for Molecular Pathology (AMP; Richards et al., 2015). The ACMG/AMP guidelines were adapted by the Hearing Loss Variant Curation Expert Panel, and a new ACMG/AMP-based classification rules recently set for genetic variants associated with hearing loss (Oza et al., 2018). These new guidelines are for improving the consistency and accuracy of genetic diagnoses of patients, and underscore the importance of collecting experimental evidence supporting (or questioning) the pathogenicity of numerous “disease-associated” genetic variants. Our experimental approach described herein to systematically characterize a large number of pendrin variants thus fully meets the scope of these new guidelines.
2 MATERIALS AND METHODS
2.1 Subjects
Hearing and other clinical tests were conducted, as described in a previous study (Okamoto et al., 2014). Genetic tests were approved by the Ethics Review Committee of the National Hospital Organization Tokyo Medical Center and conducted only after obtaining written informed consent from each subject.
2.2 Generation of stable cell lines
A cell line that constitutively expresses mVenus (Kremers, Goedhart, van Munster, & Gadella, 2006) harboring p.His148Gln and p.Ile152Leu (Galietta, Haggie, & Verkman, 2001) was established in HEK293T cells using the Sleeping Beauty transposon system (Kowarz, Loscher, & Marschalek, 2015). Briefly, a complementary DNA (cDNA) encoding mVenusp.H148Q/p.I152L was cloned in a pSBbi-Bla vector (60526; addgene), and introduced to HEK293T cells together with pCMV(CAT)T7-SB100 (34879; addgene) using an Effectene transfection reagent (301425; Qiagen). Transfected cells were selected in a Dulbecco's modified Eagle medium (DMEM, 11965; Thermo Fisher Scientific) supplemented with 10% fetal bovine serum (FBS) and 1 µg/ml blasticidin (A11139, Thermo Fisher Scientific). Cell lines that express recombinant human pendrin constructs (both WT and disease-associated missense pendrin variants) in a doxycycline dosage-dependent manner were established in a similar way using a pSBtet-Pur vector (60507; addgene). Transfected cells were selected in a DMEM medium supplemented with 10% FBS and 1 µg/ml puromycin (A11138; Thermo Fisher Scientific). For I−/Cl− antiport assay, the pendrin-expressing pSBtet-Pur vectors were transfected in the HEK293T cell line that constitutively express mVenusp.H148Q/p.I152L (see above).
2.3 HCO3−/Cl− antiport assay
Cells expressing pendrin (or its missense variants) were cultured in a 12-well plate, dissociated with a Cell Dissociation Buffer (13150016; Thermo Fisher Scientific), and loaded with a pH indicator, SNARF-5F (S23923; Thermo Fisher Scientific), in a high Cl− buffer (140 mM NaCl, 4.5 mM KCl, 1 mM MgCl2, 2.5 mM CaCl2, 20 mM HEPES, pH 7.4, 320 mOsmol/L) for 30 min in the presence of 5% CO2 at room temperature. The cells were washed with the high Cl− buffer once, and resuspended in 100 μl of the high Cl− buffer. Portions of the cell suspensions (50 μl) were transferred to wells in a 96-well plate (~1.5x10⁵/well). The HCO3−/Cl− antiport assay was initiated by an automated injection of 200 μl of a low Cl− buffer (125 mM Na-gluconate, 5 mM K-gluconate, 1 mM MgCl2, 1 mM CaCl2, 20 mM HEPES, 25 mM NaHCO3, 5% CO2) in a Synergy Neo2 plate reader equipped with dual top PMTs (BioTek). The fluorescence intensity of SNARF-5F was measured in a time-dependent manner using the optical configuration shown in Figure S1. The information of the excitation/emission filters and the dichroic mirrors used are provided in Figure S1.
2.4 I−/Cl− antiport assay
Cells expressing both pendrin (or its missense variants) and iodide sensitive fluorescent protein, mVenusp.H148Q/p.I152L, were cultured in a 12-well plate, and dissociated with Cell Dissociation Buffer (13150016; Thermo Fisher Scientific) and resuspended in 200 μl of a high Cl− buffer (150 mM NaCl, 1 mM MgCl2, 1 mM CaCl2, 20 mM HEPES, pH 7.5, 320 mOsmol/L) for 30 min at room temperature. Portions of the cell suspensions (160 μl) were transferred to wells in a 96-well plate (~1.5x10⁵/well). The I−/Cl− antiport assay was initiated by an automated injection of 80 μl of a high I− buffer containing 150 mM NaI, 1 mM MgCl2, 1 mM CaCl2, 20 mM HEPES (pH 7.5) in Synergy Neo2. The fluorescence intensities of mVenusp.H148Q/p.I152L and mTq2 were simultaneously measured in a time-dependent manner using the optical configuration shown in Figure S1.
2.5 Confocal fluorescence imaging
Stable cell lines were grown on a cover glass in 24-well plates. After ~24 hr postapplication of 1 µg/ml doxycycline hyclate (D9891; Sigma), the cells were fixed with 4% formaldehyde for 5 min at room temperature, washed in phosphate-buffered saline, and mounted onto slides using Dako fluorescent mounting medium (Dako). Images were captured using the Nikon A1R+ confocal laser microscope system with a Plan Apo 60X oil objective (Nikon) at the Center for Advance Microscopy at Northwestern University. Figures were prepared using NIS-Elements (Nikon) and Photoshop (Adobe).
2.6 In vitro splicing assay
Human genomic DNA was extracted from the hair bud using a Phire Tissue Direct PCR kit (F170-S; Thermo Fisher Scientific). Intronic regions flanking exons 2, 3, 4, 5, 6, 7/8, 9, 10, 11/12, 13, 14, 15, 16, 17, 18, and 19 (+150 bp before and after) were cloned into a pET01 exon-trap vector (MoBiTec, Göttingen, Germany). The DNA sequences of the partial pendrin genes used for the splicing assay were confirmed to be identical to the NCBI reference sequence, NG_008489.1 (see Supporting Information Material). The day before transfection, HEK293T cells were seeded on a six-well plate so that they were 60–70% confluent at the time of transfection. The pET01 constructs were introduced using Effectene (301425; Qiagen), following the manufacturer's directions. After 40–48 hr posttransfection, total RNA was isolated from each well using a Quick-RNA MiniPrep Plus kit (R1057; Zymo Research) and cDNA synthesis was carried out with SuperScript III Reverse Transcriptase (18080044; Thermo Fisher Scientific). Retention or omission of an exon(s) were confirmed by polymerase chain reaction (PCR) using Phusion High-Fidelity DNA polymerase (M0530; NEB) with the DNA primer pairs, 5′-CCTGGCCTGCCCAGGCTTTTGTCAACA-3′ and 5′-CCACCTCCAGTGCCAAGGTCTGAAGGTCA-3′.
2.7 Statistical analyses
Statistical analyses were performed using Prism (GraphPad software). We compared the anion transport rates determined at five different doxycycline dosage conditions to that of noninduced control cells by analysis of variance followed by uncorrected Fisher's Least Significant Difference. Linear regressions were performed to assess the dependency of the transport rates on doxycycline dosage. F tests were performed to find the difference in the doxycycline-dependence between wild-type (WT) versus pendrin missense variants. In all statistical tests, p < .05 was considered statistically significant.
3 RESULTS
3.1 Establishment of stable cell lines
Currently, 571 disease-associated genetic variants are found in SLC26A4, of which 344 were classified as missense variants (as of April 2019; Stenson et al., 2017). In this study, we focused on 51 exonic single nucleotide variants found in the pendrin gene, which are presumed to cause missense changes (Table 1). Among these, the effects of 22 variants (p.Leu117Phe, p.Pro123Ser, p.Met147Val, p.Thr193Ile, p.Val239Asp, p.Asp266Asn, p.Phe354Ser, p.Lys369Glu, p.Ala372Val, p.Asn392Tyr, p.Ser408Phe, p.Arg409His, p.Thr410Met, p.Thr416Pro, p.Leu445Trp, p.Gly497Ser, p.Tyr556Cys, p.C565Tyr, p.Ser657Asn, p.Ser666Phe, p.Thr721Met, and p.His723Arg) on the anion transport function of pendrin have been previously studied (Choi et al., 2009; Dai et al., 2009; de Moraes et al., 2016; Dossena, Bizhanova et al., 2011; Dossena, Nofziger et al., 2011; Gillam, Bartolone, Kopp, & Benvenga, 2005; Ishihara et al., 2010; Jung et al., 2016; Kuwabara et al., 2018; Lee et al., 2014; Muskett et al., 2016; Scott et al., 2000; Taylor, Metcalfe, Watson, Weetman, & Trembath, 2002; Yoon et al., 2008), whereas the remaining 29 await experimental characterization. All these missense variants, except for p.Ser408Phe that was identified in mice in a mutagenesis screen (Dror et al., 2010), were found in human patients (Stenson et al., 2017), of which p.Tyr214Cys, p.Thr410Lys, p.Val483Glu, and p.Leu703Pro are novel pendrin missense variants described for the first time in this report (Tables S1 and S2).
 |
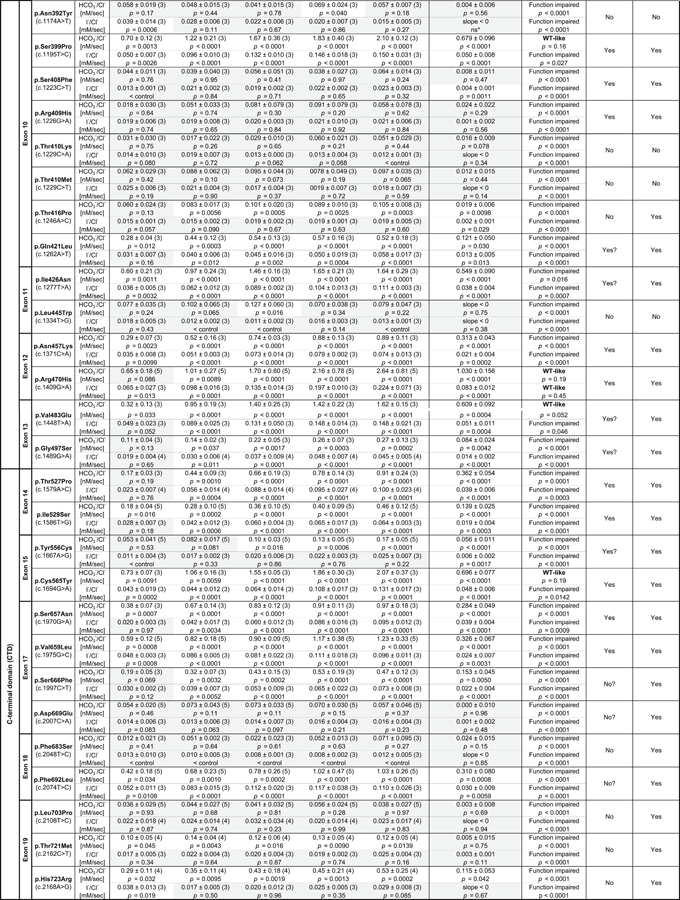 |
- Note: ? indicates a reduced level of confidence. * indicates p < .05 but classified as nonsignificant (ns) because the slope was negative (slope < 0).
The conventional fluorescence microscopy-based anion transport assay (Keller, Homma, & Dallos, 2013; Soleimani et al., 2001) has an advantage in controlling the ionic composition of the extracellular solution easily by perfusion. Also, the assay is not affected by the presence of untransfected cells, as they can be visually identified and excluded before data analysis. However, such an imaging-based assay is typically low throughput, and thus not ideal for characterizing a large number of samples. For this reason, we opted for a high throughput plate reader-based assay that allows measurement of the anion transport activities of multiple pendrin constructs at once. In order for our assay not to be complicated by indistinguishable contribution of untransfected cells, we established doxycycline-inducible stable cell lines for WT pendrin and all 51 pendrin missense variants. These cell lines allow reproducible control of the expressions of the pendrin constructs and measurement of their anion transport activities in a doxycycline dosage-dependent manner, which increases confidence in detecting transport activity (see below). As these cell lines can also be used for other purposes in future studies (e.g., high throughput drug screen), efforts in establishing a cell line for each pendrin variant are worthwhile.
In this study, doxycycline-induced expression of the pendrin constructs was routinely determined by measuring the fluorescence of the mTurquoise2 (mTq2) attached to the C-termini of the pendrin constructs using a plate reader. We also confirmed the expression and subcellular localization of the pendrin constructs by confocal fluorescence microscopy (Figure 1). As anticipated, the WT-pendrin construct was found at the outermost regions of cells, suggesting successful targeting of WT-pendrin to the plasma membrane (Figure 1a). We also found punctated mTq2 fluorescence inside the cells regardless of doxycycline dosage (Figure S2). Similar intracellular puncta were also observed in HEK293T cells heterologously expressing ECFP-tagged prestin (SLC26A5; Takahashi, Cheatham, Zheng, & Homma, 2016). A recent study also found that SLC26A9 is intracellularly retained when heterologously expressed (Walter, Sawicka, & Dutzler, 2019). This study by Walter et al. (2019) demonstrated that two intrinsically disordered regions (IDRs) within the C-terminal domain of the SLC26 protein are responsible for the intracellular retention, and that elimination of these IDRs greatly increased membrane targeting (Walter et al., 2019). It is likely that the C-terminal domains of SLC26 proteins physically interact with intracellular components. These observations suggest that the intracellular retention of SLC26 proteins is not owing to overproduction and resulting saturation of the SLC26 proteins in the cell membrane. In fact, we found unsaturated doxycycline-dependent increase of the transport activity that correlates with overall protein expression (see below, Figure 2e). In any case, as cells expressing only the mTq2 moiety did not show such subcellular localizations (Figure 1b), we considered the manifestation of the subcellular localizations found in WT-pendrin-expressing cells as indications of normal production, maturation, and cell membrane targeting. We confirmed the expression of pendrin missense variants in all 51 of our stable cell lines using mTq2 fluorescence, and qualitatively evaluated whether the pendrin variants exhibited similar expression patterns to WT pendrin (summarized in Table 1). Although highly qualitative, these simple microscopic assessments provide some insights as to the pathogenicity of the missense variants. However, as even small amounts of pendrin variants targeted to the cell membrane may exhibit significant transport activities, we performed functional assays on all 51 variants to quantify how overall transport activity is affected by their presumed amino acid changes regardless of the results of the fluorescence microscopic observation.

Stable cell lines heterologously expressing wild-type (WT)-pendrin-mTq2 (a) and mTq2 (b). Fluorescence of mTq2 was imaged using a confocal microscope. The scale bars indicate 10 µm. Fluorescence images of cells expressing pendrin missense variants are provided in Figure S3. The subcellular localizations of all pendrin constructs were qualitatively assessed and summarized in Table1

HCO3−/Cl− antiport assay. (a) Principle of the HCO3−/Cl− antiport assay. The chemical gradients of HCO3− and Cl− across the cell membrane drive exchange of these anions passively mediated by pendrin (green circle). Influx of HCO3− sucks up intracellular H+ and concomitantly increases intracellular pH, and vice versa. (b) The optical configuration of a Synergy Neo2 plate reader used for the assay. Gray boxes indicate filters and dichroic mirrors (see Figure S1 for details). (c) Response of a ratiometric fluorescence indicator, SNARF-5F, to pH. F1 and F2 are fluorescence intensities of SNARF-5F measured using two different fluorescence band-pass filters (Figure S1). (d) The ratio of F1 and F2 (F2/F1) is plotted against pH. (e, f) Examples of HCO3−/Cl− antiport assay for WT- and p.Arg409His-pendrin-expressing cells, respectively. The broken lines indicate the initial rates (see the main text). The lower panels show summaries of the transport assay. The broken lines indicate the basal transport activity of noninduced cells (negative control). The expressions of the pendrin constructs were determined by measuring mTq2 fluorescence corrected for the density of cells (OD660 nm; blue triangles)
3.2 HCO3−/Cl− antiport assay
In the context of pendrin-associated hereditary hearing loss, the most pathophysiologically relevant anion substrates would be HCO3− and Cl−. Pendrin passively and reversibly exchanges HCO3− with Cl− depending on the chemical gradients of these anions across the cell membrane (Lee et al., 2014; Yoon et al., 2008). As efflux or influx of HCO3− changes intracellular pH (Figure 2a), pendrin-mediated HCO3−/Cl− antiport function can be monitored by measuring the intracellular pH. To this end, we used a ratiometric fluorescent pH indicator, SNARF-5F. The use of this emission ratiometric indicator allows simultaneous detection of its pH-sensitive fluorescence at F1 and F2 (Figures 2b,c and S1), which is the key to make our assay perfectly immune to photobleaching and a slight change of illumination area, if any, between measurements. This experimental configuration also allowed usage of suspended cells to greatly increase the number of cells in each well (~1.5 x 10⁵/well) so that the signal-to-noise ratio is further increased. The assay was initiated by an automated injection of a low Cl−-containing solution. It should be noted that atmospheric CO2 affects HCO3− concentration, and that unequilibrated conversion of HCO3− to CO2 (and vice versa) would compromise the transport assay that relies on intracellular pH measurement because CO2 rapidly permeates the cell membrane and thus affects intracellular pH independently of pendrin activity. To eradicate these complications, we kept the atmospheric CO2 concentration at 5% before and during measurement. The F2/F1 fluorescence ratio of SNARF-5F was converted into H+ concentration using the calibration curve shown in Figure 2d ( The expressions of the pendrin constructs were controlled by the dosage of doxycycline added to the culture medium 1 day before the experiment and quantified by the fluorescence of C-terminally attached mTq2 corrected for the density of cells (OD660 nm).
Examples of our HCO3−/Cl− antiport assays conducted for WT and p.Arg409His are shown in Figure 2e and f, respectively. As expected, WT-pendrin-expressing cells showed doxycycline dosage-dependent transport activities (Figure 2e). As the chemical gradients of anions across the cell membrane (i.e., HCO3−, Cl−) that drives the transport of the very anions changes during measurement and greatly diminishes eventually, it is important to determine the initial transport rates to appropriately quantify loss of transport function; transport activities of fully or partially functional pendrin constructs can be easily underestimated otherwise. We determined the transport rate using the data points collected between 0 and 120 s. We found that the time courses of [H+] in this time window can be sufficiently interpreted by a single exponential function  (0 ≤ t ≤ 120 s, solid lines in Figure 2e upper panel). This expedient exercise allowed objective determination of the initial slope,
  , which is the time derivative of the single exponential function at t = 0 s (shown by broken lines in Figure 2e upper panel and filled circles in Figure 2e lower panel). Unlike WT, the transport activities of pendrinp.R409H-expressing cells were very small and doxycycline dosage-independent (Figures 2f), suggesting complete loss of HCO3−/Cl− antiport function. Summaries of our doxycycline dosage-dependent HCO3−/Cl− antiport assay are provided in Figure 3 . Representative examples of the assay for all 52 pendrin constructs (including WT) along with images of cells expressing these pendrin constructs are provided in Figure S3. The numerical data used to generate Figure 3 are provided in Table 1. Transport activities that were statistically indistinguishable from noninduced cells (p ≥ .05) are highlighted in gray in Table 1. Doxycycline-dependence of HCO3−/Cl− antiport activities, which is the slopes of linear regressions shown in Figure 3 (transport activity vs. log10 of doxycycline dosage), and associated p values are also provided in Table 1. As the steepness of a slope reflects the magnitude of HCO3−/Cl− antiport activity, and as each slope is determined by multiple data points collected at five different doxycycline dosages, we use the slope values as the most reliable metrics of relative HCO3−/Cl− antiport activity. The p values determined by the linear regressions are also useful to statistically determine the presence of HCO3−/Cl− antiport activity. We considered the absence of doxycycline dosage-dependence (p ≥ .05) as objective evidence for complete loss of HCO3−/Cl− antiport activity (highlighted in gray in Table 1). We also ran the F test to compare the doxycycline-dependence between WT versus missense variants (Table 1). We considered p ≥ .05 as WT-like.

A summary of the HCO3−/Cl− antiport assay. The initial transport rates were determined as shown in Figure 2e, f, and plotted against doxycycline concentrations. The error bars indicate the SDs. The solid lines indicate linear regressions (log10 of doxycycline dosage vs. transport rate). The broken lines indicate the transport activity of noninduced cells (negative control). The numerical data used to generate these graphs are provided in Table1
We also determined the HCO3−/Cl− antiport rates under a high extracellular Cl− condition after preincubating cells in a low Cl− condition (low-to-high Cl−, Figure S4). As expected, this “reversed” procedure induced the opposite intracellular pH response (increase of [H+]; Figure S4). Nevertheless, the transport rates determined by the two opposite procedures correlate with each other to a high degree (r = 0.96, Figure S4), suggesting that our effort to determine the relative anion transport rates of pendrin variants is not compromised by the large intracellular pH changes during the assay. We adopted the “high-to-low Cl−” procedure due to the ~10 times lower basal transport activity of noninduced HEK293T cells observed with this procedure (0.037 ± 0.024 nM/s [high-to-low Cl−] vs. 0.34 ± 0.05 nM/s [low-to-high Cl−], Figure S4).
3.3 I−/Cl− antiport assay
Pendrin also exchanges I− with Cl− (Scott, Wang, Kreman, Sheffield, & Karniski, 1999). Pendrin-mediated iodide transport is thought to be important for iodide organification in thyroid cells because pendrin is expressed in the apical membrane of thyrocytes, and because patients with PDS often show a thyroid phenotype. Although this putative role of pendrin in thyroid cells has recently been questioned (Bizhanova & Kopp, 2011; Twyffels et al., 2011), we also determined I−/Cl− antiport activities for all 51 pendrin missense variants.
To monitor the transport of I−, we coexpressed an I−-sensitive mVenusp.H148Q/p.I152L (Figure 4a). The p.H148Q/p.I152L double amino acid changes were reported to greatly increase the affinity of yellow fluorescent protein (YFP) to I− (Galietta et al., 2001). The fluorescence intensities of both mTq2 (F1) and coexpressed mVenusp.H148Q/p.I152L (F2) were simultaneously measured (Figures 4b and S1). The bleed-through fluorescence of mTq2,  , which is detected by the mVenusp.H148Q/p.I152L fluorescence channel and thus results in overestimation of F2, was subtracted offline, and the ratio of the fluorescence intensities of mTq2 and mVenusp.H148Q/p.I152L computed to be
  . The bleed-through correction constant, α, was determined to be 0.29 using cells expressing mTq2 but not mVenusp.H148Q/p.I152L. The I−/Cl− antiport assay was initiated by an automated injection of a high I−/low Cl−-containing solution. Time-dependent reduction of the bleed-through-corrected fluorescence ratio of mTq2 and mVenusp.H148Q/p.I152L was normalized using the very ratio at time zero
  , and converted into intracellular I− concentration, as shown in Figure 4c using the calibration shown in Figure 4d. As in the HCO3−/Cl− antiport assay, we determined the initial rate of I−/Cl− antiport by the expedient single exponential procedure using the data points collected between 0 and 120 s (Figure 4e–g). A summary of the I−/Cl− antiport activities and representative examples of the assay for all the pendrin constructs are provided in Figures 5 and S5, respectively. A numerical summary of the I−/Cl− antiport activities is provided in Table 1. We also determined the doxycycline-dependence of I−/Cl− antiport activities by linear regressions and associated p values, and compared them with WT by F test (Table 1).

I−/Cl− antiport assay. (a) A fluorescence microscopy image of cells expressing wild-type (WT)-pendrin-mTq2 (doxycycline-induced) and mVenusp.H148Q/p.I152L (constitutively expressed). The fluorescence of mVenusp.H148Q/p.I152L is sensitive to I−, and thus can be used as an intracellular I− indicator. (b) The optical configuration of the Synergy Neo2 plate reader used for the assay. See also Figure S1 for detail. (c) Time-dependent change of mVenusp.H148Q/p.I152L fluorescence (after correction, black circles) and intracellular iodide (red triangle). See the main text for detail. (d) Response of mVenusp.H148Q/p.I152L fluorescence to I−. The affinity of mVenusp.H148Q/p.I152L to I− was determined to be 10.6 mM. This constant was used to convert the corrected mVenusp.H148Q/p.I152L fluorescence into intracellular I− concentration. (e, f) I−/Cl− antiport assays for WT- and p.Arg409His-pendrin-expressing cells, respectively. The broken lines indicate the initial rates. (g) Summaries of doxycycline dosage-dependent I−/Cl− antiport assay shown in panels (e) and (f). The broken lines indicate the basal transport activity determined for noninduced cells (negative control)

A summary of I−/Cl− antiport assay. The initial transport rates were determined as shown in Figure 4e, f, and plotted against doxycycline concentrations. The error bars indicate the standard deviations. The solid lines indicate linear regressions (log10 of doxycycline dosage vs. transport rate). The broken lines indicate the transport activity of noninduced cells (negative control). The numerical data used to generate these graphs are provided in Table1
It should be noted that mVenus (and other YFP derivatives) are also sensitive to Cl− and pH (Seward et al., 2013). Accurate determination of intracellular I− concentrations using the calibration shown in Figure 4d assumes that the contribution of Cl− to mVenusp.H148Q/p.I152L fluorescence is negligible ( ) and that there is little or no pH change during the assay. Although the affinity of mVenusp.H148Q/p.I152L to Cl− is very low (KCl = 240 mM) compared with I− (KI = 10.6 mM), it is likely that the fluorescence of mVenusp.H148Q/p.I152L was partly quenched before initiating the I−/Cl− antiport assay because cells were cultured and subsequently preincubated in high Cl−-containing medium/solution. For example, influx of 1 mM I− would be underestimated to be 0.8 mM if the intracellular Cl− concentration were 50 mM. Furthermore, we found that intracellular pH slightly decreases during I−/Cl− antiport assay (Figure S6). This small but non-negligible acidification is probably due to efflux of endogenous HCO3−. This endogenous HCO3− cannot be eliminated before the assay, because the concentration of HCO3−, which is in equilibrium with ~400 ppm atmospheric CO2, is estimated to be ~170 µM in our assay solutions containing 20 mM HEPES-NaOH (pH 7.5) at room temperature (Figure S6). Collectively, the transport rates determined by this assay using mVenusp.H148Q/p.I152L (and a similar assay using YFP) should be regarded as relative activity values reflecting I−/Cl− antiport function that are to be compared with that of WT measured under the same condition.
Incidentally, the homogeneous cytosolic expression mVenusp.H148Q/p.I152L (e.g., Figure 4a) aided us to locate the boundaries of cells, that is, the cell membrane, and thus facilitated our effort to qualitatively assess membrane targeting of the pendrin constructs.
3.4 Effects of putative missense variants on the mRNA splicing
Exonic splicing enhancers (ESEs) and silencers (ESSs) are short nucleotide sequences that play important roles in constitutive and alternative splicing. As suggested by their names, these cis-regulatory elements enhance (ESEs) or silence (ESSs) splicing of precursor mRNAs (Lee & Rio, 2015). The pathogenicity assessment based on our functional study depends on the premise that putative missense variants indeed affect amino acid sequences. However, it may be possible that some of these exonic single nucleotide variants might primarily affect splicing. To explore this possibility, we performed the in vitro splicing assay (Booth et al., 2018). Briefly, mini-gene constructs containing one or two human pendrin exons were created in a pET01 vector for WT and variants and transcribed in HEK293T cells (Supporting Information Material). The transcripts were extracted, reverse-transcribed, and amplified by PCR to see if the exon(s) is retained or skipped (spliced out). Complete omission of an exon(s) results in a 190-bp band, which is indistinguishable from the pET01 vector control. Successful retention of an exon(s) produces a larger band depending on the size of the exon(s).
To ensure the ability of this in vitro assay to discern pathophysiologically relevant mis-splicing for the pendrin gene, we generated a construct containing exons 7 and 8 with c.919-2A>G. This intronic pendrin variant, which was first described as 1143-2A>G (Coucke et al., 1999), is frequently found in Asian patients with PDS and experimentally demonstrated to cause skipping of exon 8 (J. J. Yang et al., 2005). The omission of exon 8 by c.919-2A>G was also recapitulated in a mouse model that shows a pendrin null-like severe hearing phenotype (Lu et al., 2011). Consistent with these previous observations, we found that our mini-gene construct containing c.919-2A>G produced a shorter band that can be explained by the loss of exon 8 (83 bp). We also found a faint band at ~190 bp, suggesting an additional minor effect of c.919-2A>G to skip both exon 7 (153 bp) and 8 (Figure 6). We also performed the mini-gene assay for two additional previously reported intronic pendrin variants, c.601-1G>A and c.1707+5G>A, which are predicted to affect the splice acceptor site of intron 5 (exon 6) and the splice donor site of intron 15 (exon 15), respectively (Park et al., 2005; Tsukamoto et al., 2003). The construct containing c.601-1G>A produced a slightly shorter band compared to the WT control, implying mis-splicing that results in a partial loss of exon 5 (Figure 6). In fact, we confirmed that the PCR product lacked the first 21 bases of exon 6 that is presumed to encode a portion of a membrane-crossing α helix. The mini-gene construct harboring c.1707+5G>A produced a ~190-bp band (Figure 6), suggesting a complete loss of exon 15 that encodes a significant portion (31 aa) of the highly conserved Sulphate Transporter and Anti-Sigma factor antagonist (STAS) domain present in the C-terminal domain of pendrin. These observations strongly suggest that both c.601-1G>A and c.1707+5G>A are indeed pathogenic, and reaffirm the ability of the mini-gene assay to successfully detect splicing defects for the pendrin gene.

In vitro splicing assay. Mini-gene constructs containing one or two human pendrin exons with flanking introns (150 bp) were transcribed in HEK293T cells. The transcripts were reverse-transcribed and amplified by polymerase chain reaction. Omission (skipping) of an exon(s) results in 190-bp band as the pET01 vector control does. Successful retention of an exon(s) produces a larger band depending on the size of the exon(s). Pendrin variants that produced clearly detectable mis-spliced band(s) are enclosed by gray squares. The DNA sequences of the mini-gene constructs are provided in Supporting Information Material
We repeated this mini-gene assays for selected pendrin missense variants (Figure 6). Of 33 (out of 51) missense variants tested, p.Gly131Val (c.392G>T) and p.Gly334Val (c.1001G>T) showed signs of mis-splicing. The clearly detectable ~190-bp band produced by c.392G>T suggests the omission of exon 4. Although a correctly spliced band was also detected, our transport assays demonstrated that pendrinp.G131V is barely functional (Table 1); that is, the high likelihood of p.Gly131Val (c.392G>T) to be pathogenic would not be overturned regardless of the knowledge whether c.392G>T compromises mRNA splicing or not. For this reason, most missense variants that almost completely abrogate the transport function of pendrin in our transport assays using pendrin constructs, which were expressed from cDNAs (Table 1), were dismissed from the assay. The codon that encodes Gly334 is separately located on exons 8 (3′-end) and 9 (5′-end). We found that c.1001G>T predominantly produced a band larger than WT, implying aberrant inclusion of a partial intronic sequence present between the two exons. Sequencing of this large PCR product confirmed inclusion of 40 bases of the intronic region flanking the 3′-end of exon 8. As inclusion of this partial intronic sequence introduces an in-frame stop codon (TGA) right after exon 8, this mis-splicing should not produce a functional pendrin protein even if it is translated. Importantly, c.1001G>T also produces a correctly spliced band (confirmed by sequencing), suggesting that the pendrin gene harboring p.Gly334Val (c.1001G>T) can still produce a functional pendrin protein (Table 1) but its production may be significantly reduced compared with WT in vivo. The mini-gene construct containing exon 18 with p.Phe692Leu (c.2074T>C) also produced a PCR product larger than expected (245 bp). However, the WT control of exon 18 also showed the same large PCR product (Figure 6). It is likely that intron 18 contains a cryptic exon, as there is a polypyrimidine tract followed by a potential splicing acceptor sequence (AGAT; Supporting Information Material). It is conceivable that this cryptic exon was not spliced out due to elimination of an intronic regulatory element in our construct design that keeps only 150-bp intronic regions flanking the exon. In any case, as the result of the assay for c.2074T>C was WT-like, it is unlikely that c.2074T>C disrupts normal mRNA splicing.
The mis-splicing demonstrated for p.Gly131Val (c.392G>T) and p.Gly334Val (c.1001G>T) underscores the importance of experimentally determining the effects of exonic single nucleotide variants (putative missense variants) on mRNA splicing especially for those that only partly or barely affect the anion transport function of a recombinantly produced pendrin protein.
4 DISCUSSION
The large phenotypic spectrum of PDS and DFNB4 implies the presence of pathogenic variants that partially impair the function of pendrin to various degrees. Thus, quantification of the effects of genetic alterations of pendrin on its anion transport function would be crucial for appreciating the pathology of pendrin-associated hearing loss. By measuring HCO3−/Cl− and I−/Cl− antiport activities of pendrin missense variants in a doxycycline-dependent manner, we rigorously determined their relative transport abilities with respect to WT. The slope values provided in Table 1, which were determined from our doxycycline-dependent transport assays (Figures 3 and 5 ), can be plotted in a two-dimensional (2D) plane (Figure 7 ) so that the relationship between HCO3−/Cl− antiport activity versus I−/Cl− antiport activity is visually inspected. The strong positive correlation found between the two measures (r = 0.97, Figure 7 ) suggest that pendrin uses the same molecular mechanism for the HCO3−/Cl− and I−/Cl− antiport. This 2D representation is also useful for visually appreciating the relative magnitudes of HCO3−/Cl− and I−/Cl− antiport activities. The p values (calculated by F test) provided in Table 1 statistically distinguish missense variants that significantly impair the anion transport function of pendrin (p < .05) from those that do not (WT-like, p ≥ .05). It is, of course, important to exclude and separately evaluate the pathogenicity of missense variants that barely or only partially impair the transport function when recombinantly expressed from cDNAs but impair mRNA splicing (e.g., p.Gly334Val).

A two-dimensional representation of HCO3−/Cl− and I−/Cl− antiport activities (the slope values provided in Table 1) determined in this study for wild type (WT; indicated by blue diamond) and 51 pendrin missense variants. The error bars indicate the standard errors associated with linear regressions. F tests were performed to objectively assess the pathological effects of the pendrin variants (see the main text for detail). Note that p.Gly334Val (c.1001G>T) was found to disrupt messenger RNA splicing (Figure 6)
Pendrin and other vertebrate SLC26 proteins form tetramers (Hallworth, Stark, Zholudeva, Currall, & Nichols, 2013). However, the physiological importance of this multimerization is unknown. Each SLC26 protein subunit (single polypeptide) is presumed to have its own ion translocating pathway (Geertsma et al., 2015). It is likely that each subunit is independently functional because it is known that the function of WT-prestin (SLC26A5) does not change upon multimerization with virtually nonfunctional prestinp.V499G/p.Y501H (Homma, Duan, Zheng, Cheatham, & Dallos, 2013). The autosomal recessive inheritance pattern of all disease-associated genetic variants identified so far in the pendrin gene points to nonexistence of the dominant negative effect and thus further supports functional independence of a pendrin subunit. Therefore, we propose to use our transport activity data additively to estimate the overall pendrin activity for both monoallelic and biallelic pendrin variants. Given that one copy of WT-pendrin gene is sufficient for supporting normal inner ear function, it seems unlikely that pendrin variants with WT-like transport activities (e.g., p.Ser49Arg, p.Leu117Phe, p.Val163Ile, p.Asp266Asn, p.Thr307Ala, p.Asn324Tyr, p.Phe354Ser, p.Arg470His) are pathogenic. We speculate that these are nonpathogenic functional variants that cosegregate with a truly pathogenic genetic alteration such as those reported in previous studies (Ben Said et al., 2012; Chattaraj et al., 2017; Pique et al., 2014; Yang et al., 2009, 2007). This possibility also needs to be entertained for biallelic pendrin variants that only partly impair the overall pendrin-mediated transport activity, especially when the sums of the transport activities of the two pendrin variants are comparable to or exceeds that of WT. Exclusion of false-positively identified functional variants from the disease-associated variant list is very important to avoid unnecessary future clinical efforts to genetically treat patients with PDS/DFNB4.
Mouse models that do not express a pendrin protein (Everett et al., 2001; Lu et al., 2011) manifest severe inner ear phenotypes. Another pendrin mouse model expressing pendrinp.S408F (Dror et al., 2014, 2010) also shows severe inner ear phenotypes, which is consistent with our observation that p.Ser408Phe almost completely abrogates the anion transport activity of pendrin (Table 1). Studies using these mouse models unequivocally demonstrated the essentiality of pendrin-mediated anion transport function for normal inner ear function. However, to understand the pathology underlying the large phenotypic spectrum of PDS and DFNB4, it is also important to know how much pendrin-mediated transport activity is minimally required for normal inner ear function. Mouse models allow pathological examination of a monogenic pendrin variant in a clearly defined genetic background. However, it is conceivable that the tolerance of mice to a reduction of pendrin function may be greatly different from that of humans, because mice expressing pendrinp.H723R, whose HCO3−/Cl− antiport activity is only ~13% of WT (Table 1), do not show any inner ear phenotype even in a compound heterozygote having only one copy of pendrinp.H723R allele (pendrinp.H723R/−; Lu et al., 2014). This surprisingly high tolerance of mice to a huge reduction of pendrin activity may be ascribed to the smaller inner ear volume compared with humans. In any case, the mouse models may not be appropriate for assessing the severity of human pendrin missense variants. Thus, it is important to elaborate efforts in identifying human genetic alterations that are casually associated with PDS and DFNB4. Due to the potentially polygenic nature of these disease phenotypes, it is also important to consider the possibility that a particular pendrin allele only partly contribute to manifestation of a certain disease phenotype. Therefore, rigorous quantification of the functional effects of genetic alterations of the pendrin gene demonstrated in this study is crucial to assess its relative pathological contribution when combined with another one.
It would not be so important to distinguish pendrin variants with very small transport activity from those with no transport activity for the purpose of assessing the pathogenicity of a variant. However, the ability to discern this subtle difference would be crucial for prioritizing future efforts to efficiently identify potentially rescuable pathogenic variants and finding pharmacological solutions against them. The p values determined from linear regressions objectively determine the presence of the anion transport activity (p < .05) regardless of its magnitude, and are thus useful for detecting small but statistically non-negligible antiport activity. For example, pendrinp.P123S exhibits statistically significant HCO3−/Cl− antiport activities only at two doxycycline conditions (3 and 10 µg/ml; Table 1), but it shows a positive doxycycline-dependence (p = .039). These results suggest the p.Pro123Ser missense variant to be probably pathogenic, but the presence of the small HCO3−/Cl− antiport activity implies that this pendrin variant may be rescuable. In fact, a previous study demonstrated that pendrinp.P123S is pharmacologically rescuable at least partially (Ishihara et al., 2010).
If a missense variant is causally associated with a disease, it must somehow impair the function of a protein. In other words, a pathogenic variant would tell us which residue is critical for the function of a protein. Therefore, functional characterization of disease-associated missense changes also provides significant insights into the molecular mechanism of a protein. Although the tertiary structure of pendrin has not been defined, the recently solved structure of a mammalian SLC26A9 (PDB: 6RTF; Walter et al., 2019) allows generation of a structural model for human pendrin (Figure 8 a–d). The transmembrane regions of SLC26 proteins are comprised of the gate and the core domains (Figure 8 d), and it is thought that an anion translocating pathway is located between these domains (shown by red broken circle in Figure 8 d; Chang & Geertsma, 2017; Geertsma et al., 2015; Gorbunov et al., 2014; Walter et al., 2019). The locations of the amino acids focused in this study are also shown in the pendrin model (Figure 8 a–c). The missense alteration that result in >80% reduction of HCO3−/Cl− antiport activity (compared with WT) are shown in red, while the others (≤80%) shown in blue. The presence of many red-colored sites within or in the vicinity of the putative anion translocating pathway implies the functional importance of this region, and thus, in turn, supports the pendrin model (Figure 8 ). Given the probable structural and mechanistical similarities shared among the SLC26 family of proteins, a systematic characterization of pendrin missense variants has great potential to provide a common basis for understanding pathologies of disease-associated variants in pendrin and other SLC26 proteins.

A structural model of pendrin viewed from the lateral (a), extracellular (b), and intracellular (c, d) sides. This structural model was generated using Phyre2 (Kelley, Mezulis, Yates, Wass, & Sternberg, 2015) based on the recently solved structure of murine SLC26A9 (Walter et al., 2019). Regions corresponding to Met1-Cys54, Val577-Pro654, and Val733-Ser780 are not shown, because they were not modeled with high confidence. In (a)–(c), the locations of missense changes that result in >80% reduction of HCO3−/Cl− antiport activity are indicated as red, while the others (≤80%) as blue. In (d), the core, gate, and C-terminal cytosolic domains are shown in blue, pink, and gray, respectively. The broken red circle indicates the putative anion translocating pathway
ACKNOWLEDGMENTS
We thank Dr. Jing Zheng for providing laboratory resources for generating the pendrin constructs used in this study. This study is supported by NIH grants (DC014553 and DC017482 to K. H., DC011813 to J. Z.), JSPS Grant-in-Aid for Scientific Research (18K16869 to K. W.), and the Hugh Knowles Center. Imaging work was performed at the Northwestern University Center for Advanced Microscopy generously supported by NCI CCSG P30 CA060553 awarded to the Robert H. Lurie Comprehensive Cancer Center.
CONFLICT OF INTERESTS
The authors declare that there are no conflict of interests.
Open Research
DATA AVAILABILITY STATEMENT
The SLC26A4 variant data have been deposited to and openly available from ClinVar (www.ncbi.nlm.nih.gov/clinvar, Accession IDs: SCV000994858–SCV000994912). All DNA constructs and cell lines generated in this study are available to the scientific community upon request.