Assessing predictions on fitness effects of missense variants in calmodulin
Abstract
This paper reports the evaluation of predictions for the “CALM1” challenge in the fifth round of the Critical Assessment of Genome Interpretation held in 2018. In the challenge, the participants were asked to predict effects on yeast growth caused by missense variants of human calmodulin, a highly conserved protein in eukaryotic cells sensing calcium concentration. The performance of predictors implementing different algorithms and methods is similar. Most predictors are able to identify the deleterious or tolerated variants with modest accuracy, with a baseline predictor based purely on sequence conservation slightly outperforming the submitted predictions. Nevertheless, we think that the accuracy of predictions remains far from satisfactory, and the field awaits substantial improvements. The most poorly predicted variants in this round surround functional CALM1 sites that bind calcium or peptide, which suggests that better incorporation of structural analysis may help improve predictions.
1 INTRODUCTION
The Critical Assessment of Genome Interpretation (CAGI), round five, is aimed to provide an objective evaluation of computational methods for predicting phenotypic impacts of genomic variations. There are 14 challenges in round five, and we present here the assessment of challenge called “CALM1.” In this challenge, fitness scores were provided by a complementation assay developed in Fritz Roth's Lab. The assay evaluated the ability of human calmodulin (CALM1) missense variants to rescue a temperature-sensitive mutation of the yeast ortholog CMD1 (Weile et al., 2017). Conceptually, the fitness score represents the relative growth rate of yeast with CALM1 missense variants to that of yeast with wild-type CALM1. Thus, the deleterious missense variants have fitness scores closer to 0 and tolerated variants have fitness score closer to 1. In the challenge, participants were asked to predict fitness scores for 1,813 missense variants of CALM1. Although the exact values of experimental fitness scores were not given, the distribution was provided to help normalize predictions.
CALM1 is a calcium-sensing protein that modulates the activity of a large number of proteins in the cell. It has dumbbell-shaped structure composed of two globular domains connected by a flexible linker (Babu, Bugg, & Cook, 1988). Each globular domain has two calcium-binding motifs that make up an EF-hand. As a calcium sensor, calmodulin is involved in numerous cellular processes, and is especially important for the normal function of neuron and muscle cells. Its variants have been found to be causally associated with two diseases, ventricular tachycardia, catecholaminergic polymorphic, 4 and long QT syndrome 14 (Boczek et al., 2016; Nyegaard et al., 2012; Yu et al., 2016). Choosing calmodulin as a target to assess the current state-of-the-art in computational methods for variance prediction has a couple of advantages. First, calmodulin is ubiquitous in most eukaryotic cells (Stevens, 1983) providing numerous sequence homologs for sequence analysis. Second, numerous structures of calmodulin complexes are available (Drum et al., 2002; Meador, Means, & Quiocho, 1992; Shen, Zhukovskaya, Guo, Florian, & Tang, 2005). These structures aid in understanding the functional relevance of mutations. Third, various studies have been done to decipher how calmodulin is involved in different pathways (Berchtold & Villalobo, 2014; Parry & June, 2003; Sorensen, Sondergaard, & Overgaard, 2013; Stull, 2001). Overall, the abundance of existing knowledge for calmodulin permits various methods to be applied, and, thus, is a good target for evaluating computational methods.
Current predictors can be divided into following three main types according to their features: (a) prediction based on sequence conservation; (b) incorporation of both sequence and structural information; (c) integration of predictions from several predictors. We received seven predictions from four groups, which include all three mentioned types of methods. The predictors included two published methods: Evolutional Action (group 1) (Katsonis & Lichtarge, 2014) and INPS3D (group 3; Savojardo, Fariselli, Martelli, & Casadio, 2016). Group 2 used average values from PhD-SNP (Capriotti, Calabrese, & Casadio, 2006), PANTHER (Thomas et al., 2003), and SNPs&GO (Calabrese, Capriotti, Fariselli, Martelli, & Casadio, 2009) and group 4 used molecular dynamics. The assessment shows that all predictors except group 4 are capturing qualitative (e.g., deleterious vs. tolerated) effects of variants on proteins. However, the quantitative agreement between predictions and experimental measures remains modest. Most predictors are able to differentiate deleterious variants and tolerated variants. However, the accuracy of the exact values is waiting for substantial improvements.
2 MATERIALS AND METHODS
2.1 Positive control and the baseline predictor

2.2 Quantile transformation of original predictions
Although the distribution of experimental fitness scores was provided, most participants did not calibrate their predictions using it. Thus, normalization of predictions was required to make predictors comparable in their scale, which is especially important for numeric comparison. We performed quantile transformation of the original predictions from participants and of our baseline predictor. Because predictors were not allowed to predict negative values, all negative competitive growth scores were shifted to 0 before transformation. The variants were ranked by the predicted values, and each variant was assigned the experimental score with the same rank. The assigned experimental scores for mutants that are predicted to be ties are further averaged to obtain the final transformed predictions.
2.3 Measures for prediction assessment
Each predictor was evaluated by their ability to (a) classify variants into categories such as deleterious and nondeleterious variants (classification), (b) to rank variants by their impacts on yeast fitness (ordinal association), and (c) to predict experimental fitness scores (numeric comparison). For the assessment, variants were assigned to the following categories by their experimental fitness score: Less than 0.3 for deleterious, between 0.3 and 0.8 for intermediate, and from 0.8 to 1.0 for wild type. Table 1 summarizes all scores used for the evaluation.
| Classification | |
|---|---|
| Area under ROC |  |
 predicted score for positive instance; predicted score for positive instance;  predicted score for negative instance. The area under the curve is equal to the probability that a classifier will rank a randomly chosen positive instance higher than a randomly chosen negative one predicted score for negative instance. The area under the curve is equal to the probability that a classifier will rank a randomly chosen positive instance higher than a randomly chosen negative one |
|
| MCC |  , , |
| i ∊ (deleterious, intermediate, tolerated); TP: true positive; TN: true negative; FP: false positive; FN: false negative. | |
| F1 |  , , |
 ; ;  |
|
| TP: true positive; TN: true negative; FP: false positive; FN: false negative. | |
| Ordinal association | |
| Kendall's τ-b rank correlation |  the number of concordant pairs; the number of concordant pairs;  , the number of discordant pairs; , the number of discordant pairs;  , the total number of pairs; , the total number of pairs;  , number of values in the , number of values in the  group of ties by predictions; group of ties by predictions;  , number of values in the , number of values in the  group of ties by experimental scores. group of ties by experimental scores. |
| Spearman's rank correlation |  |
 , covariance between predicted and experimental ranks of mutants; , covariance between predicted and experimental ranks of mutants;  and and  , standard deviations of predicted and experimental ranks, respectively. Ties were randomly assigned distinct ranks first and then the average of these ranks were assigned to each of them. , standard deviations of predicted and experimental ranks, respectively. Ties were randomly assigned distinct ranks first and then the average of these ranks were assigned to each of them. |
|
| Numeric comparison | |
| Pearson's correlation |  |
 , covariance between predictions and experimental scores; , covariance between predictions and experimental scores;  , standard deviation of predictions; , standard deviation of predictions;  , standard deviation of experimental scores , standard deviation of experimental scores |
|
| RMSD |  |
N, the size of a data set;  , ,  predictions; predictions;  , ,  experimental scores experimental scores |
|
| Value agreement test |  |
| is the percentage of mutants with the difference between the predicted and experimental growth scores below a certain cutoff i. The cutoffs are taken from 0 to 1 with an incremental of 0.01. The area under curve was used as measurement. | |
- Abbreviations: RMSD, root-mean-square deviation; ROC, receiver operating characteristic.
2.4 Evaluation of overall performance and its statistical significance
Four of the measures listed in Table 1 (i.e., the three ordinal associations and the AUC) are purely based on rank and are not sensitive to the distribution of numeric values. Five others depend on the distribution of numeric values and thus were calculated with both original and quantile-transformed predictions. For each measure, we transformed the original scores to Z-scores, and positive control and baseline predictor were excluded from the calculation of mean and standard deviation of original scores to avoid their influence on the score distribution. The average Z-scores of the rank-based, original-value-based, and transformed-value-based measures were computed and summed up to be the final score to assess the performance on each subset.
To take experimental errors into consideration, we assumed that the fitness score for each variant can be randomly drawn from a Gaussian distribution defined by the reported fitness score and the standard error. We simulated 50 datasets using the above method. Then, we performed bootstrap resampling on each simulated dataset 100 times, and thus generated 5,000 mock datasets. We obtained the distribution of ranks for each group on 5,000 mock datasets.
3 RESULTS
3.1 Most variants have minor or no effects on yeast survival
The distribution of experimental fitness scores of variants is depicted in Figure 1. Negative fitness scores were shifted to 0, as the challenge requires nonnegative predictions. A majority of variants are either detrimental or tolerated, and thus the distribution is bimodal. About 71% of variants with fitness scores equal to or above 0.6 and 56% of variants with fitness scores equal to or above 0.8, suggesting variants are biased toward being tolerated to yeast survival.
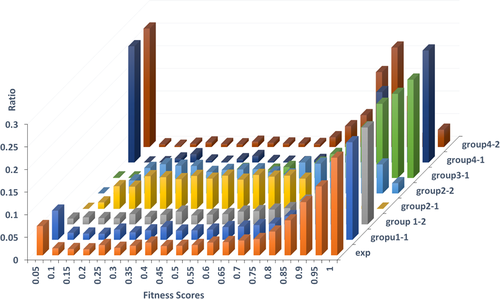
The distribution of experimental fitness scores and predictions. The 3D plot depicts the ratio (Y-axis) of fitness scores (X-axis) from experiment (exp) and all participants (depth axis). All negative fitness scores and predictions are shifted to 0, as the challenge requires nonnegative predictions
3.2 Functional suggestions of variants
The calmodulin gene CALM1 encodes a Ca-binding protein with two tandem EF-hand domains. CALM1 structures adopt various different conformations in response to Ca, and provide selectivity for interacting with cellular targets to drive a wide range of biological processes (Bhattacharya, Bunick, & Chazin, 2004). CALM1 achieves specific recognition of these targets by adopting multiple conformations with and without bound Ca. Figure 2a,b highlight two such alternate conformations. The calmodulin EF-hands bind to the IQ domain of the Ca(v)1.2 Ca2+ channel in a compact parallel conformation (peptide2 binding mode, Figure 2a), with both domains binding the peptide through hydrophobic surfaces (Fallon, Halling, Hamilton, & Quiocho, 2005). Calmodulin binds the inactivation gate (DIII-IV linker) of the cardiac sodium channel in an alternate extended conformation (peptide1 binding mode, Figure 2b), with the CALM1 C-lobe contacting the bound peptide.
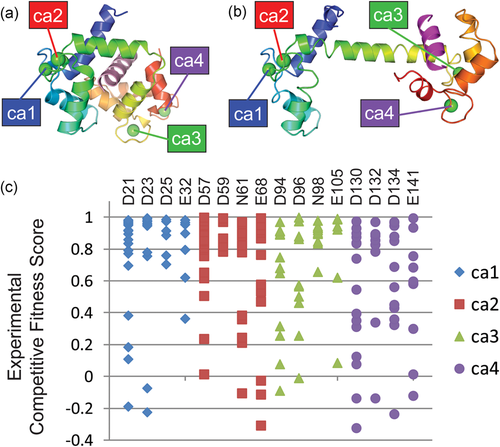
CALM1 Ca-binding functional residue mutations exhibit redundancy. Calcium binding sites are labeled numerically (Ca1-Ca4) and colored according to primary sequence order. Calmodulin structures are colored in rainbow from the N-terminus (blue) to the C-terminus (red). (a) Compact calmodulin structure conformation depicts Ca-dependent binding to the hydrophobic IQ domain (pink cartoon, peptide2 mode) of the cardiac Ca(v)1.2 calcium channel (PDB:2f3y). (b) Extended calmodulin structure conformation depicts Ca-dependent binding to the inactivation gate DIII-IV linker (magenta cartoon, peptide1 mode) of the cardiac sodium channel (Na(V)1.5) (PDB: 4djc). (c) Experimental competitive fitness scores (unscaled) for Ca-binding site mutations diverge from wild-type (green section) through intermediate (yellow section) to detrimental (red section)
Each of the structures binds four Ca2+ ions, with each site using four key acidic residues. The experimental fitness scores for multiple mutations at these Ca-binding sites are plotted in Figure 2c. While a few mutations of key Ca-binding residues are detrimental, most exhibit intermediate and high (tolerated) fitness. This skewed fitness distribution of functional mutations suggests that Ca binding might be redundant. Indeed, fitness scores mapped to the extended CALM1 structure highlight the extreme difference between minimum scores measuring detrimental mutations (Figure 3a), mean scores highlighting a broader range of fitness levels (Figure 3b) with respect to the peptide1 binding mode. The distribution of minimum mean and maximum fitness scores for residues contacting peptide in both binding modes, peptide1 binding mode and peptide2 binding mode are plotted in comparison to the same distributions of Ca binding residues (Figure 3c). The distributions suggest that peptide1 binding mode might contribute more to fitness than peptide2. The relatively lower fitness of the C-terminal Ca binding residues, which contribute to peptide1 binding, also support this notion.
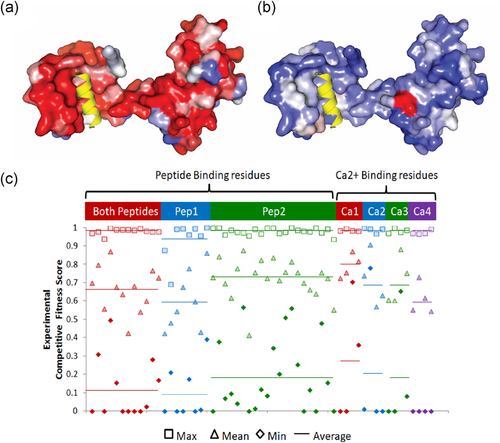
CALM1 peptide binding site mutations exhibit diverse fitness consequences. Extended CALM1 conformation displayed in surface representation bound to peptide 1 (yellow cartoon). CALM1 residues are colored by scale from damaging (red) to tolerated (blue) competitive fitness score. (a) CALM1 colored by the minimum competitive fitness score per site. (b) CALM1 colored by the mean competitive fitness score per site. (c) Experimental competitive fitness scores for residues interacting with both peptide binding modes (red), peptide1 binding mode (blue), and peptide2 binding mode (green) on the left are compared to the Ca-binding residues on the right (grey background, same coloring as in Figure 2c). Maximum fitness scores (square symbols), mean fitness scores (triangle symbols), and minimum fitness scores (diamond symbols) per residue position are indicated by a solid line for the respective average over each category of binding mode residues
3.3 Predictions and experimental fitness scores have disparate distributions
We also plotted the distribution of predicted fitness scores of each participant in Figure 1. Unfortunately, most participants did not normalize their predictions according to the given distribution of experimental fitness scores. The Kolmogorov-Smirnov test indicates that only predictions from group 1 replicate the experimental distribution (p > .05), and the distribution of predictions from group 2-1 is most dissimilar to the experimental distribution. Group 2-1 predicted most variants to have mildly deleterious effects on yeast fitness, with few variants predicted to be tolerated. Considering that different scales of predictions may bias evaluation and conceal the real capacity of predictors to detect the effects of variants, we applied quantile transformation of predicted values of each group to make the results comparable with each other.
3.4 Overall performance of predictors is comparable and far behind accuracy
A similar evaluation strategy (Table 1) as CAGI4 is applied to the predictions from this round to assess the ability of methods to (a) classify variants, (b) rank variants by their effects on fitness, and (c) numerically predict fitness scores of variants. The performance of the predictors on each measure is shown in Table 2. All participants except group 4 show significantly better than random predictions where the best performing group exhibits a Kendall's τ correlation of 0.17. As in the previous CAGI4 round, a baseline control calculated from amino acid frequency in a multiple sequence alignment has comparable and even slightly better performance with the other predictors in this challenge. However, the baseline control stands out more with respect to quantitative metrics as compared to qualitative measures. Group 1, group 2 and the baseline predictor are on par with each other in their ability to rank variants’ effects on yeast fitness. Group 2 marginally outperforms the other two, but the worse original numeric predictions make it rank behind. When comparing group 1 and the baseline predictor, whose prediction distributions resemble the experimental fitness score distribution more closely, the baseline predictor outperformed group 1 in classifying deleterious variants using either original predicted values or rescaled predicted values as criteria. These results suggest the baseline predictor has surpassing ability to identify extremely detrimental variants.
| Group id | Rank-based scores | Original-value based | Rescaled-value based | |||||||||||||
|---|---|---|---|---|---|---|---|---|---|---|---|---|---|---|---|---|
| Tau | Spearman | dele roc | Wild roc | Rmsd | Pearson | Value diff | mcc_dele | mcc_wild | f1 | Rmsd | pearson | Value diff | mcc_dele | mcc_wild | f1 | |
| Baseline | 0.15 | 0.23 | 0.63 | 0.61 | 0.37 | 0.24 | 0.73 | 0.16 | 0.17 | 0.5 | 0.37 | 0.24 | 0.73 | 0.16 | 0.17 | 0.5 |
| Positive | 0.85 | 0.98 | 0.99 | 0.98 | 0.07 | 0.97 | 0.95 | 0.85 | 0.92 | 0.92 | 0.07 | 0.97 | 0.96 | 0.85 | 0.92 | 0.92 |
| 1–1 | 0.15 | 0.22 | 0.63 | 0.61 | 0.38 | 0.22 | 0.73 | 0.11 | 0.16 | 0.48 | 0.38 | 0.22 | 0.73 | 0.11 | 0.16 | 0.48 |
| 1–2 | 0.15 | 0.22 | 0.63 | 0.6 | 0.38 | 0.23 | 0.73 | 0.11 | 0.16 | 0.48 | 0.38 | 0.23 | 0.73 | 0.11 | 0.16 | 0.48 |
| 2–1 | 0.17 | 0.25 | 0.65 | 0.61 | 0.4 | 0.24 | 0.66 | 0.13 | 0.1 | 0.29 | 0.38 | 0.24 | 0.73 | 0.11 | 0.17 | 0.48 |
| 2–2 | 0.15 | 0.23 | 0.64 | 0.6 | 0.37 | 0.22 | 0.69 | 0.1 | 0.09 | 0.34 | 0.38 | 0.22 | 0.72 | 0.09 | 0.17 | 0.47 |
| 3–1 | 0.07 | 0.108 | 0.58 | 0.57 | 0.35 | 0.17 | 0.75 | 0.09 | 0.1 | 0.51 | 0.4 | 0.17 | 0.71 | 0.14 | 0.08 | 0.46 |
| 4–1 | −0.02 | −0.03 | 0.45 | 0.48 | 0.51 | −0.04 | 0.61 | −0.05 | −0.02 | 0.4 | 0.43 | −0.04 | 0.67 | −0.05 | −0.03 | 0.4 |
| 4–2 | −0.01 | −0.02 | 0.49 | 0.49 | 0.5 | −0.03 | 0.61 | −0.03 | −0.01 | 0.34 | 0.43 | −0.03 | 0.67 | −0.05 | −0.03 | 0.4 |
- Abbreviations: Baseline: baseline predictor; dele roc, area under ROC for detecting deleterious variants; f1, F-score for three classes (deleterious, mildly deleterious, tolerated) of variants; mcc_dele, Matthew correlation coefficient for deleterious variants; mcc_wild, Matthew correlation coefficient for tolerated variants; Pearson, Pearson correlation coefficient; positive: positive control; rmsd, root-mean-square deviation; Spearman, Spearman's rank correlation coefficient; τ, Kendall's τ coefficient (τ-b); value diff, area under curve of percentage of variants against the absolute difference between experimental score and predicted score of variants; wild roc, area under ROC for detecting tolerated variants.
To access the significance of our evaluation, we simulated 5,000 datasets by assuming a Gaussian distribution of fitness scores of each variant and using the experimental fitness score and standard error as mean and standard deviation for the distribution, respectively. For each simulated dataset, we calculated assessment measures and obtained a Z-score for each prediction. The distributions of Z-scores of predictors (Figure 4a) do not show clear separation and cover similar range, suggesting comparable performance of several predictors. A striking gap between all predictors and the positive control suggests substantial improvements are needed for accurate predictions. Consistent with Z-score results, the distribution of ranks on 5,000 simulated datasets exhibits a tie between the baseline predictor and group 1 (Figure 4b). Intriguingly, both predictors (baseline and group 1) normalized their predictions to the distribution of experimentally determined fitness scores.
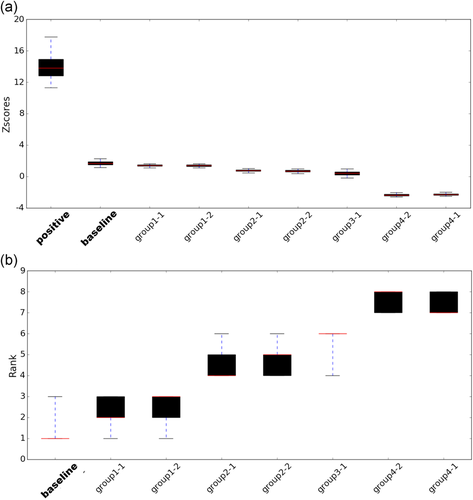
Statistical robustness of Z-scores and rank of predictors. The boxplots illustrate the confidence interval of (a) Z-scores and (b) rank of predictor performance. The red lines indicate the median of Z-scores/rank, the boxes extend from first quantile to the third quantile and whiskers show the 95% confidence interval range. baseline, baseline predictor; positive, positive control
3.5 Modest performance for predicting deleterious and wild-type variants
Differentiating deleterious variants and tolerated variants in silico is considered the major challenge for current computational methods. Thus, we specifically evaluated predictors’ ability to identify deleterious (fitness score <0.3) and tolerated (fitness score > = 0.8) variants. A receiver operating characteristic (ROC) curve exhibits the diagnostic ability of predictors to classify variants into deleterious or tolerated. The area under ROC curve indicates the probability that a predictor will rank a randomly chosen positive instance higher than a randomly chosen negative one. The ROC curves for group 1, 2 and the baseline predictor are tangled together suggesting equivalent performance in classifying deleterious variants (Figure 5). The higher true positive rate at the beginning of the ROC (low false positive) for the baseline predictor implies the most detrimental variants predicted by baseline predictor are more likely to be truly detrimental compared with other predictors. We also calculated Matthews correlation coefficients (MCCs) to evaluate predictors’ performance to classify deleterious or tolerated variants. MCC for classifying tolerated variants of group1 and group2 is higher than that for classifying tolerated variants of two groups, indicating that the predictors are more reliable in detecting tolerated variants (Table 2).

Receiver operating characteristic curve showing performance of predictors for predicting deleterious variants. baseline, baseline predictor; positive, positive control
3.6 Inaccurate predictions on calcium-binding sites and peptide binding sites
The average performance of predictors for each position along the primary sequence of CALM1 is shown in a heatmap (Figure 6a), scaled from green (good performance) to red (poor performance). The performance of predictions around calcium-binding sites is below average. Variants for calcium binding site residues were predicted to be detrimental by most predictors, yet most variants did not exhibit obvious effects on yeast growth (Figure 2c). For example, position D21 is one of the sites where most of variants’ effects are poorly predicted. D21 coordinates Ca in the first EF-hand Ca-binding motif and is conserved among vertebrate CALM1 orthologs. Given this conservation and contribution to function, the lack of detrimental variants at this position is surprising and might suggest that the first Ca binding site in human CALM1 does not contribute to fitness in the yeast complementation system.
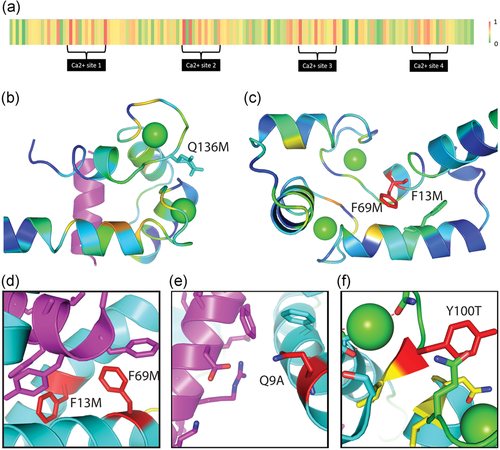
Poorly predicted variants. (a) Heatmap of average performance of predictors on each position. The averages of absolute difference between predictions and experimental fitness scores were colored from low (green) to high (red) for each position (b) CALM1 extended conformation (PDB 4djc) C-terminal EF-hand lobe is colored in rainbow by residue conservation from blue (variable) to red (conserved). Ca (green sphere) and Peptide1 (magenta cartoon) binding site are near intermediate conserved residues. Q136M (sticks) was generally predicted as tolerated, yet resulted in a competitive fitness score of zero. (c) CALM1 extended conformation N-terminal EF-hand lobe depicted as in A shows position of intermediate F13M (stick) and conserved F69M (stick) in site lacking peptide. (d) Zoom of F13/F69 site (red stick) in CALM1 with peptide2 (PDB:2f3y). Both mutations were predicted as tolerated but had detrimental fitness (zero). (e) Zoom of Q9A (red stick) near peptide2 (magenta cartoon) and (f) zoom of Y100T (red stick) near Ca highlight additional tolerated predictions that were experimentally detrimental
Meanwhile, a number of CALM1 variants were generally predicted as tolerated, but they exhibited detrimental experimentally determined competitive fitness scores (Figure 6b–d). One of these poorly predicted variants, Q136M, maps to the C-terminal EF-hand lobe near the Ca binding site (within 4 Å, Figure 6b). This residue displays relatively low conservation and does not coordinate the Ca in the extended structure, which likely resulted in the tendency for tolerated predictions. However, the experimental fitness score for this variant was zero, suggesting that the swap from a polar side chain to a hydrophobic one is detrimental. The backbone of this residue coordinates Ca and perhaps requires a polar side chain interacting with the surrounding solution to adopt the correct orientation.
Two relatively conservative variants of aromatic side chains to hydrophobic ones (F13M and F69M) were also predicted by the community as tolerated. While they do not bind peptide1 in the extended conformation of calmodulin bound to a peptide from the cardiac sodium channel (Na(V)1.5, Figure 6c), they do interact with peptide in an alternate peptide2 binding mode (Figure 6d). The wild type aromatic side chains form π-stacking interactions with aromatic residues from the peptide, potentially explaining the detrimental effect of the variants. An additional poorly predicted as tolerated variant, Q9A also interacts with the peptide2 binding mode (Figure 6e), suggesting that the altered binding surface caused by the variant is detrimental. Finally, the poorly predicted as tolerated variant Y100T is also in the Ca binding site (Figure 6f).
4 DISCUSSION
4.1 Fitness scores from yeast complementation assay can be double-edged
Datasets for evaluating mutation fitness are one of most important factors contributing to the conclusions of the assessment. Many predictors are trained using public datasets such as OMIM (Amberger, Bocchini, Schiettecatte, Scott, & Hamosh, 2015), dbSNP (Sherry et al., 2001), and ClinVar (Landrum et al., 2018) or directly extract variant information from them. Thus, using public datasets for evaluation may have the following disadvantages: (a) biased assessment; (b) overly optimistic performance; (c) inability to extend functional effects to new variants; (d) errors in public databases (Coovadia, 2017; Grimm et al., 2015).
To overcome these shortcomings, the CAGI committee provides a new experimentally determined dataset of variant fitness that is not yet available to the public. This dataset will not have significant overlap with training data used by existing predictors and the large number of missense variants will reveal full capacity of predictors to predict functional effects caused by new variants. However, such datasets do not come without risks. Although yeast and human share a striking number of orthologs and biological pathways, there are numerous human proteins without equivalents in yeast. Some interactors with human calmodulin may be absent in yeast. Human is composed of organs that consist of differentiated cells with disparate functions, but yeast is a single-cell organism. While the yeast complementation assay uses rescue of loss of the yeast ortholog in yeast as criteria to judge effects of variants, calmodulin variants in human may affect other phenotypes unique to higher organisms, such as muscle contraction. In the yeast rescue assay, human calmodulin must interact with partners that have diverged considerably. Thus, the variants which are pathogenic or benign for human may not show the same effects in yeast and vice versa. For example, several disease-related variants in human (N54I, N98S, and E141G) with yeast-derived fitness score very close to 1. Thus, the experimentally determined fitness scores did not capture some variants contributing to human disease.
4.2 Several predictors show comparable performances and are slightly better than others
Although predictors participating in the challenge use different methodologies, not a single group significantly outperformed the others. The baseline predictor and group 1 perform slightly better, with both concentrating on sequence conservation and amino acid frequency. However, they are also the only predictors that normalized predictions according to the experimental distribution. Thus, their better performance may be due in part to good normalization. Group 2 incorporated predictions from several published predictors by using their average prediction values. This method shows a marginally higher value in Kendall's τ correlation, Spearman's rank correlation coefficient and area under ROC curve for detecting deleterious variants. Thus, incorporation of predictions from several methods may provide a strategy for improving performance in the future. However, how to integrate predictions from various sources to obtain a significantly finer prediction is unclear.
Group 3 used a published predictor called INSP3D, which is designed to predict protein stability change upon single point mutation from sequence and structures. Its performance is worse than the baseline predictor, group 1 and 2, as it is possible that many variants on calmodulin affect protein-protein interactions or protein conformational changes instead of protein stability. Therefore, its performance in this challenge may not reflect its real ability to predict protein stability change. Group 4 is the only group with worse than random predictions. It has 20% predictions that are anti-correlating, due to which the overall performance indicators become poor. Group 4 used molecular dynamics to estimate the change in the flexibility profile of a mutant with respect to that of the wild type structure. They hypothesized this change is proportional to the change in the function of a mutant.
4.3 The performance of predictors decreased compared with CAGI4
As assessors for both CAGI4 (Zhang et al., 2017) and CAGI5, we noticed that the performance of predictors did not improve in this round. In fact, performance of predictors was slightly worse than in the previous round. This disappointing trend is possibly due to the small number of participants or the short time for observing improvements of methods since the last challenge. The median Kendall's τ correlation coefficient for the CALM1 challenge was 0.15, as compared to 0.26 for CAGI4. However, these comparisons might not accurately reflect predictor performance, as experimental determination of fitness scores and choice of protein contribute to the results. The CALM1 yeast ortholog evolves faster in fungi, and despite the essentiality of calmodulin in budding yeast, calcium-binding EF-hands are not required, except under certain conditions such as elevated temperature (Geiser, van Tuinen, Brockerhoff, Neff, & Davis, 1991). However, disease-related variants in human predominately surround calcium-binding sites in the C-terminus (Jensen, Brohus, Nyegaard, & Overgaard, 2018). Thus, using budding yeast as organism for testing the functional effects of variants at calcium binding positions could be problematic, although the system seems to work reasonably well (predicting 50% of pathogenetic variants with 90% precision) for pathogenicity prediction (Weile et al., 2017).
A second major difference that could lead to decreasing performance is that UBE2I and calmodulin have different interaction behaviors. The interaction between calmodulin and various targets involves a large interface, a buried surface ranging from 2,400 to 3,000 Å2 for calmodulin/peptide and 5,900 Å2 for EF/calmodulin complex (Hoeflich & Ikura, 2002). A large interface may lead to difficulty to predict the effects of missense variants on interactions. A variant on interface may decrease the affinity but the difference may not result in any detectable functional effects. It will be difficult to infer quantitative relationship between reduction in affinity of interactions and functional effects and thus results in poor predictions.
ACKNOWLEDGMENTS
The CAGI experiment coordination is supported by NIH U41 HG007346 and the CAGI conference by NIH R13 HG006650. The assessment of this challenge is supported by grants (to NVG) from the National Institutes of Health GM127390 and the Welch Foundation I-1505. Olivier Lichtarge and Panagiotis Katsonis were supported by the NIH-GM079656, NIH-GM066099 grants and NIH-AG061105. FPR was supported by grants from the Canada Excellence Research Chairs Program, a Canadian Institutes of Health Research Foundation Grant, and by the National Human Genome Research Institute of the NIH Center of Excellence in Genomic Science Initiative (HG004233).


