CardioVAI: An automatic implementation of ACMG-AMP variant interpretation guidelines in the diagnosis of cardiovascular diseases
Funding information:
This work was partially supported by the Department of Electrical, Computer and Biomedical Engineering of University of Pavia.
Communicated by Mauno Vihinen
Abstract
Variant interpretation for the diagnosis of genetic diseases is a complex process. The American College of Medical Genetics and Genomics, with the Association for Molecular Pathology, have proposed a set of evidence-based guidelines to support variant pathogenicity assessment and reporting in Mendelian diseases. Cardiovascular disorders are a field of application of these guidelines, but practical implementation is challenging due to the genetic disease heterogeneity and the complexity of information sources that need to be integrated. Decision support systems able to automate variant interpretation in the light of specific disease domains are demanded. We implemented CardioVAI (Cardio Variant Interpreter), an automated system for guidelines based variant classification in cardiovascular-related genes. Different omics-resources were integrated to assess pathogenicity of every genomic variant in 72 cardiovascular diseases related genes. We validated our method on benchmark datasets of high-confident assessed variants, reaching pathogenicity and benignity concordance up to 83 and 97.08%, respectively. We compared CardioVAI to similar methods and analyzed the main differences in terms of guidelines implementation. We finally made available CardioVAI as a web resource (http://cardiovai.engenome.com/) that allows users to further specialize guidelines recommendations.
1 INTRODUCTION
Improvements in high-throughput sequencing technologies allow clinical molecular laboratory to increasingly detect a growing number of genomic variants possibly related to Mendelian disorders. Collected variants need to be interpreted by medical geneticists in order to determine putative pathogenic variants for each patient and define the genetic diagnosis. This process involves the utilization of different resources, such as omics-databases, automatic tools (Moorthie, Hall, & Wright, 2013) and familiar co-segregation analysis. The former could gather previous interpretation of variants performed by different laboratories (Landrum et al., 2016) and allele frequency in different populations (Lek et al., 2016; Sherry et al., 2001). Automatic tools can predict the potential damaging effect of the variant, i.e., alteration of normal levels or function of transcript's product (Jian, Boerwinkle, & Liu, 2014; Limongelli, Marini, & Bellazzi, 2015; Quang, Chen, & Xie, 2015). Although damage prediction provides a level of evidence for pathogenicity, benchmarking analysis of these tools have shown a certain bias toward sensitivity, and therefore, hundreds of damaging variants could be tolerated (MacArthur et al., 2014).
Since pathogenicity assessment is a complex process and relies on different sources of information that can be updated over time, discrepancies in interpretation among different laboratories are frequent (Garber et al., 2016) and the adoption of a common framework is required to decrease the number of variants with conflicting pathogenicity assessments (Hoskinson, Dubuc, & Mason-Suares, 2017).
To address this problem, the American College of Medical Genetics and Genomic (ACMG), together with the American Molecular Pathology (AMP) have proposed a set of criteria and rules for the clinical interpretation of sequence variants in genes associated with Mendelian disorders (Richards et al., 2015). According to ACMG-AMP guidelines, variants are classified as pathogenic, likely pathogenic, benign, likely benign, or uncertain significance (VUS). Classification process consists of two layers. First, a set of criteria is checked independently for each variant. Each criterion assesses a particular supporting evidence information, such as its frequency in population databases, in silico prediction of a protein damaging effect, or co-segregation in family members. Criteria are grouped by different levels of evidence and by pathogenic/benign classes. Finally, a set of rules combines the evaluated criteria and classifies a variant accordingly to the final ACMG–AMP five-tier system.
Since their publication, ACMG-AMP guidelines have been adopted in a number of studies, investigating a broad set of phenotypes, ranging from epilepsy, familial adenomatous polyposis, phenylketonuria, maturity-onset diabetes (Alavinejad et al., 2017; Butler, da Silva, Alexander, Hegde, & Escayg, 2017; Paludan-Müller et al., 2017; Santana et al., 2017; Zhang et al., 2016), hereditary breast cancer (Maxwell et al., 2016), and Long QT syndromes (Mazzanti et al., 2018).
Cardiovascular diseases (CVDs) represent a possible field of application for ACMG–AMP recommendations. CVDs encompass a broad set of disorders, such as disease of myocardium, congenital heart disease, or disorders of the heart's electrical circuit. Inherited DNA sequence variants confer a risk for disease development (Kathiresan & Srivastava, 2012). When clinical risk assessment is performed in a patient, genetic testing could reveal the presence of sequence variants that must be interpreted as pathogenic or benign. Results will guide clinical decision, for example, whether to screen, follow-up, and/or preventively treat family members that share pathogenic variants (Ashley et al., 2012; Mazzanti et al., 2018). Our knowledge of genetic mechanisms underlying CVDs is continuously increasing. Incorporating such disease-specific information in ACMG–AMP guidelines implementation will increase our pathogenic detection ability. For example, an overrepresentation of missense mutations in the amino-terminal propeptide domain of DSG2 gene has been observed in patients with arrhythmogenic right ventricular cardiomyopathy (Kapplinger et al., 2011). Also, previous studies have shown that CACNA1C loss of function variants are associated to sudden cardiac death syndrome (Antzelevitch et al., 2007). This kind of disease-specific information should be included in an appropriate knowledge base for a proper CVDs-related variant pathogenicity assessment based on ACMG–AMP guidelines.
Despite the primary aim of ACMG–AMP guidelines is to standardize classification of variants among laboratories, guidelines could be differently interpreted because of their flexible definition (Hoskinson et al., 2017). For instance, one of the strongest pathogenic criteria is applied to null variants (such as nonsense or frameshift), in genes where loss of function (LOF) is a known mechanism of disease. However, how to define an LOF gene can vary among different experts. Variability in the implementation of ACMG–AMP guidelines has been studied by the Clinical Sequencing Exploratory Research (CSER), which compared the interpretation of 99 variants among nine molecular diagnostic laboratories, showing a concordance rate across centers of about 34% only (Amendola et al., 2016). In order to reduce conflicts in interpretation among different laboratories, ClinGen has promoted the development of different Expert Panels to further adapt ACMG–AMP guidelines to specific genes and diseases (Gelb et al., 2018; Kelly et al., 2018). The first example of ACMG–AMP criteria and rules refinement has been proposed by the Inherited Cardiomyopathy Expert Panel (CMP-EP) for the interpretation of variants occurring in MYH7, a gene associated with hypertrophic, dilated, and restrictive cardiomyopathy (Kelly et al., 2018). We expect that more gene-disease guidelines adaptations will be introduced in future.
The application of ACMG–AMP variant classification guidelines and its derivatives can be hindered because of the number and complexity of criteria that need to be evaluated over a large set of variants (thousands in case of large gene panels or exomes) for each patient. Informatics tools have been developed to ease ACMG–AMP guidelines application in clinical routine. For instance, web calculators allow user to select ACMG–AMP criteria verified by the variant of interest, and then they automatically calculate the final classification (Kleinberger, Maloney, Pollin, & Jeng, 2016; Patel et al., 2017). In particular, the ClinGen Pathogenicity Calculator provides supporting data to reach more definitive conclusion, while its configurability accommodates further customization on evolution of ACMG–AMP guidelines. However, web calculator could not solve the issue of interpreting a large set of variants per patient, since they do not automate the entire ACMG–AMP classification process.
For these reasons, the development of automatic tools that implement ACMG–AMP criteria is needed to solve complexity and reproducibility issues over manual application (Amendola et al., 2016). Recently, automated tools for variant interpretation according to ACMG–AMP guidelines have been developed. For instance, InterVar allows the interpretation of multiple variants occurring in any Mendelian genes (Li & Wang, 2017), while CardioClassifier interprets variants occurring in 40 genes associated with CVDs (Whiffin et al., 2018).
Moreover, automatic systems should also be able to incorporate criteria and rules refinements for specific genes and related diseases proposed by expert panels.
In order to automate, standardize, and specialize genomic variant interpretation for CVDs, we have developed CardioVAI (Cardio Variant Interpreter), a web tool to support genomic variant classification according to ACMG–AMP guidelines. Our criteria implementation incorporates CVDs specific knowledge gathered from omics-resources and CMP-EP guidelines adaptation for MYH7 variants. We have automatically extracted and processed all relevant information from public available databases, such as ClinVar, MedGen, ExAC, and Disease Ontology (Kibbe et al., 2015). Each gene-variant is associated to a list of CVDs conditions, according to MedGen (https://www.ncbi.nlm.nih.gov/medgen) and each variant condition is classified with the ACMG–AMP five-tier system (e.g., pathogenic, likely pathogenic, benign, likely benign, uncertain significance, or VUS).
2 METHODS
2.1 Criteria implementation and scoring system
Seventeen of 28 criteria proposed by the original ACMG–AMP guidelines have been implemented in CardioVAI (see Supporting Information Table S1). Despite we did not include the automatic evaluation of the other criteria especially because referring to patient specific information (such as co-segregation of the variant in family members), its manual inclusion is supported (see Web Interface section). Notably, we defined and added a new supporting benign criterion (BP8, see Supporting Information Table S1). Moreover, we have incorporated recent adaptation of ACMG–AMP guidelines for MYH7-related variants (Kelly et al., 2018) proposed by the ClinGen Cardiomyopathy Expert Panel (CMP-EP). As a consequence, MYH7 variants will be classified according to CMP-EP recommendations.
In the classification process, each variant is associated to a list of CVDs, known to be related to the corresponding gene through MedGen database. Each variant-disease or variant-phenotype association undergoes two interpretation steps. First, the tool systematically checks the implemented criteria, then final class is assigned depending on the number of verified criteria and corresponding level of evidence according to ACMG–AMP guidelines.
Our implementation of population frequency criteria, i.e., PM2, BA1, and BS1, relies on three different databases: ExAC, 1000 Genome Project Phase 3 (1TGP), and ESP that are based on different set of sequenced genomes. For pathogenic criterion, if the variant has an allele frequency higher than expected in at least a database, PM2 is not triggered. Conversely, benign criteria are triggered in case variant allele frequency is higher than a threshold in at least a database. Selected frequency thresholds are equal for ExAC and 1000 Genome Project, while ESP threshold is higher since its patients cohort may include several cases with CVDs phenotypes (Auer et al., 2016). Allele frequency threshold has been set to 5% for BA1 for every population database, 0% in case of a dominant disease, and 0.01% in case of a recessive disease for PM2 (0 and 1% for ESP database, respectively). BS1 allele frequency threshold varies according to Orphanet database and in case of a recessive disease for which the carrier frequency is not known, Hardy Weinberg equilibrium is used for its estimation and to set the corresponding frequency threshold. Table 1 reports two CVD examples with corresponding thresholds used for BS1. For MYH7 variants, frequency thresholds are those reported by the CMP-EP (see Supporting Information Table S1).
| Gene | Phenotype | MedGen ID | Inheritance | ORPHA Incidence/Prevalence | BS1 threshold |
|---|---|---|---|---|---|
| SCN5A | Brugada syndrome | C114266 | Autosomal dominant | 0.02% | 0.02% |
| DSC2 | ARV type 11 | C186585 | Autosomal recessive | 0.02% | 2.788427% |
In silico tools selected for implementing PP3 and BP4 are PaPI, DANN, and dbscSNV. The first one combines pseudo amino acid composition (PseAAC), Polyphen2, and Sift to predict and score the functional effect of single nucleotide and short insertions/deletions coding variants (Limongelli et al., 2015). DANN provides a score for variants that occur in noncoding regions as well (Quang et al., 2015), while dbscSNV is useful for the prediction of both coding and noncoding variants occurring nearby splicing sites (Jian et al., 2014).
As a reference for bona fide pathogenic and benign variants, necessary for PS1, PS3, PM5, PP5, BS3, BP6, and BP8, we based on ClinVar repository (version 2017-03). We excluded variants with conflicting interpretation, i.e., variants interpreted both as “Pathogenic/Likely pathogenic” and “Benign/Likely benign” from different submitters. The resulting set includes 21 117 submitted variants in genes associated with CVDs, 4160 were interpreted as “Pathogenic” or “Likely pathogenic” without conflicts, 4947 benign or likely benign variants, and about 670 variants with conflicting interpretation among submitters. Table 2 shows some examples of variants with conflicting interpretation in ClinVar that were not considered for the triggering of related criteria. However, according to CMP-EP, PP5 and BP6 are removed for variants in MYH7 gene.
| Gene | Variant (HGVS) | Clinical significance | ClinVar RCVs |
|---|---|---|---|
| SCN5A |
|
|
|
| SCN5A |
|
|
|
| MYH7 |
|
|
|
| MYH7 |
|
|
|
| LMNA | c.1818+112C>T |
|
|
We then collected more than 200 functional domain regions implicated in CVD disorders from literature. These have been used for PM1 criterion implementation. For instance, we included a hotspot region in DSG2 gene (Kapplinger et al., 2011). Table 3 reports a list of included functional domains.
| Gene | Residues interval | Genomic interval (GrCh37) | Description |
|---|---|---|---|
| DSG2 | L24-Q27 | 18:29098226-29098237 | Overrepresentation of missense mutations in patients with ARV (Kapplinger et al., 2011) |
| LMNA | Y81-R199 | 1:156084950-156085065 | Mutational hotspots in LMNA encoding lamin A/C in patients with familiar dilated cardiomyopathy (Perrot et al., 2009) |
| MYBPC3 | K194-E195 | 11:47363703-47363707 | Mutations in the myosin-binding protein C gene in hypertrophic cardiomyopathy (Cardim et al., 2005) |
| SCN5A | V1882-T1472 | 3:38592160-38592348 | SCN5A mutations associated with human arrhythmia (Musa et al., 2015) |
For PVS1 implementation, about 41 genes associated with CVDs LOF/GOF are well-known mechanism of disease (See Supporting Information Table S2). For the remaining, we collected from ExAC probabilities of being intolerant to LOF mutations in heterozygous (pLI) or in homozygous (pRec) (Lek et al., 2016). For MYH7 variants, this criterion level of evidence has been downgraded to a moderate level of evidence, as stated by the CMP-EP.
Finally, we translate ACMG–AMP levels of evidence (very strong, stand alone, strong, moderate, and supporting) of each class (benign or pathogenic) into scores (Table 4). Final pathogenicity score for each variant-phenotype association is the sum of scores of the triggered criteria. We anticipate that pathogenicity score can be used to provide a rank of variant phenotypes, particularly useful to evaluate VUS and prioritize possible overlapping phenotypes associated to a certain variant (e.g., Long QT vs. Brugada Syndrome for SCN5A gene variants).
| Level of evidence | Score | Class |
|---|---|---|
| Very Strong | +4 | Pathogenic |
| Strong | +3 | Pathogenic |
| Moderate | +2 | Pathogenic |
| Supporting | +1 | Pathogenic |
| Stand-Alone | –1.5 | Benign |
| Strong | –1 | Benign |
| Supporting | –0.5 | Benign |
Detailed information about criteria implementation could be found in Supporting Information Table S1.
2.2 Benchmark datasets
In order to test CardioVAI performance, we collected two benchmark datasets of previously interpreted variants from online resources (CardioDB and CLINVITAE).
CardioDB (Atlas of Cardiac Genetic Variation https://cardiodb.org/ACGV/) contains a list of pathogenic variants related to hypertrophic cardiomyopathy, dilated cardiomyopathy, and arrhythmogenic right ventricular cardiomyopathy. Pathogenicity assessment is performed by the Oxford Molecular Genetics Laboratory (OMGL) and the Laboratory of Molecular Medicine (LMM).
The second dataset is CLINVITAE (https://clinvitae.invitae.com/), an online database that collects interpretation of variants related to a broad set of diseases from different sources, included ClinVar, ARUP Mutation Database, Carver Mutation Database, and Emory Genetics Laboratory Variant Classification Catalog.
In both datasets, we excluded variants with conflicting interpretation among sources. Variants whose interpretation was not clearly indicated in one of the five ACMG–AMP classes were excluded. For example, in CardioDB dataset we filtered out variants interpreted as “VUS favor pathogenic”, while in CLINVITAE variants with status “Suspected benign” or “Unclassified” were kept out.
From CardioDB, we extracted 93 variants in eight CVD genes whose pathogenic interpretation has been assessed both by OMGL and LMM laboratories.
In CLINVITAE dataset, we kept only 58 CVD-related genes (see Supporting Information Table S2). The resulting dataset has 885 variants, 200 interpreted as pathogenic or likely pathogenic, and 685 interpreted as benign or likely benign (see Table 5).
| Dataset | Number of P/LP | Number of B/LB | Total |
|---|---|---|---|
| CardioDB | 93 | – | 93 |
| CLINVITAE | 200 | 685 | 885 |
3 RESULTS
3.1 Benchmark analysis
Each collected variant undergoes CardioVAI classification process. A variant may be interpreted as Pathogenic for a phenotype and VUS for another. Therefore, we labeled as “Pathogenic” or “Likely pathogenic” (P/LP) variants with at least one pathogenic or likely pathogenic phenotype association. The same logic is applied to “Benign” or “Likely benign” variants (B/LB). If a variant has pathogenic and benign association for two different phenotypes, it is considered to belong both to P/LP and B/LB classes. P/LP and B/LB variants were considered as positive and negative classes, respectively, while predicted VUS have been considered as error type I/II. Herby, we will use sensitivity and specificity terms according to these definitions.
Table 6 reports pathogenic and benignity concordances of CardioVAI classification on CardioDB and CLINVITAE benchmark datasets. CardioVAI reached an average sensitivity of 74.8% and a specificity of 97.08%. Because CardioDB exclusively reports pathogenic variants, specificity has been calculated on CLINVITAE dataset only.
| Dataset | Pathogenicity concordance | Benignity concordance |
|---|---|---|
| CardioDB | 66.6%(62/93)) | – |
| CLINVITAE | 83%(166/200) | 97.08%(665/685) |
Figure 1a and b show Venn diagrams of benign and pathogenic CLINVITAE variants classified by CardioVAI. Notably, all those misclassified variants in CLINVITAE have been predicted as VUS, therefore there were no truly pathogenic variants classified as B/LB or truly benign variants classified as P/LP. Instead, only one pathogenic variant (MYH7:p.Arg442Cys) in CardioDB benchmark was misclassified as LB (see Venn Diagram in Figure 1c). This variant occurs in MYH7 gene, therefore it has been classified according to CMP-EP adapted criteria. Since variant is observed in 1TGP database with an allele frequency of 0.3%, BS1 (stand-alone criterion for “Likely benign” classification in CMP-EP adapted rules) has been triggered.
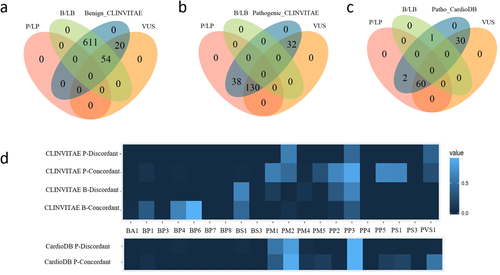
In order to understand which implemented criteria contributed more to the final classification, we built a differential criteria heatmap on CLINVITAE data. Since 17 MYH7 variants were classified according to CMP-EP adapted criteria, we excluded such variants from the criteria heatmap analysis. We divided variants into four groups, according to benign/pathogenic concordance and discordance (as shown in Figure 1a and b). For each group, scores representing the mean of criterion activation in CardioVAI for that group are computed. Results are shown in Figure 1d. Both for benign and for pathogenic concordance groups, the more frequent triggered criteria are those relying on bona fide variants collected from ClinVar (PP5, BP6, and PS1) and those based on in silico tools combination (PP3 and BP4). This result confirms that our selected methods for damaging prediction well support pathogenicity evidence. Other frequent criteria rely on population frequency (BS1 and PM2), while the activation of PM1 criterion in pathogenic concordance groups confirms the importance of the functional domains collected from literature in pathogenic detection. In discordant groups, we can observe that despite the misclassification, active criteria's type (benign/pathogenic) is concordant with the true classification in CLINVITAE. Only PP3 criteria is often triggered in benign variants as well, suggesting that in silico tools are more biased toward a protein-damaging effect of variants.
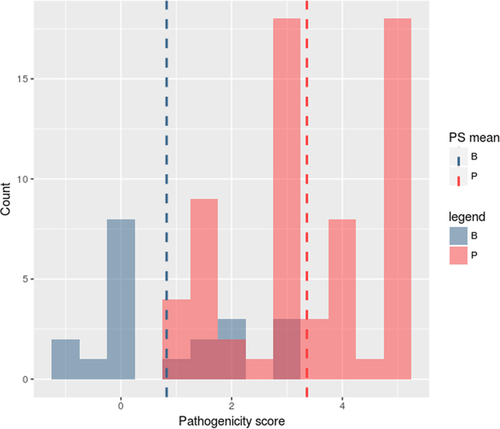
To assess whether the introduction of a pathogenicity score could help in VUS prioritization, we evaluated the distribution of pathogenicity scores of benchmark classified variants that CardioVAI predicted as VUS. The total number of predicted VUS variants is 84 (54 from CLINVITAE and 30 from CardioDB, about 20 benign and 64 pathogenic variants). The distribution of pathogenicity score for these VUS variants is shown in Figure 2. Scores distribution multimodality is confirmed by the dip test of unimodality (Hartigan & Hartigan, 1985) (dip test index D = 0.10714, P-value < 2.2 × 10⁻¹⁶). Moreover, since P-value is less than 0.05, we can confirm that scores distribution is at least a bimodal distribution (Freeman & Dale, 2013), thus reflecting the actual classification in benchmark datasets. Finally, we have carried on a ROC analysis (see Supporting Information Figure S1) of the pathogenicity score on the whole CLINVITAE benchmark dataset, obtaining an AUC of about 91.43%.
3.2 Comparative analysis
We compared our approach to InterVar and CardioClassifier, two similar ACMG-based automatic tools while excluding from the comparative analysis tools like ClinGen Pathogenicity Calculator since the user is needed to manually select criteria for each variant.
Since InterVar and CardioClassifier do not incorporate CMP-EP interpretation framework, we excluded from benchmark dataset 42 MYH7 variants from CardioDB and 17 MYH7 variants (five pathogenic and 12 benign) from CLINVITAE. In fact, CardioVAI interprets MYH7 variants according to CMP-EP specific recommendations, which substantially refined ACMG–AMP guidelines. In order to avoid classification comparison made with different interpretation systems (the ACMG–AMP guidelines and the CMP-EP recommendations), we excluded MYH7 variants from comparative analysis.
Both InterVar (version 0.1.7) and CardioClassifier (accessed in November 2017) were run with default settings.
InterVar is a freely available semi-automatic pipeline (Li & Wang, 2017). As for CardioVAI, ClinVar is the reference database for well-established pathogenic/benign variants. The number of common implemented criteria is 17. In addition, InterVar implements BS2 benign criterion. We ran InterVar on 51 pathogenic variants from CardioDB. Compared to CardioVAI that was able to correctly classify 46/51 pathogenic variants, InterVar correctly detected only 23/51 pathogenic variants. Figure 3a shows CardioVAI and InterVar results on CardioDB benchmark dataset upset diagram with intersected variant classifications. Figure 3b shows differences in criteria activation between CardioVAI and InterVar for those variants that were correctly interpreted by CardioVAI but not by InterVar.
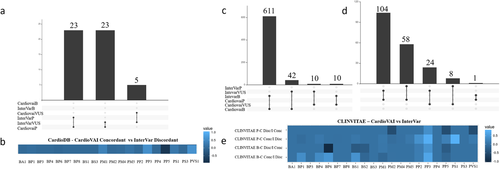
CardioClassifier (https://www.cardioclassifier.org/) is a web tool developed by the Cardiovascular Genetics and Genomics team of the Imperial College London. It is able to automatic classify variants related to CVDs implementing 17 ACMG-AMP criteria, but is limited to 40 genes only. Therefore, we compared CardioVAI to CardioClassifier on a CLINVITAE variants subset, corresponding to those variants in these supported CVDs-related genes. CardioDB variants were not included in the comparison analysis in this case since they have been all used as reference for bona-fide pathogenic variants by CardioClassifier, thus avoiding a biased benchmark analysis. We collected 462 CLINVITAE variants (166 pathogenic and 296 benign) in 13 genes that could be classified by CardioClassifier. Concordance with CLINVITAE benchmark dataset for CardioClassifier, CardioVAI, and InterVar is shown in Figure 4. Despite all three classifiers reported high benignity concordances (greater than 90%), CardioVAI showed the highest sensitivity (84.9%) and specificity (96.96%). Moreover, compared to CardioClassifier and InterVar, CardioVAI was able to reduce the number of VUS of about 65.3% (from 98 to 34 VUS) and 70.9% (from 179 to 52 VUS), respectively. See Figure 3 for upset diagrams showing the classified variants intersections between the methods.
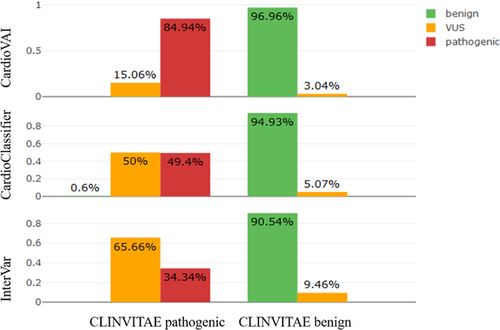
In order to better understand which criteria contributed to different performances between classifiers, we analyzed InterVar and CardioVAI classification on CLINVITAE dataset. InterVar output is a tab-delimited file, which contains the list of triggered criteria for each variant and it could be easily processed. Because CardioClassifier does not allow results to download, it was not possible to perform such analysis with this tool.
Figure 3c and d show CLINVITAE benign and pathogenic variants classified by InterVar and CardioVAI respectively. Variant classification mismatches between the two methods (those correctly classified by CardioVAI and not by InterVar and viceversa) were grouped into a differential criteria heatmap (Figure 3e) to highlight the differences between the two tools in terms of ACMG–AMP activated criteria.
Remarkable differences have been observed in criteria based on bona fide pathogenic/benign variants knowledge base (i.e., ClinVar) criteria, i.e., BP6, PP5, and PS1. Differences could be explained by the use of different ClinVar versions (201703 vs. 20160302) and the way of database processing (e.g., normalization and use of variants with conflicting interpretations). Notably, CardioVAI is very stringent with ClinVar interpretations of pathogenicity, requiring the presence in ClinVar of the phenotype for which the assessment has been done. BS2 criterion, not implemented by CardioVAI, contributes to concordant benign classification, while our introduced BP8 criterion did not affect classification in this particular dataset. The analysis highlights the well-known flexibility in ACMG–AMP criteria implementation (Hoskinson et al., 2017): discordant activation in BP1 and PP2 criteria is due to different implementation strategy by CardioVAI and InterVar in the definition of “missense gene” and “truncating gene” (genes for which primarily missense/truncating variants are known to cause disease). PP3 criterion (in-silico prediction tools) contributes to the pathogenicity assessment gap between the two tools as well, potentially justified by the different tools used (PaPI and DANN for CardioVAI and MetaSVM and GERP++ for InterVar). However, the PP3 criterion results overrepresented for benign variants too, thus confirming that in silico tools have a bias toward protein-intolerance prediction (Ghosh, Oak, & Plon, 2017).
3.3 Validation on MYH7 variants assessed by ClinGen Expert Panel
We further validated CardioVAI by comparing its ACMG–AMP-based classification on 60 MYH7-related variants assessed by ClinGen's Inherited Cardiomyopathy Expert Panel (CMP-EP) (Kelly et al., 2018). In this work, ACMG–AMP guidelines have been applied to MYH7 gene, providing a set of adjusted criteria and final classification rules. Refinements includes specific allele frequencies thresholds for BA1 and BS1 and changes in criteria levels of evidence. For instance, PVS1 criterion has been declassed from “very strong” to “moderate”. Final rules for five-tier classification were also revised. For instance, BS1 criterion has been considered a stand-alone criterion to classify a likely benign variant (see Supporting Information Table S1). Moreover, family co-segregation and case-control studies have been additionally used in CMP-EP.
CardioVAI implements ACMG–AMP guidelines revised for CMP-EP specification on MYH7 variants and we compared the results on the 60 expert-panel validated variants. Since these variants were interpreted by the CMP-EP using co-segregation data as well, we activated corresponding criteria to the final classification. We achieve a concordance of 93.4%: only four variants out of 60 were incorrectly classified by CardioVAI mainly due to different population databases used (1TGP, ExAC, and ESP for CardioVAI and ExAC only for CMP-EP).
The p.Glu1902Gln variant is classified as LB by CardioVAI, since it is reported in 1TGP at allele frequency (0.039%) greater than the proposed threshold (0.02%) and therefore CardioVAI triggered BS1 criterion which is stand alone for LB interpretation. CMP-EP reports the same variant as VUS, since it is reported at a lower allele frequency in ExAC only (0.0074%). Interestingly, another variant (p.Arg787His) has been classified as LB by CardioVAI since it is reported in ExAC with frequency 0.022% (thus activating the BS1), however the same variant has been interpreted as VUS by the CMP-EP and BS1 was not triggered in this case (Kelly et al., 2018). The third case is an LP variant that CardioVAI classifies as VUS (p.Arg1045Cys). The missing criteria for classification is PM2, since the variant is present in 1TGP at higher frequency (0.01997%) than the threshold set by CMP-EP for this criterium (0.004%). Finally, p.Arg1420Trp is reported as LP by the CMP-EP panel and triggers two pathogenic moderate criteria and one pathogenic supporting criteria (PM2, PS4 declassed to moderate, and PP3). However, according to CMP-EP final rules, the variant should not reach sufficient evidence for pathogenicity as reported by CardioVAI. See Supporting Information File S2 for further information.
3.4 CardioVAI on all missense variants in CVDs-related genes
We collected about 600 000 variants in 72 genes associated with CVDs from dbNSFP (Liu, Wu, Li, & Boerwinkle, 2016), a database of all possible non-synonymous single nucleotide variants in human genome. Genes were selected according to three different resources: the TruSight Illumina Cardiomyopathy Panel, CardioDB, and our in-house knowledge base. The complete gene list and the corresponding sources are reported in Supporting Information Table S3. Among 72 genes, CardioVAI identified about 11.6% of pathogenic/likely pathogenic variants for at least a CVDs disorder. About 25.2% are interpreted as benign or likely benign (Figure 5a).
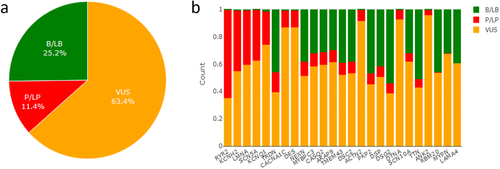
Among 72 genes, the most significantly classified are shown in Figure 5b.
Highest percentages of pathogenic/likely pathogenic variants were found in KCNH2, SCN5A, LMNA associated with Long QT syndrome, Brugada syndrome, and Familial dilated cardiomyopathy. respectively. Conversely, very few pathogenic variants were reported in genes such as LAMA4 and MYPN that are associated to dilated cardiomyopathy both in CardioDB and MedGen. A possible explanation of the low rate of pathogenic-predicted variations could be the tolerance that these two genes show to missense variants (that represents the majority of CardioVAI interpreted variants). In fact, both genes have an ExAC missense zscore lower than 0 (–0.35 for MYPN and –0.67 for LAMA4).
We studied the correlation between the percentage of each gene pathogenic variants with the number of associated phenotypes (see Supporting Information Figure S2). Pearson correlation coefficient is about 0.76, denoting that genes with higher percentage of pathogenic variations are more associated with a higher number of phenotypes, thus reflecting their important role in different biological mechanisms related to CVDs.
3.5 Web interface
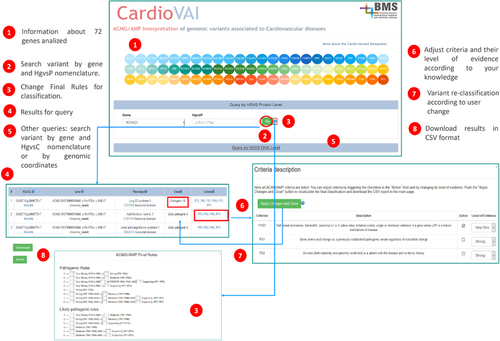
We developed a web resource (http://cardiovai.engenome.com) to query CardioVAI precomputed classification of all non-synonymous variants in 72 CVDs-related genes (see Figure 6). Users can search a variant by genomic coordinate or HGVS nomenclature (coding or protein) and customize ACMG–AMP rules for final classification. Each row of the resulting table corresponds to the interpretation of a certain variant phenotype. Rows are ordered by pathogenicity score and additional information about variant annotation (e.g., gene, ClinVar, population databases, and in-silico tools predictions) and classification within its triggered criteria are provided. ClinVar cross-references are shown in case a variant matches with a ClinVar submissions, both at the nucleotide and amino acid level. For each variant-phenotype, all 28 ACMG-AMP criteria are listed and users can adjust the final classification by manually trigger or deactivate specific criteria and their level of evidence. User is allowed to download a tab-delimited file that contains CardioVAI interpretation of the variant, but also the entire precomputed classification of all non-synonymous variants.
4 DISCUSSION
ACMG–AMP guidelines have established a standard for germline variants interpretation in clinical practice and are suitable especially for Mendelian disorders. Manual implementation of these guidelines is challenging and error-prone, therefore automatic tool must be developed in order to support the implementation of such guidelines in clinical routine.
With this goal in mind, we have developed CardioVAI, a tool to automatically classify genomic variants in CVDs-related genes accordingly to ACMG–AMP five-tier class system, showing supporting evidence in terms of activated guidelines criteria.
We have incorporated tailored CVDs information such as genes–phenotype relations and hotspot domains, implemented different strategies to trigger ACMG–AMP criteria. We integrated different omics data sources such as ClinVar, MedGen, Disease Ontology, and Orphanet to build an exhaustive knowledge base of bona-fide pathogenic/benign variants and gene-phenotype relations. We have proposed the introduction of a reasonable benign supporting criterion (BP8), to be triggered when a genomic variant with a same amino change has been reported as a benign or likely benign by a reputable source. BP8 represents the benign counterpart of the pathogenic PS1 criterion. Moreover, we incorporated recent refinements of ACMG–AMP guidelines for the classification of MYH7 variants proposed by the CMP-EP.
Gene variants are classified for all known gene-related phenotypes and a pathogenicity score is assigned to highlight VUS variants as possible candidates for a further assessment. We showed that pathogenicity score, despite defined heuristically, follows a bimodal distribution corresponding to true pathogenic and benign classes and reached an AUC of about 91.43% with the ROC analysis. However, the quantitative ACMG–AMP based score system can be further improved by adopting Bayesian methods such as the one defined for germline cancer variant interpretation (Plon et al., 2008).
CardioVAI showed a specificity of 97.08% and an average sensitivity of 74.8% on two different benchmark datasets (CardioDB and CLINVITAE) basing solely on the evidence of 17 ACMG–AMP criteria (co-segregation and phenotype-specific information were not available). The comparison with similar tools (InterVar and CardioClassifier) showed that CardioVAI is the most sensitive and specific tool and was able to reduce the number of VUS up to 70.9%. These differences in interpretation confirm the flexibility of ACMG–AMP criteria implementation (Hoskinson et al., 2017). We reported major differences in the assessment of the proposed criteria. In particular, difference in evaluating criteria PS1, PP5, and BP6 that rely on matches with well-established pathogenic variants confirms the importance for laboratories to curate and maintain repositories of bona-fide pathogenic and benign variants. Unlike CardioVAI, InterVar and CardioClassifier do not incorporate recent refinements for MYH7 variants interpretation and do not allow user to complete customize interpretation changing final rules. In addition, CardioVAI provides a quantitative score that may help in VUS prioritization.
We conducted an additional validation on 60 variants on MYH7 by CMP-EP and reported a classification concordance of 93.4%, further showing the importance of population-database selection for the evaluation of criteria such as BS1 and PM2. We also reported a possible variant misinterpretation according to the CMP-EP MYH7 guidelines (p.Arg1420Trp) that at the time of this writing is reported in ClinVar as Likely pathogenic instead of VUS (because of only two moderate and one supporting pathogenic activated criteria).
We finally analyzed CardioVAI interpretation on all possible missense variants in 72 CVDs-related genes by using 17 out of 28 implemented ACMG–AMP criteria. About 74% of overall variants were predicted as VUS, 16% as benign or likely benign and almost 10% as pathogenic or likely pathogenic. Therefore, for the majority of missense variants, current a-priori knowledge is still insufficient for a clear classification and further information on the specific clinical case under evaluation is needed (e.g., specific observed phenotype and family co-segregation). However, we found the highest fractions of predicted pathogenic variants in SCN5A, AKAP9, KCH2, and DSP genes and we reported a significant correlation between the percentage of pathogenic variants and the number of phenotypes associated to the genes, showing that genes with a higher number of pathogenic variants play a central role in biological mechanisms related to CVDs.
Finally, we made CardioVAI freely available as a web resource (http://cardiovai.engenome.com). Our tool represents the first method that implements and tailors ACMG–AMP guidelines on the most exhaustive set of known CVDs-related genes. Moreover, CardioVAI is the first tool, to our knowledge, to consider the ClinGen Expert Panel adaptation of ACMG–AMP interpretation system for MYH7-related variants.
ACKNOWLEDGMENTS
I.L., G.N., and R.B. conceived the study. G.N. and I.L. implemented the software. G.N. and I.L. wrote the article. R.B. and S.P. revised the article. C.N., P.G., M.M., A.M., and A.M. helped in the definition of cardiovascular gene and disease knowledge base.
DISCLOSURE
I.L. and R.B. have shares of enGenome srl, an italian bioinformatics company.


