Capicua suppresses hepatocellular carcinoma progression by controlling the ETV4–MMP1 axis
Potential conflict of interest: Nothing to report.
Supported by grants from the National Research Foundation of Korea, funded by the Korean Ministry of Science, ICT and Future Planning (2015R1A1A1A05001401 and 2017R1A5A1015366, to Y.L., and 2015R1A2A2A01004921, to S.K.); the POSCO green science program; the TJ Park Science Fellowship of the POSCO TJ Park Foundation; and the BK21 Plus Program, Program of Bio-Molecular Function, POSTECH (E.K., D.K., J.-S.L., J.Y., and J.P.).
Abstract
Hepatocellular carcinoma (HCC) is developed by multiple steps accompanying progressive alterations of gene expression, which leads to increased cell proliferation and malignancy. Although environmental factors and intracellular signaling pathways that are critical for HCC progression have been identified, gene expression changes and the related genetic factors contributing to HCC pathogenesis are still insufficiently understood. In this study, we identify a transcriptional repressor, Capicua (CIC), as a suppressor of HCC progression and a potential therapeutic target. Expression of CIC is posttranscriptionally reduced in HCC cells. CIC levels are correlated with survival rates in patients with HCC. CIC overexpression suppresses HCC cell proliferation and invasion, whereas loss of CIC exerts opposite effects in vivo as well as in vitro. Levels of polyoma enhancer activator 3 (PEA3) group genes, the best-known CIC target genes, are correlated with lethality in patients with HCC. Among the PEA3 group genes, ETS translocation variant 4 (ETV4) is the most significantly up-regulated in CIC-deficient HCC cells, consequently promoting HCC progression. Furthermore, it induces expression of matrix metalloproteinase 1 (MMP1), the MMP gene highly relevant to HCC progression, in HCC cells; and knockdown of MMP1 completely blocks the CIC deficiency–induced HCC cell proliferation and invasion. Conclusion: Our study demonstrates that the CIC–ETV4–MMP1 axis is a regulatory module controlling HCC progression. (Hepatology 2018;67:2287-2301).
Abbreviations
-
- CIC
-
- capicua
-
- Cic LKO
-
- liver-specific Cic knockout
-
- DEN
-
- diethylnitrosamine
-
- ERK
-
- extracellular signal–regulated kinase
-
- ETV4
-
- ETS translocation variant 4
-
- HCC
-
- hepatocellular carcinoma
-
- MMP
-
- matrix metalloproteinase
-
- PEA3
-
- polyoma enhancer activator 3
-
- RTK
-
- receptor tyrosine kinase
-
- shCIC
-
- short hairpin RNA against CIC
-
- siRNA
-
- small interfering RNA
-
- TCGA
-
- The Cancer Genome Atlas
-
- WT
-
- wild type
Hepatocellular carcinoma (HCC) is the second leading cause of cancer-related death worldwide and the fifth most common malignancy, especially in East Asia and South Africa.1, 2 In most cases, human HCC is driven by chronic hepatitis B virus or hepatitis C virus infection, alcohol abuse, nonalcoholic fatty liver disease, autoimmune hepatitis, diabetes mellitus, and several metabolic diseases.3
Among multiple therapeutic strategies to overcome HCC, liver resection is still the best, with a 5-year survival rate of approximately 70%.3 Another option is orthotopic liver transplantation, which has the lowest risk of tumor recurrence but is applied to very few patients. Radiofrequency ablation and transarterial chemoembolization are other therapeutic strategies but have marginal effects. Because of these limitations of HCC treatment, many studies are focused on finding molecular therapies for HCC. Sorafenib, a related multikinase inhibitor, is currently the only drug approved for advanced HCC management. Despite sorafenib treatment, overall survival is increased by only 37%, with several major side effects including acne-like rash, diarrhea, fatigue, and hypertension.4
In the search for a better understanding of and efficacious treatment for HCC, many cancer drivers and molecular therapies have been reported.5 Some studies have explored HCC genomic alterations and identified frequently mutated genes, including TERT promoter, TP53, and CTNNB1 (β-catenin).6, 7 In addition, chromosomal amplifications (1q, 6p, 8q, 11q, 17q, and 20q) and deletions (4q, 8p, 13q, 16q, and 17p) that affect important oncogenes and tumor suppressors have been identified in samples from patients with HCC.8 Moreover, several signaling pathways have been investigated as targets of novel therapies for HCC including the RAS, transforming growth factor beta, fibroblast growth factor-19/fibroblast growth factor receptor-4, and MET signaling pathways.9 Importantly, RAS signaling is related to cell survival and proliferation and is activated in >50% of HCCs.10, 11 Although HCC progression is considered a multistep and long-term progressive process, the precise molecular mechanism of HCC pathogenesis remains largely unknown.12
Capicua (CIC) is a transcriptional repressor that is highly conserved from Caenorhabditis elegans to humans.13 There are two main isoforms of CIC, the short and long forms, which differ in their amino-terminal portions. CIC has two highly conserved domains: a DNA-binding high mobility group box domain and a carboxy-terminal motif (C1).13 CIC preferentially recognizes T(G/C)AATG(G/A)A sequences through the high mobility group box and C1 domains to repress expression of its target genes in Drosophila and mammals.14-16 CIC activity can be regulated by receptor tyrosine kinase (RTK) signaling pathways in Drosophila and mammals.17-19 Activation of RTK–mitogen-activated protein kinase pathways phosphorylates CIC, resulting in degradation and/or cytoplasmic localization of CIC.20, 21
Cic was first identified in a screen for mutations affecting tissue patterning in Drosophila embryos.17 In Drosophila, several studies revealed that Cic regulates not only anteroposterior and dorsoventral body patterning but also intestinal stem cell proliferation,22 wing development,23 and other processes in development.24
In mammals, CIC has been implicated in the pathogenesis of spinocerebellar ataxia type 1 neurodegenerative disease,25 as well as regulation of essential processes such as lung alveolarization,26 liver homeostasis,27 learning and memory,28 and follicular helper T-cell differentiation.29 CIC has also been studied in several cancer contexts, and mutations of it have been found in soft tissue, brain, lung, gastric, prostate, and breast cancers.14, 21, 30-32 Furthermore, CIC directly suppresses expression of polyoma enhancer activator 3 (PEA3) group genes (ETS translocation variant 1 [ETV1], ETV4, and ETV5), which are known to be frequently overexpressed in many cancers and to have tumor-promoting functions.14, 30, 33, 34
Although increasing evidence has indicated that CIC functions as a tumor suppressor in various cancers,19, 21, 35, 36 no studies have examined its clinicopathologic significance and molecular functions in HCC. In this study, we present evidence that a decreased level of CIC is associated with HCC progression and indicates poor prognosis. Both in vitro and in vivo assays demonstrate that CIC has a tumor suppressive function in the progression of HCC. Molecular studies reveal that CIC regulates ETV4 expression in HCC cells and that matrix metalloproteinase 1 (MMP1) acts as a key downstream target of the CIC–ETV4 axis in the HCC context. Therefore, our findings suggest that the CIC–ETV4–MMP1 regulatory axis might have a critical role in HCC progression.
Materials and Methods
TISSUE MICROARRAY AND IMMUNOHISTOCHEMISTRY
Two liver cancer tissue microarrays with liver tumors and adjacent normal liver tissues (LV1221 and LV6161) were purchased from Biomax (MD, USA). Formalin-fixed, paraffin-embedded specimens were deparaffinized and stained with rabbit polyclonal anti-CIC antibody. Each sample stained with anti-CIC antibody was scored as negative (–), weak (+), moderate (++), or strong (+++) according to the staining intensity. These scores were determined independently by two pathologists. The scoring by the pathologists was done in a blinded manner.
INDUCTION OF HCC IN MICE
To induce HCC, diethylnitrosamine (DEN; Sigma-Aldrich, MO) was injected intraperitoneally into 2-week-old male mice (5 μg/g). For tumor formation analysis, mice were sacrificed to prepare liver tissues at 8 months after DEN treatment. Externally visible tumors (>1 mm) on the liver were counted and measured. Livers were microdissected into tumor and nontumor sections and stored at −80°C until analyzed by quantitative RT-PCR.
Lung metastasis and survival were analyzed at 15 months after DEN treatment. The survival of mice was recorded weekly. After 15 months, mice were sacrificed, and their lungs were dissected, paraffin-embedded, and used for hematoxylin and eosin staining. Serial sections of entire lung tissues were conducted. Four sections per lung tissue were chosen for hematoxylin and eosin staining. The total number of metastasized tumor lesions was determined from the hematoxylin and eosin–stained sections and used for calculation of the average number of tumor foci in a lung tissue for each genotype.
Other assays used in this study are described in the Supporting Information.
Results
INVERSE CORRELATION BETWEEN CIC PROTEIN LEVELS AND HCC SEVERITY
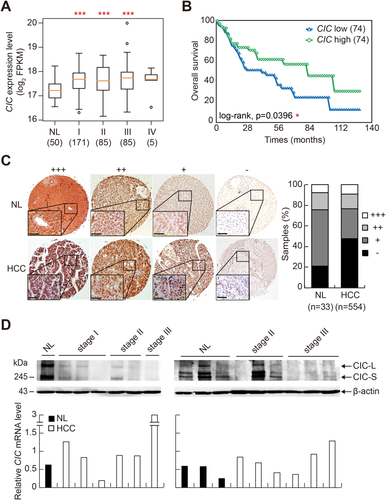
Because the role of CIC in HCC development and progression has not yet been determined, we analyzed The Cancer Genome Atlas (TCGA) data sets for patients with HCC (Supporting Table S1) in order to gain insight on the relevance between CIC and HCC pathogenesis. CIC mRNA levels were not down-regulated but rather increased in HCC tissue samples compared with normal liver tissues (Fig. 1A). However, the survival rate was significantly decreased in HCC patients with low levels of CIC (lower 20%, n = 74) compared to those with high levels of CIC (upper 20%, n = 74) (Fig. 1B; Supporting Table S2). Studies have demonstrated that activation of epidermal growth factor receptor and its downstream signaling molecules, which promote tumorigenesis and cancer metastasis, inactivates CIC through either degradation or cytoplasmic translocation.20, 21 Moreover, we have shown that CIC protein levels were dramatically decreased in prostatic adenocarcinoma.35 Thus, we examined CIC protein levels in normal liver and HCC tissues on tissue microarrays by immunohistochemistry using anti-CIC antibody. Reduced expression of CIC was more frequently observed in HCC samples than in normal liver tissues (Fig. 1C). To directly address whether CIC expression decreases in HCC tissues at the protein level, but not at the mRNA level, we examined expression profiles of both CIC protein and CIC mRNA in the same tissue samples of normal liver and HCC of different pathological stages (Supporting Table S3). Most HCC tissues showed reduction in CIC protein levels compared with normal liver tissues, whereas the CIC mRNA level was not correlated with the CIC protein level in each tissue sample (Fig. 1D), suggesting the posttranscriptional regulation of CIC expression in HCC cells. Taken together, these data indicate an association of CIC levels with HCC progression.
CIC SUPPRESSES HCC PROGRESSION
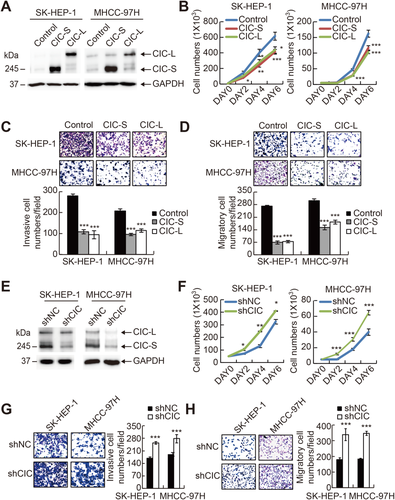
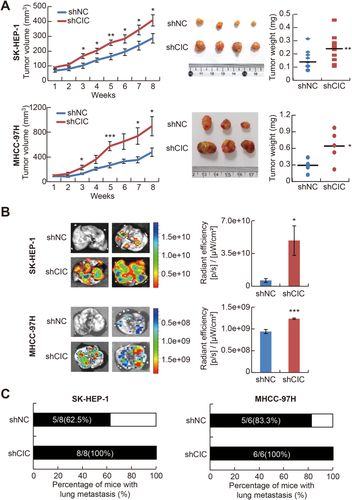
To test whether CIC has a suppressive function in HCC progression, we examined the effect of CIC overexpression on HCC cell growth and invasion. We chose SK-HEP-1 and MHCC-97H cells, which are highly metastatic and aggressive HCC cell lines,37, 38 for the experiments because they express relatively low levels of CIC compared with other HCC cell lines (Supporting Fig. S1). Forced expression of either the short or the long form of CIC suppressed cell proliferation, invasion, and migration in both cell lines (Fig. 2A-D). Then, we tested whether suppression of CIC expression has the opposite effects. HCC cells that stably express short hairpin RNA against CIC (shCIC) had increased proliferation rate and invasive and migratory activity compared with control HCC cells (Fig. 2E-H). CRISPR-Cas9-mediated knockout of CIC also promoted HCC cell proliferation and invasion (Supporting Fig. S2). We confirmed these results in vivo using xenograft mouse models. Control and shCIC-expressing SK-HEP-1 or MHCC-97H cells were subcutaneously injected into either posterior flank of the same nude mice, respectively, and the tumor volume was measured every week. The CIC-deficient HCC cells grew more rapidly and formed larger tumor mass than control cells (Fig. 3A). To compare metastatic activity between control and CIC-deficient HCC cells, the cells were intravenously injected into nude mice, followed by quantification of green fluorescent protein signal, which is expressed from short hairpin RNA–expressing lentiviral vectors (pGIPZ), in lung tissues. The CIC-deficient HCC cells had a higher degree and frequency of metastasis to lung than control cells (Fig. 3B,C). Taken together, these findings indicate that CIC functions as a negative regulator in HCC progression.
INCREASED LUNG METASTASIS AND LETHALITY IN Cic-DEFICIENT MICE TREATED WITH DEN
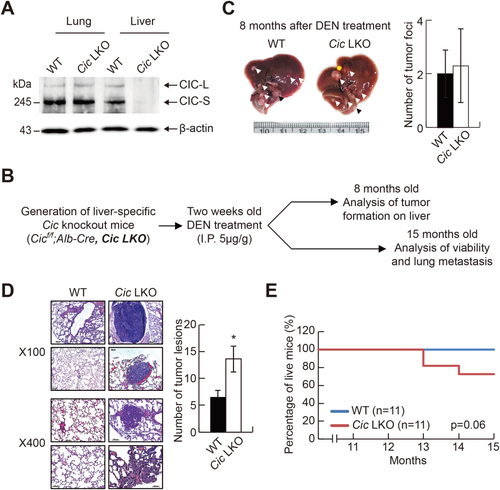
To better understand the in vivo effect of CIC deficiency on HCC progression, we generated mice with a specific deletion of Cic alleles in hepatocytes (Cicf/f;Alb-Cre, Cic liver-specific knockout [LKO]) (Fig. 4A) and induced liver cancer in these mice by treatment with DEN. Wild-type (WT; Cicf/f) and Cic LKO mice were intraperitoneally injected with DEN at 2 weeks of age and subjected to analyses of tumorigenesis, lung metastasis, and viability (Fig. 4B). Tumor formation on liver tissues was comparable between WT and Cic LKO mice at 8 months of age (Fig. 4C). However, lung metastasis was substantially increased in Cic LKO mice at 15 months of age (Fig. 4D). Moreover, about 30% of Cic LKO mice died after 1 year of age, whereas none of the WT mice did (Fig. 4E). These results demonstrate that reduction in CIC expression can critically contribute to the promotion of HCC progression, which is consistent with the finding that the survival rate was decreased in HCC patients with low levels of CIC (Fig. 1B).
ETV4 IS A CRITICAL CIC TARGET THAT PROMOTES HCC PROGRESSION
Many studies have shown that PEA3 group genes, which include ETV1, ETV4, and ETV5, are direct target genes of CIC14, 19, 25, 26 and that overexpression of these genes promotes proliferation and invasion of various types of cancer cell.33 However, the role of PEA3 group transcription factors in HCC progression has not yet been comprehensively understood. Therefore, we analyzed expression profiles of PEA3 group genes and association of these gene expression levels with lethality in patients with HCC using the TCGA database (Supporting Tables S1 and S4). Among three genes, only ETV4 levels were increased in all stages of HCC cells with statistical significance compared with normal liver cells (Fig. 5A). On the other hand, overall survival rates of HCC patients were inversely correlated with the levels of all PEA3 group genes (Fig. 5B), suggesting that PEA3 group transcription factors might also function as a tumor promoter in the context of HCC progression.
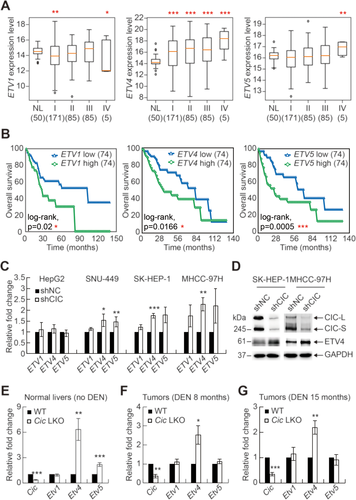
Next, we examined whether CIC regulates expression of PEA3 group genes in HCC cells. The levels of PEA3 group genes in control and shCIC-expressing HCC cells were determined by quantitative RT-PCR analysis (Fig. 5C). Among three genes, ETV4 levels were most significantly up-regulated in three different HCC cell lines with CIC RNA interference (Fig. 5C). Knockdown of CIC did not increase levels of PEA3 group genes in HepG2 cells (Fig. 5C), suggesting that CIC differentially regulates its target gene expression in a cell type–dependent manner, which is consistent with previous findings.27, 35, 39 Furthermore, the up-regulation of ETV4 expression in CIC knockdown HCC cells was confirmed at the protein level (Fig. 5D). Increases in Etv4 levels were also most apparent in both normal liver and DEN-induced tumor tissues from Cic LKO mice compared with those in Etv1 and Etv5 (Fig. 5E-G). Overall, these data suggest that, among PEA3 group genes, ETV4 is a major target gene of CIC in hepatic cells.
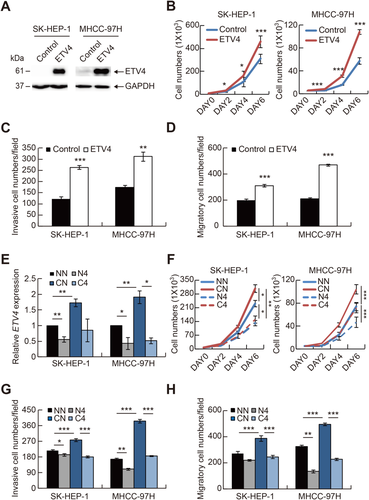
Given that ETV4 had the highest relevance to HCC progression (Fig. 5A,B) and that ETV4 expression was most significantly regulated by CIC in HCC cells (Fig. 5C), we focused on the role of ETV4 in HCC progression. We first tested whether ETV4 has HCC-promoting activity. Overexpression of ETV4 indeed increased cell proliferation, invasion, and migration in HCC cells (Fig. 6A-D; Supporting Fig. S3). We next examined whether the increased cell proliferation, invasion, and migration in CIC-deficient HCC cells were due to derepression of ETV4. Knockdown of ETV4 completely blocked the CIC deficiency–mediated promotion of HCC progression (Fig. 6E-H), demonstrating that ETV4 is a key target gene of CIC in the regulation of HCC progression.
REGULATION OF MMP1 EXPRESSION BY THE CIC–ETV4 AXIS IN HCC CELLS
MMPs promote cancer progression in various ways, including destruction of extracellular matrix, activation of growth factors, suppression of apoptosis, and induction of angiogenesis.40 Therefore, MMPs are the principal mediators of cancer progression and are frequently used as biomarkers for various types of cancer. There are 23 members of the MMP family in humans. Studies have revealed that PEA3 group transcription factors activate expression of various MMP genes and that most MMP genes harbor ETS binding elements in their promoters.26, 41 To gain insight on which MMPs are critically involved in HCC progression, we analyzed the relevance of each MMP to HCC progression using the TCGA database (Supporting Tables S1 and S5), as we did for CIC and PEA3 group genes. Among 23 MMP genes, levels of MMP1, MMP9, MMP10, MMP11, MMP12, and MMP14 were significantly higher in HCC tissues than in normal liver tissues (Fig. 7A; Supporting Fig. S4). Analysis of survival rates revealed that levels of MMP1, MMP7, MMP10, MMP12, MMP16, and MMP26 were inversely correlated with survival rates of HCC patients with statistical significance (Fig. 7B; Supporting Fig. S5). Thus, these analyses identified MMP1, MMP10, and MMP12 as MMP genes strongly associated with the promotion of HCC progression.
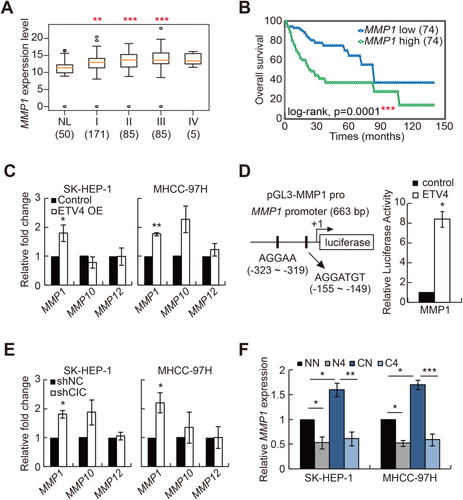
Next, we investigated which of the selected MMP genes are regulated by the CIC–ETV4 axis in HCC cells. Among MMP1, MMP10, and MMP12, only MMP1 expression was significantly induced by ETV4 overexpression in both SK-HEP-1 and MHCC-97H HCC cell lines (Fig. 7C). We confirmed that ETV4 enhances MMP1 promoter activity by luciferase assay using an MMP1 promoter–containing reporter construct (Fig. 7D). We further examined the regulation of MMP1 expression by CIC in HCC cells. Knockdown of CIC significantly up-regulated levels of MMP1, but neither MMP10 nor MMP12, in SK-HEP-1 and MHCC-97H HCC cell lines (Fig. 7E). Consistent with this result, overexpression of CIC down-regulated MMP1 expression (Supporting Fig. S6). On the other hand, expression of MMP13, which belongs to the interstitial collagenase family as MMP1 does and shares high amino acid identity (86%) with MMP1,42 was not significantly affected by either ETV4 overexpression or CIC RNA interference in HCC cells (Supporting Fig. S7), suggesting that the CIC–ETV4 axis might selectively regulate expression of MMP1 rather than all members of the MMP subfamily with similar biochemical and pathological properties. Levels of Mmp1a, a mouse homolog of human MMP1, were also up-regulated in liver tumors from 15-month-old Cic LKO mice treated with DEN compared to those from WT controls, while levels of other Mmp genes including Mmp2, Mmp9, and Mmp12, which have been implicated in the promotion of HCC progression,43, 44 were comparable (Supporting Fig. S8). Overall, these results suggest that MMP1 might be a key effector MMP protein that functions downstream of the CIC–ETV4 axis in the context of HCC progression.
To directly address whether the increased expression of MMP1 in CIC-deficient HCC cells was due to derepression of ETV4, we examined levels of MMP1 in control and shCIC-expressing HCC cells treated with either control small interfering RNA (siRNA) or siRNA against ETV4. Knockdown of ETV4 certainly restored MMP1 expression to the normal level in CIC-deficient HCC cells (Fig. 7F). Taken together, these data suggest that MMP1 expression can be regulated by the CIC–ETV4 axis in the process of HCC progression.
CIC DEFICIENCY PROMOTES HCC PROGRESSION THROUGH MMP1 OVEREXPRESSION
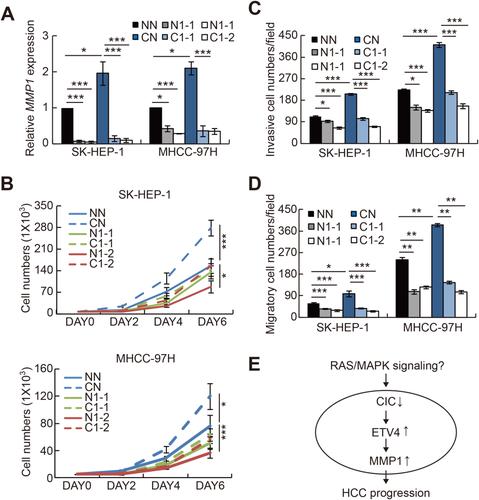
Because we identified MMP1 as a critical downstream target gene of the CIC–ETV4 axis in HCC cells, we finally determined whether the induction of MMP1 expression contributed to the enhanced cancer progression in CIC-deficient HCC cells. We transfected control and shCIC-expressing HCC cells with either control siRNA or two different siRNAs against MMP1 and examined cell proliferation, invasion, and migration. Knockdown of MMP1 completely suppressed the increased cell proliferation and invasive and migratory activity in shCIC-expressing HCC cells (Fig. 8A-D), demonstrating that increased expression of MMP1 indeed critically contributed to the CIC deficiency–mediated promotion of HCC progression.
Discussion
In this study, we demonstrate that CIC could function as a negative regulator of HCC progression through control of the ETV4–MMP1 axis (Fig. 8E). Overexpression of CIC suppressed HCC cell proliferation and invasion, whereas CIC deficiency promoted HCC progression in vivo as well as in vitro. We found a discrepancy between CIC-deficient HCC cells and DEN-induced HCC in liver-specific Cic null mice; CIC-deficient HCC cells had increased proliferative and invasive activity, while DEN-treated Cic-deficient mice exhibited enhanced lung metastasis but not tumor formation in livers. This finding implies that loss of CIC might not be enough to facilitate the onset of HCC but nevertheless could contribute to the promotion of HCC progression once HCC has occurred.
Analyses of the TCGA database and tissue samples from patients with HCC revealed that CIC expression is reduced in HCC cells at the protein level but not at the mRNA level. These results suggest that HCC-promoting factors and/or signaling pathways might down-regulate CIC expression in HCC cells at the posttranscriptional level. It is well known that activation of RTK signaling suppresses CIC activity through degradation or cytoplasmic translocation of CIC in Drosophila and mammals.13, 20, 21, 25 In this process, extracellular signal–regulated kinase (ERK), a downstream effector kinase of RTK signaling pathways, plays a pivotal role. ERK can interact with CIC,45 and the inhibition of ERK rescues CIC activity in the context of epidermal growth factor receptor activation.21 These findings suggest that activation of ERK and its upstream signaling cascades might be involved in the down-regulation of CIC protein levels. Many studies have demonstrated that the RAS/RAF/MEK/ERK signaling pathway is associated with HCC pathogenesis.46, 47 Levels of total or phosphorylated ERK are often higher in HCC cells than in normal liver cells.48, 49 Moreover, it was reported that ERK is mainly found in the nucleus of HCC cells.46 Therefore, it would be conceivable that the decrease in CIC levels in HCC cells was due to the enhanced ERK activity (Fig. 8E).
Our study demonstrates the relevance of MMP1 to HCC progression. In the context of HCC, the functional significance of other MMPs, such as MMP2, MMP9, and MMP12, has been more appreciated than that of MMP1.43, 44 However, our comprehensive analyses for MMP genes in HCC patients using the TCGA data sets indicated that MMP1 is more significantly associated with HCC pathogenesis than other MMPs previously recognized to promote HCC progression. The in vitro experiments using HCC cell lines showed that MMP1 deficiency is sufficient to suppress HCC cell growth and invasion, underlying the critical role of MMP1 in HCC progression. We also provide evidence that MMP1 is a critical downstream target of the CIC–ETV4 axis that contributes to the CIC deficiency–mediated promotion of HCC progression. MMP1 expression is under the control of ETV4, and knockdown of MMP1 completely blocks the increased cell proliferation and invasion in CIC-deficient HCC cells. Nevertheless, it cannot be ruled out that other MMPs could also contribute to the enhanced cell proliferation and invasion in CIC-deficient HCC cells because most MMP genes have ETS binding elements in their promoters.26 To better understand the molecular mechanism underlying the CIC deficiency–mediated promotion of HCC progression, genome-wide identification of target genes of CIC as well as ETV4 and studies on their roles in HCC pathogenesis need to be followed.
This study suggests that the CIC–ETV4–MMP1 axis is a genetic module that controls HCC progression. Patients with HCC have a poor survival rate, mainly due to late diagnosis.50 Therefore, it is very important to identify genetic alterations that can predict HCC development and progression as early as possible. In this regard, our findings provide novel candidate molecules that might be potentially developed as diagnostic markers and as therapeutic targets for HCC.
Acknowledgment
We thank the Lee lab members for helpful discussion and comments on this study. Human HCC (HepG2, Hep3B, SH-J1, Huh 7, SNU-449, SNU-475, and SK-HEP-1) and THLE2 cells were kindly provided by Dr. Kwanyong Choi (POSTECH, Korea). MHCC-97L, MHCC-97H, and HCC-LM3 cells were kindly provided by Dr. Paula Y.P. Lam (National Cancer Centre Singapore, Singapore).
REFERENCES
Author names in bold designate shared co-first authorship.


