Significance and mechanism of androgen receptor overexpression and androgen receptor/mechanistic target of rapamycin cross-talk in hepatocellular carcinoma
Potential conflict of interest: Nothing to report.
Supported by the National Institutes of Health (R01CA173519), the National Natural Science Foundation of China (nos.: 81572440, 81372564, 81730081, and 81372600), the Recruitment Program of Global Experts, the Leading Talent of Guangdong Province, the Natural Science Foundation of Guangdong Province for Distinguished Young Scholar (no.: 2015A030306047), and the Research Fund of State Key Laboratory of Oncology in South China.
Key raw data were verified and uploaded onto the Research Data Deposit platform (www.researchdata.org.cn) with an approval number RDD2018000244.
Abstract
Hepatocellular carcinoma (HCC) is a male-dominant cancer, and androgen receptor (AR) has been linked to the pathogenesis of HCC. However, AR expression and its precise role in HCC remain controversial. Moreover, previous antiandrogen and anti-AR clinical trials in HCC failed to demonstrate clinical benefits. In this study, we found that AR is overexpressed in the nucleus of approximately 37% of HCC tumors, which is significantly associated with advanced disease stage and poor survival. AR overexpression in HCC cells markedly alters AR-dependent transcriptome, stimulates oncogenic growth, and determines therapeutic response to enzalutamide, a second generation of AR antagonist. However, AR inhibition evokes feedback activation of AKT-mTOR (mechanistic target of rapamycin) signaling, a central regulator for cell growth and survival. On the other hand, mTOR promotes nuclear AR protein expression by restraining ubiquitin-dependent AR degradation and enhancing AR nuclear localization, providing a mechanistic explanation for nuclear AR overexpression in HCC. Finally, cotargeting AR and mTOR shows significant synergistic anti-HCC activity and decreases tumor burden by inducing apoptosis in vivo. Conclusion: Nuclear AR overexpression is associated with the progression and prognosis of HCC. However, enzalutamide alone has limited therapeutic utility attributed to feedback activation of the AKT-mTOR pathway. Moreover, mTOR drives nuclear AR overexpression. Cotargeting AR and mTOR is a promising therapeutic strategy for HCC. (Hepatology 2018;67:2271-2286).
Abbreviations
-
- AKT
-
- protein kinase B
-
- ANOVA
-
- analysis of variance
-
- AR
-
- androgen receptor
-
- AREs, ARE
-
- androgen response elements
-
- CHX
-
- cycloheximide
-
- CI
-
- combination index
-
- ERK
-
- extracellular signal-regulated kinase
-
- FDA
-
- U.S. Food and Drug Administration
-
- FBS
-
- fetal bovine serum
-
- FKBP5
-
- FK506 binding protein 5
-
- HBV
-
- hepatitis B virus
-
- HCC
-
- hepatocellular carcinoma
-
- HCG
-
- hepatocarcinogenesis
-
- IC50
-
- half maximal inhibitory concentration
-
- IF
-
- immunofluorescence
-
- IGF1
-
- insulin-like growth factor 1
-
- IHC
-
- immunohistochemistry
-
- LT
-
- liver transplantation
-
- mTOR
-
- mechanistic target of rapamycin
-
- OS
-
- overall survival
-
- PHLPP
-
- PH domain leucine-rich repeat protein phosphatase
-
- PI3K
-
- phosphatidylinositol-3 kinase
-
- S6K1
-
- S6 kinase 1
-
- siRNA
-
- small interfering RNA
-
- TNM
-
- tumor, node, and metastasis
-
- TUNEL
-
- terminal deoxynucleotidyl transferase dUTP nick end labeling
Hepatocellular carcinoma (HCC) is the predominant form of liver cancer.1 It is one of the most common malignancies worldwide and a leading cause of cancer-related death, with 782,500 new cases and 745,500 deaths worldwide in 2012.2, 3 HCC is most prevalent in Eastern Asian and Sub-Saharan African countries because of chronic hepatitis B virus (HBV) infections.2, 3 Despite the downward trend in the overall cancer incidence and cancer-related mortality in developed countries, HCC has seen a significant increase in both HCC incidence and death.4 The mortality rate for liver cancer nearly doubled in the United States from 1980 to 2014, which is in sharp contrast to the 20% decrease in overall cancer-related death during the same period.5 Conventional treatments for early HCCs include surgery, transcatheter arterial chemoembolization and liver transplantation (LT). Surgery and LT can be curative for ∼30% of early-stage patients.6 Unfortunately, most HCC cases are diagnosed at unresectable advanced stages. Sorafenib has been the only systemic drug for advanced HCC until the recent approval of regorafinib, another multikinase inhibitor. Both sorafenib and regorafinib have a low durable response rate and survival benefit, with a median increase in overall survival (OS) by only 2-3 months.7, 8 New systemic drugs and therapeutic strategies are urgently needed to improve the clinical outcome of HCC.
Androgen receptor (AR) is a member of the steroid hormone receptor superfamily. In response to stimulation by androgens such as testosterone, AR translocates into the nucleus where it binds to androgen response elements (AREs) and regulates cell growth and survival genes.9 AR plays a critical role in the development and progression of prostate cancer, a malignancy in the male reproductive system.9 HCC exhibits a significant sex preference, with a male-to-female ratio of 2:1 to 7:1 as surveyed.2 Accumulating evidences has linked AR as the male-dominant trait of liver cancer.10, 11 AR promotes HBV viral RNA expression,12, 13 suggesting that it plays a role in HBV-driven hepatocarcinogenesis (HCG). AR knockout in mice reduces the number and burden of carcinogen-induced liver tumors,14 indicating that AR is necessary for full cancer development in this animal model. Because prostate cancer is dependent on AR in all stages of the disease, AR antagonists have been developed for AR-targeted therapy. Bicalutamide is a first-generation AR inhibitor. Enzalutamide is a second-generation AR inhibitor that was approved by the U.S. Food and Drug Administration (FDA) for prostate cancer in 2012.15 It is structurally related to bicalutamide with improved affinity and potency and inhibits certain bicalutamide-resistant AR mutants. Unfortunately, early clinical trials on antiandrogen and bicalutamide therapies in liver cancer met with disappointing results, producing no apparent clinical benefits.16, 17
Mechanistic target of rapamycin (mTOR) protein is a key member of the phosphatidylinositol-3 kinase (PI3K)/proteon kinase B (AKT)/mTOR signaling pathway that is frequently hyperactivated in many human malignancies, driving oncogenic growth and proliferation.18 In response to mitogenic stimuli by growth factors and nutrients, mTOR promotes protein synthesis and ribosome biogenesis.19 mTOR is an established cancer therapeutic target: The macrolide rapamycin and rapamycin analogs, everolimus and temsirolimus, are FDA-approved drugs for advanced breast, renal, and neuroendocrine tumors. Hyperactive AKT-mTOR signaling is a common phenomenon in HCC.20, 21 Activation of AKT and mTOR is critical for HCG in various common HCC models in mice.22-25 However, a recent clinical trial did not achieve desirable endpoints on the rapamycin analog, everolimus, in advanced HCC patients.26, 27 Therefore, identifying new treatment strategies, such as combination therapy, is necessary for improving the efficacy of rapamycin and rapamycin analogs in order to bring mTOR-targeted therapies into the clinic.
Newer AR inhibitors, such as enzalutamide, have improved specificity and potency, leading to renewed enthusiasm to explore the utility of anti-AR therapeutics in HCC. A human trial has recently been initiated on enzalutamide without or with sorafenib for treatment of advanced HCC patients (NCT02642913). However, it remains unresolved why bicalutamide failed earlier HCC clinical trials. In order to evaluate the clinical potential of AR targeting and provide guidance to current and future trials, it will be necessary to fully understand the mechanism of AR signaling and anti-AR therapeutic response in HCC. To this end, we investigated the significance and mechanism of AR overexpression and AR-mTOR cross-talk in HCC and their roles in AR-targeted therapy. Our results indicate that AR expression and feedback activation of AKT-mTOR signaling are major factors for enzalutamide treatment response, and that combination of AR and mTOR inhibitors is a promising therapeutic strategy for HCC.
Materials and Methods
HUMAN HCC PATIENTS AND TISSUE SAMPLES
One hundred forty-two clinical tissue samples of HCC were collected from HCC patients who underwent hepatic resection from January 2004 to August 2012 at the Sun Yat-Sen University Cancer Center. All the cases were diagnosed by pathological examination. The median follow-up is 48 months (range, 4-111). None of the patients received chemotherapy or radiotherapy treatment before surgery. Demographic and clinicopathological parameters of HCC patients are listed in Supporting Table S1. This study was reviewed and approved by the ethics committees of Sun Yat-Sen University Cancer Center. Informed consents signed by the patients were collected. An HCC transcriptome data set available from the Oncomine cancer microarray database (https://www.oncomine.org/) was used to analyze AR mRNA and AR target gene expression. This data set contains mRNA expression information of 10,802 genes from 104 human primary HCC tumors and 76 adjacent non-tumor liver tissues, of which 93 tumors are HBV+.28 We analyzed the mRNA expression of AR and AR target genes using the Student's t test. HCC proteomic data derived from 184 primary human HCC tumors (113 white Americans, 52 Asian Americans, and 12 black Americans) were downloaded from The Cancer Proteome Atlas (http://tcpaportal.org/tcpa/).29 Normalized phosphoprotein levels of AKT (S473) and phospho-p70S6K (T389) were used to represent AKT-mTOR signaling. The correlation between the level of AR protein and p-AKT(473) or p-p70S6K(389) was analyzed using Pearson's correlation test as described.30
ANIMAL STUDIES
Mouse procedures and protocols were approved by the Institutional Animal Care and Use Committee of Sun Yat-Sen University. For xenograft tumor formation assay, male BALB/c athymic nude mice aged 4 weeks were injected with 2 × 10⁶ MHCC-97L of tumor cells in 0.1 mL of phosphate-buffered saline subcutaneously into the flank of each mouse. When average tumor volume reached 300 mm3, tumor-bearing animals were randomized and treatment was initiated. Enzalutamide (10 mg/kg) was solubilized in 100 μL of critical micellar concentration Na+ 1%/Tween-80 1% and administered intragastrically daily. Rapamycin (10 mg/kg) was dissolved in 100 μL of 30% polyethylene glycol 300 and 5% Tween-80 and given intraperitoneally daily for 7 consecutive days, followed by 2 days without drug. Enzalutamide and rapamycin were freshly prepared daily just before administration. The control group was given the vehicle used for administration. Tumors were measured every 3 days and tumor volumes were calculated from the formula: Tumor volume = Length × Width2 × (Л /6). After mice were euthanized, xenograft tumors were collected and fixed in formalin and embedded in paraffin block. The synergism of enzalutamide and rapamycin was calculated using the Chou-Talalay method with Calcusyn software (Biosoft, Cambridge, UK). A combination index (CI) less than 1 indicates the drug combination has synergism. The results show that the CI value for the combination of the two drugs is 0.28, indicating that they have synergistic effect.
STATISTICAL ANALYSIS
Statistical data analysis was performed by SPSS (version 11.0; SPSS, Inc., Chicago, IL) and GraphPad Prism software (version 5.0 for windows; GraphPad Prism Inc., San Diego, CA). Experimental data are expressed as mean ± SD. Receiver operating characteristic curve analysis was used to estimate the cut-off value for high and low AR expression in HCC patients. Kaplan-Meier plots and log-rank test were performed to compare cancer-specific survival rates between patients with high and low AR expression. Univariate and multivariate survival analyses were performed using a Cox proportional hazards regression model. Repeated-measures analysis of variance (ANOVA) was performed to analyze xenograft tumor size and proliferation of cultured cells. One-way ANOVA test and Student's t test were conducted to evaluate the variables of different groups. A paired t test was used to analyze xenograft tumor size and immunostaining scores of AR in paired clinical samples. A nonparametric Spearman correlation test was used to compare the correlation between AR expression and enzalutamide half maximal inhibitory concentration (IC50) values. P < 0.05 was considered as statistical significant (indicated in corresponding figures with one asterisk for P < 0.05, two asterisks for P < 0.01 and three asterisks for P < 0.001).
For additional materials and methods, see the Supporting Information.
Results
AR IS OVEREXPRESSED IN HCC, WHICH IS ASSOCIATED WITH DISEASE PROGRESSION AND IS AN INDEPENDENT PREDICTOR OF OS
Although there were several studies on AR mRNA or protein expression in human HCCs, the results and clinical significance were contradictory.31, 32 Limiting factors include small sample sizes and nonpaired tumor/normal tissues and the use of radiolabeled ligands to detect AR in tissues. We analyzed an HCC gene expression data set available in Oncomine from a transcriptome study of 104 primary HCC and 76 normal liver tissues,28 which shows that AR mRNA expression is highly variable in tumors, but not in normal liver tissues (Fig. 1A). Overall, AR mRNA level is higher in tumors. To verify this finding, we examined AR protein expression by immunohistochemistry (IHC) in a cohort of 142 paired human HCCs and adjacent noncancerous liver tissues. AR is expressed in both normal hepatocytes and tumor cells with predominant nuclear localization (Fig. 1B), indicating that AR is largely in the activated form. Nuclear AR protein is significantly overexpressed in tumors compared to the adjacent noncancerous liver tissues (P < 0.001; Fig. 1C), with 37% (53 of 142) cases with 2-fold or higher nuclear AR in tumors (Fig. 1C, lower panel). In contrast, there is no significant difference in cytoplasmic AR expression between tumor and adjacent liver tissues (Fig. 1D).
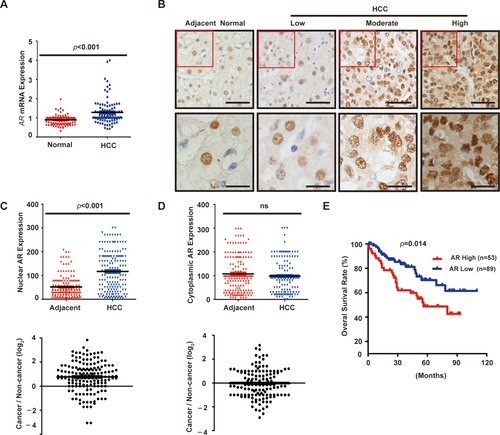
We next examined the relationship between nuclear AR protein expression and clinicopathological parameters. Advanced tumor, node, and metastasis (TNM) stage, multiple tumor nodules, and high HBV viral copies were positively correlated with high nuclear AR expression (Supporting Table S2), indicating that AR is associated with HCC disease progression. There was no statistically significant correlation between AR protein expression and age, sex, tumor size and grade, hepatitis B surface antigen, and alpha-fetoprotein (Supporting Table S2). Kaplan-Meier analysis demonstrates that high nuclear AR staining was significantly correlated with poorer OS of HCC patients (P < 0.001; Fig. 1E). Furthermore, multivariate analysis shows that nuclear AR overexpression in tumors is an independent predictor for poor OS (hazard ratio = 2.423; 95% confidence interval = 1.053-5.577; P = 0.037; Supporting Table S2). These results indicate that nuclear AR protein is highly expressed in a subset of HCC tumors characteristic of advanced disease stage and poor prognosis.
AR OVEREXPRESSION ALTERS AR-DEPENDENT TRANSCRIPTOME IN HCC
We also examined AR protein expression in a panel of immortalized hepatocyte and HCC cell lines. Compared with the immortalized LO2 hepatocyte cell line, AR is significantly higher in SNU423 and SNU387 cells and moderately higher in BEL7402 and MHCC-97L cells (Fig. 2A). Immunofluorescence (IF) staining indicates that AR is primarily localized in the nucleus of these HCC cells (Fig. 2B). These results indicate that HCC cell lines share the same heterogeneity in AR expression as primary liver tumors, and that they are useful in vitro models for studying AR functions. AR is a transcription factor that regulates expression of genes with diverse functions, especially those related to cell growth in prostate cancer.33, 34 Therefore, we investigated the transcriptional function of AR in HCC using a luciferase reporter driven by an ARE. Treatment of SNU423 and MHCC-97L cells with testosterone stimulates AR reporter activity in these AR-positive HCC cells (Fig. 2C), demonstrating that AR regulates target gene expression in HCC cells.
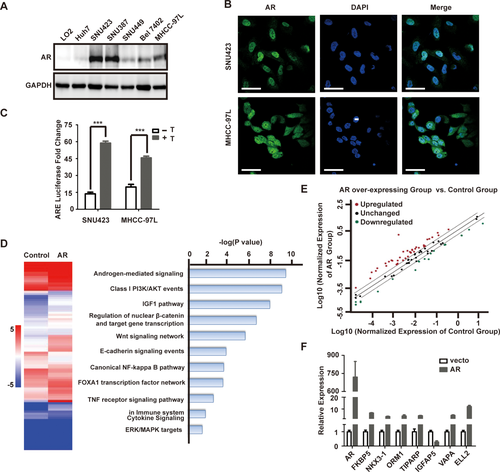
To assess the transcriptional function of AR in HCC, we overexpressed AR in SNU449 cells (Supporting Fig. S1), a cell line with relatively low AR level. The global transcriptional effect of AR overexpression was examined using the Human Androgen Receptor Signaling Targets PCR Array that consists of 84 key AR target genes (Qiagen, Valencia, CA). AR overexpression leads to up-regulation of 38 AR target genes and down-regulation of 18 AR target genes by >2-fold (Fig. 2D,E), representing 67% key AR target genes. Analysis of eight randomly selected AR target genes by qRT-PCR verified the AR target gene PCR array results (Fig. 2F). Significantly altered AR target genes were enriched in Androgen, PI3K, insulin-like growth factor 1 (IGF1), and Wnt and β-catenin signaling (Fig. 2D), pathways well known for their crucial role in liver cancer cell proliferation and survival, which is consistent with a tumor-promoting role of AR overexpression in HCC. In the same HCC transcriptome data set,28 expression of AR target genes was significantly altered. For example, APPBP2, Rab4A, SMS, ZNF189, SLC26A2, and TPD52, which were up-regulated by AR overexpression (Supporting Table S3), were significantly overexpressed in primary HCC samples compared to adjacent non-tumor liver tissues (Supporting Fig. S3). Similarly, VIPR1, MME, and TMPRSS2, which were down-regulated by AR (Supporting Table S3), were underexpressed in primary HCC tumor samples compared to adjacent non-tumor liver tissues (Supporting Fig. S3). Together, these results support the notion that AR pathway is activated in human primary HCCs.
AR OVEREXPRESSION RENDERS AR-DEPENDENT AND ENZALUTAMIDE-SENSITIVE GROWTH OF HCC CELLS
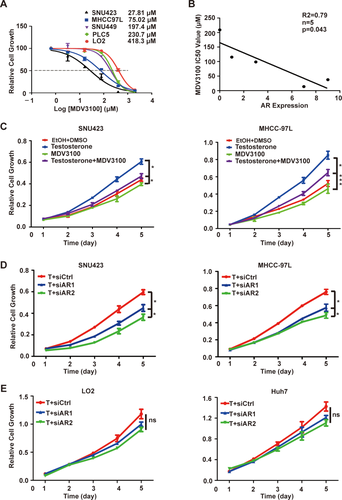
To investigate the role of AR in HCC growth, we treated a panel of immortalized liver and HCC cell lines with enzalutamide (MDV3100). The IC50 for enzalutamide was highly variable, ranging from 27.8 to 418.3 μM (Fig. 3A). There was a striking inverse relationship between AR protein expression and enzalutamide IC50 (R = 0.79; P < 0.043; Fig. 3B), indicating that the growth of HCC cells with high AR expression is more AR dependent and hence more sensitive to AR blockage. Consistently, enzalutamide blocks testosterone stimulated growth of SNU423 and MHCC97L cells (Fig. 3C). We further tested the effect of AR knockdown by small interfering RNA (siRNA; siAR). Four siARs were tested and found to produce significant AR knockdown (Supporting Fig. S1B). Two siARs were selected for further studies, resulting in more growth inhibition in high AR-expressing SNU423 and MHCC97L cells (Fig. 3D) than low AR-expressing LO2 and Huh7 cells (Fig. 3E). These results suggest that AR overexpression renders AR-dependent and enzalutamide-sensitive growth in HCC cells.
INHIBITION OF AR LEADS TO FEEDBACK ACTIVATION OF AKT-mTOR SIGNALING THROUGH FKBP5
The fact that AR blockage only produces a modest growth inhibition raises an interesting possibility of a feedback mechanism that limits the impact of AR loss. Indeed, AR knockdown in SNU423 and MHCC-97L cells leads to elevated phosphorylation of AKT, mTOR, and S6 kinase 1 (S6K1), indicating that AKT-mTOR pathway is activated (Fig. 4A and Supporting Fig. S3A). Similarly, pharmacological inhibition of AR by enzalutamide treatment also results in activation of AKT-mTOR signaling in SNU423 and MHCC97L cells (Fig. 4B and Supporting Fig. S3B). Moreover, AR inhibition by siRNA-mediated knockdown or enzalutamide results in increased phosphorylation of glycogen synthase kinase 3, a known AKT substrate.35 Thus, blockage of AR activity triggers feedback activation of AKT-mTOR signaling. In contrast, AR inhibition has little effect on c-MYC expression or extracellular signal-regulated kinase (ERK) phosphorylation (Supporting Fig. S3), suggesting that blockage of the AR pathway selectively activates AKT-mTOR signaling in HCC.
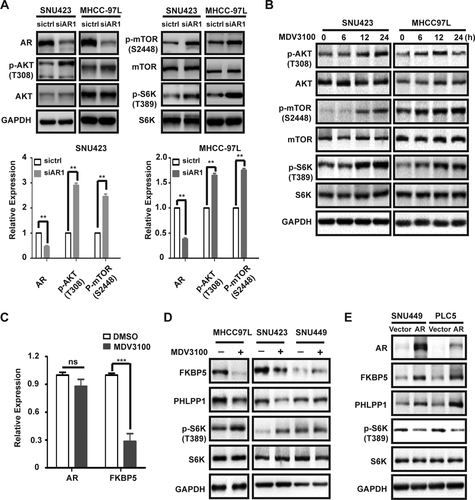
However, it takes 6-12 hours for AKT-mTOR signaling to become activated by enzalutamide (Fig. 4B), suggesting that the feedback mechanism involves a transcriptional mechanism. FK506 binding protein 5 (FKBP5) is an AR target gene in prostate cancer that is known to inhibit AKT activity by promoting AKT dephosphorylation through scaffolding AKT with PH domain leucine-rich repeat protein phosphatase (PHLPP), an AKT phosphatase.36-38 Interestingly, AR also promotes FKBP5 expression in HCC cells (Fig. 2F). Enzalutamide causes down-regulation of FKBP5 mRNA and protein expression in MHCC-97L and SNU423 cells (Fig. 4C,D). Curiously, the level of PHLPP1 is also decreased by enzalutamide (Fig. 4D), though the mechanism is currently not understood. In contrast, enzalutamide does not affect the expression of FKBP5 and PHLPP1 in the low AR-expressing SNU449 cell line (Fig. 4D). Moreover, ectopic AR expression in SNU449 and PLC5 cell lines stimulates FKBP5 and PHLPP1 expression, with concurrent suppression of AKT/mTOR signaling (Fig. 4E). These observations demonstrate that blockage of AR leads to activation of AKT-mTOR signaling, which is, at least in part, attributed to down-regulation of the AR target gene, FKBP5, and AKT phosphatase, PHLPP1.
mTOR PROMOTES AR TRANSCRIPTIONAL ACTIVITY BY ENHANCING AR STABILITY AND NUCLEAR LOCALIZATION
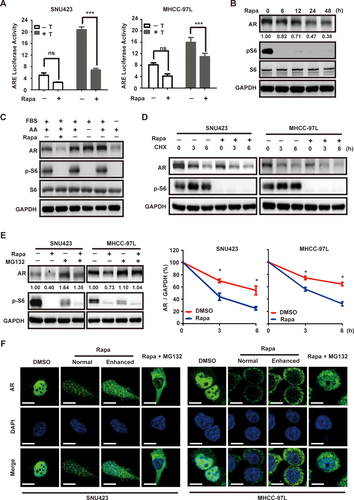
Inhibition of mTOR by rapamycin is known to stimulate AR transcriptional activity in prostate cancer.39 Surprisingly, however, we found that rapamycin treatment in MHCC-97L and SNU423 cells leads to marked inhibition of AR transcriptional activity under both basal and testosterone-stimulated conditions (Fig. 5A). Rapamycin treatment significantly decreases AR protein level (Fig. 5B). mTOR is regulated by both growth factors and amino acids. However, starvation from fetal bovine serum (FBS), not amino acids, causes AR down-regulation (Fig. 5C), indicating that regulation of AR by mTOR responds specifically to growth factor, not nutrient signaling. Under the condition when new protein synthesis is blocked by cycloheximide (CHX), AR is more rapidly degraded in rapamycin-treated cells than control cells (Fig. 5D), demonstrating that rapamycin accelerates AR degradation. Moreover, treatment with the proteasome inhibitor, MG132, abrogates rapamycin-induced AR degradation (Fig. 5E). Thus, mTOR negatively regulates the proteasome-dependent AR degradation in HCC. We have also examined AR localization by IF staining. As shown earlier, AR is predominantly localized in the nucleus in SNU423 and MHCC-97L cells. Consistent with proteasome-dependent degradation of AR, rapamycin treatment leads to a marked decrease in AR staining (Fig. 5F). Interestingly, AR becomes predominantly cytoplasmic in rapamycin-treated HCC cells (Fig. 5F). Rapamycin also inhibits AR nuclear localization in the presence of MG132. These results demonstrate that mTOR positively regulates both AR stability and nuclear localization.
COTARGETING AR AND mTOR SHOWS SYNERGISTIC ACTION AGAINST HCC AND REDUCES TUMOR BURDEN BY INDUCING APOPTOSIS IN VIVO
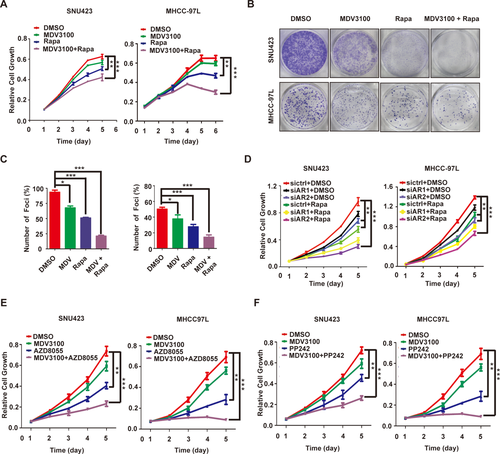
AR inhibition by enzalutamide or siRNA displays modest anticancer activity in HCC cells (Fig. 6A-D), which is, at least in part, attributed to the feedback activation of AKT-mTOR signaling (Fig. 4). We therefore explored the utility of combinating AR and mTOR inhibitors. Enzalutamide and rapamycin together indeed produce more potent inhibition of HCC cell growth and proliferation than each drug individually (Fig. 6A-C and Supporting Fig. S4). Moreover, the drug combination leads to a marked increase in apoptotic cell death (Supporting Fig. S5). A similar effect was observed with AR knockdown in the presence of rapamycin (Fig. 6D). mTOR kinase inhibitors target mTOR kinase domain and inhibit both mTORC1 and mTORC2.40 They exhibit excellent anticancer activity in preclinical models and are currently under clinical trials for various malignancies.40 We hence tested two mTOR kinase inhibitors, AZD8055 and PP242. Each agent significantly improves the anticancer activity of enzalutamide (Fig. 6E,F). These results indicate that combination of enzalutamide with rapamycin or mTOR kinase inhibitor yields more potent anti-HCC activity in vitro than each drug alone.
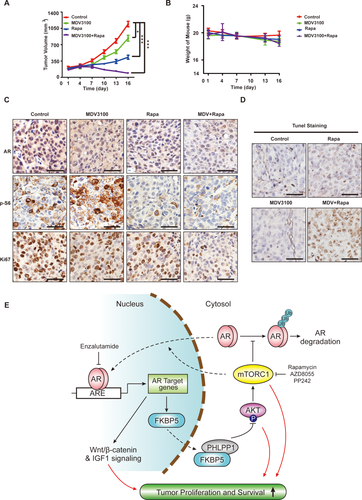
We next assessed the in vivo antitumor activity of enzalutamide alone or in combination with rapamycin in xenograft tumors derived from MHCC-97L cells. Enzalutamide alone has statistically significant, albeit modest, antitumor activity, whereas rapamycin alone is more potent, as measured by slower increase in tumor burden (Fig. 7A). Remarkably, combination of enzalutamide and rapamycin not only blunts tumor growth, but also significantly reduces tumor burden (Fig. 7A). No significant weight loss occurs in different treatment groups (Fig. 7B), indicating that each drug and their combination are well tolerated. As observed in vitro, rapamycin reduces AR protein expression, whereas enzalutamide causes mTOR activation as indicated by increased p-S6 staining (Fig. 7C). The drug combination much more potently inhibits tumor cell proliferation, as judged by Ki-67 staining (Fig. 7C and Supporting Fig. S6A). Consistent with the tumor burden reduction, the drug combination, not each drug individually, triggers elevated apoptosis, as judged by positive terminal deoxynucleotidyl transferase dUTP nick end labeling (TUNEL) staining (Fig. 7D and Supporting Fig. S6B). These results indicate that the combination of enzalutamide and rapamycin generates cytotoxic antitumor activity against HCC, which is much more robust in vivo than in vitro. A CI of enzalutamide and rapamycin, as calculated by the Chou-Talalay method using Calcusyn software (Biosoft), yielded a value of 0.28. A CI value of less than, equal to, and greater than 1 indicates that two drugs are synergistic, additive, and antagonistic, respectively. Our result demonstrates that enzalutamide and rapamycin have strong synergism against HCC.
Discussion
HCC is a male-dominant malignancy, and AR has been implicated to play a central role in this sex preference. AR regulates the transcription of HBV RNAs12, 13 and is necessary for full tumor development in carcinogen-induced HCC in mice.14 Studies on AR expression in HCC were controversial, which is likely attributable to the small sample sizes.32, 41, 42 Analysis of available microarray data revealed that AR mRNA is overexpressed in a subset of tumors. Consistently, in a cohort of 142 paired HCC tumors and adjacent noncancerous liver tissues, nuclear AR protein is significantly overexpressed in approximately one third of the HCC tumors. Importantly, AR overexpression is strongly correlated with advanced tumor stages and poor survival. AR regulates a large panel of genes important for cellular growth, proliferation, and survival in prostate cancer.14 Here, we show that AR overexpression significantly alters 67% of the key AR target genes in HCC cells and promotes oncogenic growth and proliferation. Similarly, the expression of AR target genes is also considerably altered in primary human HCC tissues (Supporting Fig. S2). Together with the studies in AR knockout mouse models, these observations indicate that AR also has a broad oncogenic role in HCC.
We found that mTOR positively regulates AR transcriptional activity in HCC. This is in contrast to prostate cancer in which mTOR inhibits AR.39 It will be an interesting future direction to investigate how mTOR-AR cross-talk is differentially wired in the two different cancer types. mTOR promotes AR function through at least two distinct mechanisms: mTOR enhances the stability of AR protein by antagonizing proteasome-dependent AR degradation and AR nuclear localization. mTOR is commonly activated in human HCC.20, 21 This is predicted to promote elevated nuclear AR protein level as a result of stabilized AR protein and AR nuclear localization. Moreover, AR positively regulates its own expression,43 mTOR-dependent increase in AR protein stability and nuclear localization will further enhance AR level. Indeed, analysis of a TCGA Proteomic Dataset indicates a positive correlation between AKT-mTOR signaling and AR protein expression in a cohort of 184 human primary HCC tumors (Supporting Fig. S7). The frequent activation mTOR signaling provides a plausible molecular mechanism for nuclear AR overexpression in HCC.
Given the male-dominant nature of HCC and clinical success of castration and AR inhibitors in prostate cancer, anti-androgen and anti-AR as a therapeutic strategy was explored in HCC. However, the results from these clinical trials have been disappointing.16, 44 We found that only one third of HCC tumors significantly express AR, and our evidence suggests that only these tumors respond to AR inhibition. Therefore, lack of biomarker-guided patient selection is likely an explanation for the previous poor trial results. Moreover, AR inhibition leads to feedback activation of AKT-mTOR signaling, a mechanism also observed in prostate cancer,36, 37, 45 which should also limit the effectiveness of anti-AR therapy. We found that FKBP5 is an AR target gene in HCC and inhibition of AR leads to down-regulation of FKBP5 expression, which leads to feedback activation of AKT-mTOR signaling.
Inhibition of AR leads to feedback activation of AKT-mTOR signaling. Because mTOR is an oncogenic driver and mTOR positively regulates AR, we explored the utility of cotargeting AR and mTOR as a therapeutic strategy in preclinical HCC models. Indeed, enalutamide and rapamycin together yielded stronger anti-HCC activity than each drug alone in vitro and in vivo. Interestingly, the combination of enzalutamide and rapamycin exhibits more potent antitumor activity in the xenograft tumor model than cultured cancer cells, causing elevated apoptotic cell death and tumor regression, a phenomenon not observed in vitro. This observation suggests that AR and mTOR pathways together are essential for HCC cell survival under the in vivo tumor microenvironment. Both enzalutamide and rapamycin are FDA-approved oncology drugs, and their combination is well tolerated in mice. This drug combination has the potential to improve HCC therapy for this difficult-to-treat cancer.
Acknowledgments
We thank Dr. Bin He for providing AR-expressing lentiviral plasmid and Dr. Xianzi Yang for assistance with IHC and illustration.
REFERENCES
Author names in bold designate shared co-first authorship.


