Biases in the reporting of hepatocellular carcinoma tumor sizes on the liver transplant waiting list
Potential conflict of interest: Nothing to report.
Supported by the UCSF Liver Center (P30 DK026743) and the National Center for Advancing Translational Sciences, National Institutes of Health (UCSF-CTSI grant TL1TR000144). Its contents are solely the responsibility of the authors and do not necessarily represent the official views of the National Institutes of Health.
Abstract
We investigated the possibility that patients with hepatocellular carcinoma (HCC) listed for liver transplant with tumors just outside stage T2 size criteria may be inaccurately reported as just meeting the tumor size criteria for transplant. The United Network for Organ Sharing/Standard Transplant Analysis and Research database identified 12,958 patients listed for liver transplants with HCC exception points from 2006 to 2013, 9,168 of whom were listed with one tumor. A logistic power peak function was fitted to the single-tumor size histogram, with the fitted values representing unbiased expected values. The difference between the observed and expected tumor counts for 2.0 cm and 5.0 cm was 238 (22%) and 66 (57%), respectively. This suggests that up to 304 (3.0%) patients with tumors outside of transplant criteria had their measurements recorded at the margins of eligibility. A risk-adjusted Poisson model evaluated the ratio of observed to expected HCC recurrence by tumor size. There were 435 HCC recurrences among 6,049 transplants. Only 2.0-cm tumors had observed to expected recurrence differing from 1 (ratio 0.73, 95% confidence interval 0.57-0.94), indicating a 27% lower than expected rate of recurrence. Conclusion: Higher than expected observed tumor counts at the lower transplant criteria margin were corroborated by lower than expected HCC recurrence, suggesting that tumor sizes at the margins of HCC transplant criteria may be subject to inaccurate reporting. (Hepatology 2017;66:1144-1150)
Abbreviations
-
- HCC
-
- hepatocellular carcinoma
-
- IQR
-
- interquartile range
-
- UNOS
-
- United Network for Organ Sharing
Hepatocellular carcinoma (HCC) is an important indication for liver transplantation: HCC accounted for 11.6% of the liver transplant waiting list in 2015 but was transplanted at twice the rate of non-HCC indications.1 Patients with HCC are selected for the liver transplant waiting list using stage T2 imaging tumor size criteria: prior to October 31, 2013, these criteria were 1 one lesion equal to or between 2 cm and 5 cm in size or 2 two or three lesions <3 cm in size.
Many elements of data submitted to the United Network for Organ Sharing (UNOS) by transplant centers are subject to review. Center data are audited for completeness, and outcomes are compared to model projections.2 While tumor size data could be verified with an independent blinded audit, there is no process currently in place. For a patient with HCC, the stakes are high: a tumor measurement variation of 0.1 cm may mean the difference between potentially curative transplant and exclusion from the waiting list. Forensic accountants, forensic auditors, economists, and scientists have long used the patterns of the digits (e.g., Benford's law) in numerical data to detect various anomalies.3 In contrast, a comparison of observed number patterns to an expectation has not yet been done in a clinical setting.
In this study, we applied forensic accounting methods to tumor sizes of patients with HCC on the liver transplant waiting list and used a Poisson regression model to evaluate the effect of reporting bias on HCC recurrence. We hypothesized that HCC tumors falling just outside the size criteria may be inappropriately adjusted to fall within the size criteria. For example, a tumor slightly <2 cm could be rounded upward into the ≥2-cm range, and a tumor slightly >5 cm might be rounded downward into the ≤5-cm range. This could compromise the equity of organ distribution.
Patients and Methods
STUDY SUBJECTS
The UNOS Standard Transplant Analysis and Research liver transplant waitlist database (September 2014 data release) was queried for adult patients first listed for transplants with HCC exception points and with an HCC diagnosis meeting the UNOS 3.6.4.4 criteria (stage T2 disease), prior to the implementation of the 1-cm floor. Tumors were analyzed separately by the size criteria applicable to their category (single tumor 2-5 cm in size or two or three tumors <3 cm in size). Patient demographics were described using means and proportions.
TUMOR SIZE ANALYSIS: SINGLE TUMOR 2-5 CM IN SIZE
Tumor sizes were summarized in a histogram. TableCurve 2D (Systat Software, UK) was used to fit a variety of distributions to the histogram of tumor sizes. The observed tumor counts were compared to expected values from the logistic power peak distribution, which was the best-fitting distribution with the highest r2 value (0.926) that could logically be related to tumor measurements.
We then checked whether the 2.0-cm spike above the expected value on the histogram was consistent across the various transplant centers. A ratio of the count of 2.0-cm tumors to the average count of the 2.1-cm and 2.2-cm tumors (“2-cm margin ratio”) was calculated for each center and compared to the sample average using an adaptation of the Fleiss test for a significant difference between two proportions.3 The effect of the center size (number listed) was investigated by calculating a rank correlation between the center's number and the 2.0-cm margin ratio.
The 5.0-cm margin was investigated using similar methods, with the “5.0-cm margin ratio” defined as the count of the 5.0-cm tumors divided by the average count of the 4.8-cm and 4.9-cm tumors. Finally, we evaluated the tumor size distributions of the 10 largest centers combined, defined by the number of patients with HCC wait-listed during the study period, and compared them to the combined results of all the other centers with at least 20 records. Centers with fewer than 20 records were not included in this analysis because many had zeros at the margin, which precluded calculation of a meaningful ratio. The correlation between the 5.0-cm margin ratio and the center size could not be calculated because many centers (including some with more than 100 records) had zero records with measurements of 4.8 or 4.9 cm.
TUMOR SIZE ANALYSIS: TWO OR THREE TUMORS <3 CM IN SIZE
Records for patients with multiple tumors were investigated in a manner similar to that described above. Tumors were ordered in size from largest to smallest within each record. The best-fitting function for the largest tumor was a five-parameter beta distribution with an r2 of 0.938; for the second tumor, a logistic power peak curve with an r2 of 0.930; for the third tumor, a logistic power peak curve with an r2 of 0.908.
ROUNDED NUMBERS
Round numbers, defined as “numbers that can be divided by 100 without leaving a remainder,” have been used (by M.J.N.) in forensic accounting applications to find invented numbers.4
As a result of observing the tumor size spikes at multiples of 0.5 cm, we adapted this approach to define round numbers as numbers that can be divided by 0.5 without leaving a remainder. The binomial distribution was used to calculate the expected proportion of patients with multiple tumors who had “round” tumor measurements. These expectations are calculated in the same manner as calculating the chances of zero, one, two, or three heads with two or three coin tosses, except that in this case heads (a tumor with a round number measurement) has an expected probability of 1/5 = 0.20. Because every fifth millimeter is a number in centimeters that is a multiple of 0.5, the unbiased expected probability of tumor sizes in multiples of 0.5 cm is 0.20. For patients with two tumors, the expectations for zero, one, and two round numbers are 0.64, 0.32, and 0.04, respectively. The expectations for zero, one, two, and three round numbers for patients with three tumors are 0.512, 0.384, 0.096, and 0.008, respectively. A two-sided binomial test of proportions compared expected to observed proportions of patients with “round” tumor measurements.
HCC RECURRENCE
“HCC recurrence” was defined as a diagnosis of recurrence or HCC-related death. Free-text cause of death fields were manually reviewed and determined to be HCC recurrence, HCC-related death, or non-HCC-related death by the senior author (J.P.R.). We used a Poisson model to predict the expected number of HCC recurrences by tumor size, with patient as the unit of analysis. Varying follow-up time from transplant to recurrence, death, or last follow-up was accounted for in the model as the offset. The models were adjusted for variables previously shown to be associated with HCC recurrence: alpha-fetoprotein > 500 ng/mL, waiting time greater than 6 months, history of local-regional therapy, and tumor size.5 The ratio of observed to expected HCC recurrences for each tumor size was estimated using the best linear unbiased prediction of its random effect. There was an insufficient number of recurrences by tumor size among patients with two or three tumors to support the multivariable model. Additional modeling details may be found in the Supporting Information. Poisson regression modeling was completed with STATA/IC 11 (College Station, TX).
This study was approved by our center's committee on human research.
Results
Between January, 1, 2011, and October 31, 2013, 12,958 patients were placed on the liver transplant waitlist with a diagnosis of HCC. Most patients were male (77%), were white (66%), and had liver disease due to hepatitis C virus (61%) (Table 1). Of those listed, 9,168 (70%) received exception points for a single tumor, with a median tumor size of 2.3 cm (interquartile range [IQR] 2.0-3.0).
| Characteristic | n (%) | Single Tumor (n = 9,168) | Multiple Tumors (n = 3,790) |
|---|---|---|---|
| Sex | |||
| F | 3,028 (23.4) | 2,203 (24.0) | 825 (21.8) |
| M | 9,930 (76.6) | 6,965 (76.0) | 2,647 (78.7) |
| Ethnicity | |||
| White | 8,524 (65.8) | 6,047 (66.0) | 2,477 (65.4) |
| Black | 1,221 (9.4) | 855 (9.3) | 366 (9.7) |
| Hispanic/Latino | 1,959 (15.1) | 1,379 (15.0) | 580 (15.3) |
| Asian | 1,088 (8.4) | 774 (8.4) | 314 (8.3) |
| Other | 166 (1.3) | 113 (1.3) | 53 (1.4) |
| ABO blood type | |||
| A | 4,854 (37.5) | 3,444 (37.6) | 1,410 (37.2) |
| AB | 461 (3.6) | 322 (3.5) | 139 (3.7) |
| B | 1,597 (12.3) | 1,107 (12.1) | 490 (12.9) |
| O | 6,046 (46.7) | 4,295 (46.9) | 1,751 (46.2) |
| Body mass index | |||
| <25 | 2,205 (23.9) | 1,502 (23.0) | 703 (26.2) |
| 25-29.9 | 3,659 (39.7) | 2,529 (38.7) | 1,130 (42.2) |
| 30-34.9 | 2,208 (24.0) | 1,619 (24.8) | 589 (22.0) |
| 35-39.9 | 903 (9.8) | 707 (10.8) | 196 (7.3) |
| ≥40 | 246 (2.7) | 185 (2.8) | 61 (2.3) |
| Liver disease etiology | |||
| Hepatitis C virus | 7,913 (61.1) | 5,592 (61.0) | 2,321 (61.2) |
| Hepatitis B virus | 673 (5.2) | 488 (5.3) | 185 (4.9) |
| Alcoholic cirrhosis | 1,112 (8.6) | 739 (8.1) | 373 (9.8) |
| Nonalcoholic steatohepatitis | 716 (5.5) | 532 (5.8) | 184 (4.9) |
| Noncholestatic cirrhosis | 661 (5.1) | 463 (5.1) | 198 (5.2) |
| Other | 1,882 (14.5) | 1,354 (14.8) | 528 (13.9) |
TUMOR SIZE PATTERNS, SINGLE TUMOR 2-5 CM
The histogram of actual tumor sizes for all centers (Fig. 1) demonstrates an irregular logarithmically decreasing pattern with visible spikes at multiples of 0.5 and the largest spikes at 2.0 cm and 3.0 cm. The difference between the observed number of patients (745) and the fitted function value at 2.0 cm is 238.3, amounting to 2.7% of the waiting list population with a single tumor. At the upper limit of 5.0 cm, the difference between the observed number of patients and the fitted function value is 65.7, or 0.7% of the waiting list.
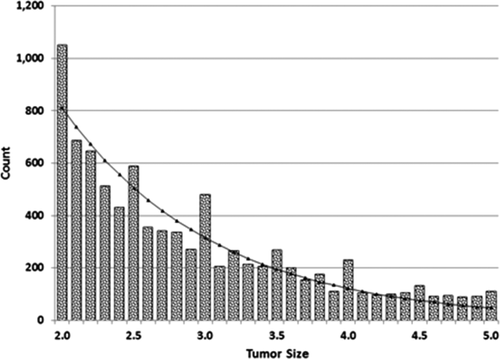
Distribution of tumor sizes (centimeters) for patients with a single tumor, with fitted logistic power peak distribution (n = 9,168).
2.0-CM MARGIN RATIO, BY CENTERS
There were 117 centers included in the study; the 10 largest centers accounted for 3,136 of the patients on the waitlist (24.2%). The average 2.0-cm margin ratio was 1.58, defined as a ratio of the count of 2.0-cm tumors to the average count of the 2.1-cm and 2.2-cm tumors across all centers. Smaller centers were more likely to have an excess of 2.0-cm measurements (correlation of decreasing center size and increasing 2.0-cm margin ratio was –0.194, P = 0.05, for centers with at least 20 records).
5.0-CM MARGIN RATIO, BY CENTERS
The average 5.0-cm margin ratio among all centers was 1.26. The weighted average 5.0-cm margin ratio for the 10 largest centers was 0.96 (range 0-3.0). Three centers had 5.0-cm margin ratios that were significantly different from the mean with P < 0.1, in each case because the 5.0-cm counts were zero. The weighted average for the remaining smaller centers was 1.38.
PATIENTS WITH TWO OR THREE TUMORS
The tumor size distribution for the largest tumor for patients with two or three tumors <3 cm in size (n = 3,790) is shown in Fig. 2A. There was an observed excess of 110 patients at 2.0 cm compared to the expected value and an observed deficit of 110 patients among 1.9, 2.1, and 2.2 cm measurements when compared to the fitted function. There was also an observed excess of 96 patients at 2.8 and 2.9 cm.
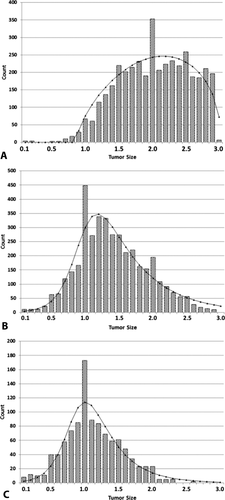
Distribution of tumor sizes (centimeters) for patients with two or three tumors together with fitted distributions: (A) first and largest tumor, n = 3,790; (B) second tumor, n = 3,790; (C) third tumor, n = 1,270.
The tumor size distribution for the second largest tumor for patients with two or three tumors <3 cm in size (n = 3,790) is shown in Fig. 2B. The tumor size distribution for the third largest tumor for patients with two or three tumors <3 cm in size (n = 1,042) is shown in Fig. 2C. There is an excess of 1.0 cm measurements compared to the fitted function.
ROUNDED NUMBERS
In patients with one tumor, 0.33 of tumor measurements were at increments of 0.5, compared to 7/31 = 0.23 expected by chance (P < 0.001). Observed proportions of round numbers and expected values for patients with multiple tumors are shown in Fig. 3: there were fewer patients with zero round numbers than expected. While a “full house” of round numbers is expected to occur 0.04 and 0.008 of the time for patients with two and three tumors, respectively, the observed proportions were higher than expected.
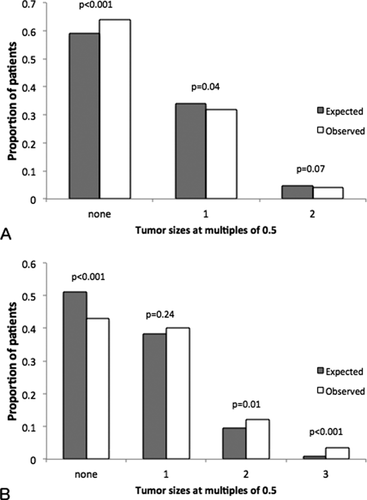
Expected proportions of rounded (multiples of 0.5) measurements compared to observed proportions, for (A) patients with two tumors, n = 2,520, and (B) patients with three tumors, n = 1,270.
HCC RECURRENCE, SINGLE TUMOR 2-5 CM
A total of 6,049 patients were followed for a median of 2.4 years (IQR 1.0-4.7) after liver transplantation. At a median of 14 months after transplantation (IQR 7 months-2.4 years) 435 (7.2%) patients experienced HCC recurrence; an additional 981 (16.2%) patients died a median of 14 months after transplantation (IQR 4 months-2.6 years). Observed/expected ratios of HCC recurrence by tumor size from the multivariable Poisson model (adjusted for alpha-fetoprotein > 500 ng/mL, waiting time greater than 6 months, and history of local-regional therapy) ranged from 0.57 to 1.37. Only 2.0-cm tumors had an adjusted observed to expected ratio statistically significantly different from 1 (ratio 0.73, 95% confidence interval 0.57-0.94) (Fig. 4). This suggests that patients listed with 2.0-cm tumors had a smaller than expected chance of HCC recurrence, potentially as a result of inaccurate tumor size reporting described above.
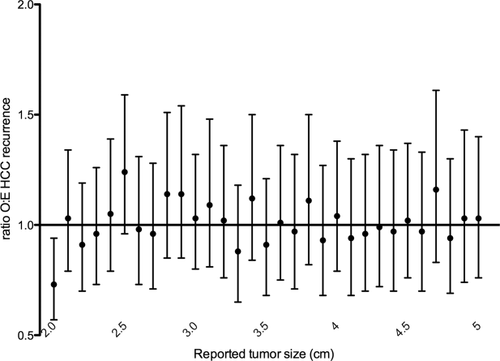
Ratios of observed to expected HCC recurrence for patients with single tumors derived from multivariable Poisson model adjusted for alpha-fetoprotein > 500 ng/mL, waiting time greater than 6 months, and history of local-regional therapy, sorted by tumor size (n = 6,049). Abbreviation: O:E, observed to expected.
Discussion
The fairness of a liver transplant allocation policy for HCC is predicated on accurate reporting of the patient's tumor measurements. Because small changes in tumor size may mean the difference between potentially curative transplant and exclusion from the waiting list, providers may be inaccurately reporting measurements of tumors at the margins of size criteria. We demonstrate that up to 3.5% of the liver transplant waitlist population with a single tumor may have tumors falling outside size criteria and are potentially inappropriately listed. We suggest that adaptations of the forensic accounting methods used to find biases and other anomalies in micro-level and macro-level organizational data may be used by transplant centers to assess the accuracy and validity of their reported data, as well as in other clinical settings where a high level of accuracy is critical. As inaccurate data entry into a federal system potentially represents a criminal offense, there is sufficient motivation for the center and the Organ Procurement and Transplantation Network to monitor for bias.
The tumor size policy is similar to the taxation concept of a notch, where a change in income (usually an increase) triggers a discrete change (usually a decrease) in, for example, the value of a taxpayer's credit.6 These tax notches trigger behavioral responses by the taxpayer, such as self-employed taxpayers making sure that their reported income is below the thresholds for the Savers Credit.7 Other notches occur, for example, where donation-dependent organizations award to their donors various sponsorship levels or where car salespeople get bonuses for exceeding a sales target. Here, the general behavioral response is that donations and car sales cluster at the low side of the reward brackets. Researchers have also investigated notch-related consumer behavior in financial institutions and the housing market.8, 9 The observed excess of tumor measurements at the 2.0-cm and 5.0-cm margins is evidence of similar behavior in HCC tumor size reporting.
While our analysis shows a significant rounding of tumor sizes, it cannot establish the source of this error or its intent: tumor size rounding may be intentional or unintentional during study interpretation or perhaps during reporting to UNOS. The excess at 2.0 cm may also be in part due to intensive serial monitoring of lesions just under size criteria with listing as soon as the threshold is reached. The 2010 American Associations for the Study of Liver Diseases guidelines10 recommend intensive monitoring of single lesions under the 1.0-cm diagnostic threshold for HCC. This practice may carry over to the threshold for transplant exception points, though we do not expect this to result in lower than expected recurrence rates posttransplant. Furthermore, about 1% of the tumor sizes were measured to two decimal places. The inconsistency in the decimals suggests that a uniform recording standard should be developed and then followed. Regardless of the reasons for the rounding and decimal inconsistencies, inaccurate tumor size reporting compromises the equity of liver transplant distribution. Our data suggest that inappropriate rounding of small tumors up to 2.0 cm may contribute to the lower than expected HCC recurrence found at the 2.0-cm tumor margin.
We acknowledge several limitations to this study. The curves fitted to tumor size histograms are not biologically motivated but are the best available expectation lacking a comprehensive registry of all diagnosed HCC tumors. We anticipate that imperfect model fit would decrease the observed size of outlier effects as outliers were not excluded during model fitting and, therefore, may lead to underestimates of the observed deviations. The diagnostic standard for HCC imaging is demonstrably less sensitive for tumors <2 cm in size,11 which may explain the relative scarcity of small tumors in our analysis. The scarcity of small tumors did not allow us to analyze reporting patterns in this group of patients. We restricted our sample to imaging obtained prior to the institution of Liver Imaging Reporting and Data System criteria to reduce heterogeneity of the cohort; the accuracy of measurements and the associated accuracy of reported values may be improving over time with the increased implementation of digital measurement software and more stringent diagnostic criteria.
Interreader variability in tumor size measurements has been evaluated in liver,12, 13 lung,14 and otherwise classified abdominal/thoracic15 nodules. Interreader variability tends to decrease with level of training and lesion size and may account for a difference of 6%-12% for lesions < 1.0 cm and 4%-6% for lesions 2.0 cm or larger.12 While we acknowledge that a difference of 1 or 2 mm may reasonably be attributed to measurement error, we would not expect these measurement errors to cluster preferentially at the margins of transplant eligibility as demonstrated by this analysis. Finally, the small number of observations at larger tumor sizes precluded our finding a significant effect at the 5.0-cm margin.
In this study, we describe a novel application of forensic accounting methods to HCC tumor size reporting on the liver transplant waiting list, finding likely misreporting at the margins of transplant eligibility and a possible effect on posttransplant outcome. In clinical practice at transplant centers, studies done at outside institutions are transmitted to the transplant centers and then re-read as required by Organ Procurement and Transplantation Network policy 9.3.F.iii. Further information may be gleaned from comparing tumor sizes reported from transplant center imaging to sizes reported for the original studies at outside institutions as the outside institutions may not have the same incentives for tumor size reporting. In the absence of an auditing process, we suggest that further investigation of tumor reporting patterns is necessary to enforce the accurate measurement and reporting of HCC tumor sizes in the interest of equitable liver transplant distribution.


