The novel intracellular protein CREG inhibits hepatic steatosis, obesity, and insulin resistance
Potential conflict of interest: Nothing to report.
Supported by grants 81500329, 81400316 and 81570767 from the Young Scientist Fund of the National Science Funding of China (NSFC) ), grant 81130072 from the key fund of NSFC, and grants 81370243, 81670267, 81570265 from the fund of NSFC.
Abstract
Cellular repressor of E1A-stimulated genes (CREG), a novel cellular glycoprotein, has been identified as a suppressor of various cardiovascular diseases because of its capacity to reduce hyperplasia, maintain vascular homeostasis, and promote endothelial restoration. However, the effects and mechanism of CREG in metabolic disorder and hepatic steatosis remain unknown. Here, we report that hepatocyte-specific CREG deletion dramatically exacerbates high-fat diet and leptin deficiency–induced (ob/ob) adverse effects such as obesity, hepatic steatosis, and metabolic disorders, whereas a beneficial effect is conferred by CREG overexpression. Additional experiments demonstrated that c-Jun N-terminal kinase 1 (JNK1) but not JNK2 is largely responsible for the protective effect of CREG on the aforementioned pathologies. Notably, JNK1 inhibition strongly prevents the adverse effects of CREG deletion on steatosis and related metabolic disorders. Mechanistically, CREG interacts directly with apoptosis signal-regulating kinase 1 (ASK1) and inhibits its phosphorylation, thereby blocking the downstream MKK4/7-JNK1 signaling pathway and leading to significantly alleviated obesity, insulin resistance, and hepatic steatosis. Importantly, dramatically reduced CREG expression and hyperactivated JNK1 signaling was observed in the livers of nonalcoholic fatty liver disease (NAFLD) patients, suggesting that CREG might be a promising therapeutic target for NAFLD and related metabolic diseases.
Conclusion: The results of our study provides evidence that CREG is a robust suppressor of hepatic steatosis and metabolic disorders through its direct interaction with ASK1 and the resultant inactivation of ASK1-JNK1 signaling. This study offers insights into NAFLD pathogenesis and its complicated pathologies, such as obesity and insulin resistance, and paves the way for disease treatment through targeting CREG. (Hepatology 2017;66:834–854)
Abbreviations
-
- AFL
-
- alcoholic fatty liver
-
- ALP
-
- alkaline phosphatase
-
- ALT
-
- alanine aminotransferase
-
- ASK1
-
- apoptosis signal-regulating kinase 1
-
- AST
-
- aspartate aminotransferase
-
- cDNA
-
- complementary DNA
-
- CKO
-
- conditional knockout
-
- CREG
-
- cellular repressor of E1A-stimulated genes
-
- CREG-KO
-
- CREG liver-specific knockout
-
- CREG-TG
-
- liver-specific CREG transgenic
-
- DKO
-
- double gene knockout
-
- DMSO
-
- dimethyl sulfoxide
-
- H&E
-
- hematoxylin and eosin
-
- HFD
-
- high-fat diet
-
- HOMA-IR
-
- homeostasis model assessment of insulin resistance
-
- IPGTT
-
- intraperitoneal glucose tolerance test
-
- IPITT
-
- intraperitoneal insulin tolerance test
-
- JNK
-
- c-Jun N-terminal kinase
-
- MAPK
-
- mitogen-activated protein kinase
-
- mRNA
-
- messenger RNA
-
- NAFLD
-
- nonalcoholic fatty liver disease
-
- NC
-
- normal chow
-
- NTG
-
- nontransgenic
-
- PA
-
- palmitate
-
- PAS
-
- periodic acid–Schiff
-
- TG
-
- triglyceride
-
- WT
-
- wild-type
In nonalcoholic fatty liver disease (NAFLD), metabolic disorder in the liver has been recognized as a major feature, which is accompanied by a cluster of abnormalities, including obesity, insulin resistance, dyslipidemia, hepatic steatosis, and eventually irreversible liver injury.1-3 Impaired insulin metabolism and inflammation are key to hepatic steatosis pathogenesis and can cause many types of liver damage, from simple steatosis to advanced fibrosis and cirrhosis.4, 5 However, the detailed mechanisms, including the complex molecular interactions and related cellular behaviors, involved in the process and initiation of hepatic steatosis and metabolic disorder are not yet fully understood, leading to a lack of effective treatment strategies or reagents that may alleviate NAFLD.6
Cellular repressor of E1A-stimulated genes (CREG), a novel cellular protein, was originally cloned from a complementary DNA (cDNA) library in a screen for inhibition of HeLa cell proliferation. Previous studies from our group and others have elucidated an extensive role of CREG in cardiovascular disease phenotypes, including anti-cardiac ischemia,7 anti-hypertrophy,8, 9 anti-inflammation,10 anti-apoptosis (high-glucose and high palmitate [PA]-induced),11 and anti-fibrosis, primarily as a result of its roles in the maintenance of differentiation and reduction of proliferation.12, 13 Interestingly, these cellular events are also involved in hepatic steatosis and metabolic disorders. Furthermore, multiple connections between cardiovascular diseases and NAFLD have been identified.14, 15 Therefore, we hypothesized that CREG regulates hepatic steatosis and metabolic disorders during NAFLD through an unknown mechanism.
Here, to investigate whether and how CREG regulates NAFLD, we applied gain and loss of function approaches. We found that hepatocyte-specific CREG overexpression dramatically reduced dietary and genetic hepatic steatosis and metabolic disorders, whereas CREG deletion in hepatocytes caused exacerbated NAFLD outcomes in a c-Jun N-terminal kinase 1 (JNK1)-dependent manner, which, combined with a close association between CREG and human NAFLD, supports CREG as a promising target for this disease.
Materials and Methods
ANIMALS AND TREATMENTS
Male C57BL/6J mice were reared in a standard environment with a strictly controlled room temperature (22 °C ± 2 °C) and a 12:12-hour light:dark cycle. Ten-week-old mice were fed a high-fat diet (HFD) or on a standard normal chow (NC) diet for the indicated durations. The HFD was a special mouse diet containing 20% carbohydrate, 20% protein, and 60% fat, whereas the NC diet contained 70% carbohydrate, 20% protein, and 10% fat. All of the feed was purchased from Research Diets, Inc. The animals were provided humane care based on the Guide for the Care and Use of Laboratory Animals (National Institutes of Health Publication 86-23, revised 1985). The animal experiments were approved by the Animal Care and Use Committee of the Wuhan University.
Conditional CREG knockout in the liver was performed using the CRISPR/Cas9 system.16 Up- and downstream guide RNAs (gRNA1 and gRNA2) targeting the CREG sequences were designed first. Exon 2 flanked by 2 loxP sites and 2 homology arms in a circular donor vector were designed to repair the DSB by homologous recombination. Next, pups were generated after one-cell-stage embryo injection. After floxed exon 2 amplification, screening was performed to identify mice with floxed exon2 on the same allele. Genomic DNA was used for in vitro Cre-mediated recombination. Finally, CREG conditional knockout (CKO) mice were obtained by mating flox/flox mice with Cre mice.
To generate liver-specific CREG transgenic (CREG-TG) mice,17 a construct containing full-length CREG cDNA was inserted after the CAG-loxp-CAT-loxp cassette, and this was followed by microinjection into fertilized C57BL/6J embryos. The resulting mice were crossed with Albumin-Cre mice to obtain hepatic CREG-TG mice.
HUMAN LIVER SAMPLES
This study enrolled 28 liver donors to examine CREG and JNK1 spatial and overall expression levels. The normal group included normal control livers (n = 11). The inclusion criterion for the normal group was patients who had received liver resection due to liver hemangiomas or hepatic cysts. Exclusion criteria included patients who required intensive care treatment or had lethal trauma during liver biopsy. The NAFLD group comprised NAFLD patients (n = 17). The inclusion criteria of the NAFLD group were patients who had been diagnosed with NAFLD, and the exclusion criteria included those who drank 140 or 70 g/week of alcohol (for men or women, respectively) at the time of the study or within the previous 6 months. All of the human sample experiments were conducted in accordance with the Declaration of Helsinki and were approved by the review board of the Wuhan University.
WESTERN BLOTTING ASSAYS AND IMMUNOPRECIPITATION
Cells or tissues were placed in 100 μL of ice-cold RIPA buffer (20 mM Tris [pH 7.6], 0.5% NP-40, 250 mM NaCl, 3 mM EDTA, 3 mM EGTA, 2 mM dithiothreitol, 0.5 mM PMSF, 20 mM b-glycerol phosphate, 1 mM sodium vanadate, and 1 mg/mL leupeptin) and were incubated at 4 °C for 30 minutes. Next, lysates in buffer were centrifuged at 12,000 rpm for 15 minutes at 4 °C, and polyacrylamide gel electrophoresis with 7.5%-15% sodium dodecyl sulfate was performed. The proteins were transferred to PVDF membranes and incubated with the relevant primary antibody. Immunostaining with antibodies was performed with a BIO-RAD system. For immunoprecipitation, the cells or tissues were collected in RIPA buffer. The resulting lysates were precipitated with the relevant antibody and protein G-sepharose beads by incubation at 4 °C overnight. The immune complex kinase assay for apoptosis signal-regulating kinase 1 (ASK1) was performed as described previously.18
The following antibodies were used. CREG (ab68341, 1:1000 dilution) was obtained from ABCAM (Cambridge, MA, USA). PEPCK (6924, 1:1000 dilution), AKT (4691, 1:1000 dilution), p-GSK3β (9322, 1:1000 dilution), GSK3β (9315, 1:1000 dilution), IRS1 (2832, 1:1000 dilution), p-JNK1/2 (4668, 1:1000 dilution), T-JNK1/2 (9252, 1:1000 dilution), FOXO1 (2880, 1:1000 dilution), p-AKTser473 (9271, 1:1000 dilution), p-FOXO1 (9461, 1:1000 dilution), p-AMPKα (5256, 1:1000 dilution), AMPK (5831, 1:1000 dilution), p-ACC (11818, 1:1000 dilution), ACC (3676, 1:1000 dilution), T-ERK1/2 (9102, 1:1000 dilution), p-ERK1/2 (4370, 1:1000 dilution), T-MEK1/2 (8727, 1:1000 dilution), p-MEK1/2 (9154, 1:1000 dilution), T-T38 (8690, 1:1000 dilution), P-P38 (4511, 1:1000 dilution), T-JNK1 (3708, 1:1000 dilution), T-JNK2 (9258, 1:1000 dilution), and β-actin (3700, 1:1000 dilution) were obtained from Cell signaling Tec (Shanghai, China). p-IRS1Tyr608 (09-432, 1:1000 dilution), p-mTOR (ABS79, 1:1000 dilution), mTOR (04-385, 1:1000 dilution), p-p70s6k (MABS82, 1:1000 dilution), and p70s6k (06-926, 1:1000 dilution) were obtained from Merck Millipore (Beijing, China). FOXO1 (TA323072, 1:500 dilution) was obtained from ORIGENE (Beijing, China). G6Pase (ARP44223-P050, 1:1000 dilution) was obtained from Aviva Systems Biology (Beijing, China). p-JNK1 (AP3644a, 1:500 dilution) was obtained from Agbent (San Diego, CA, USA). p-JNK2 (DYC2236E, 1:500 dilution) was obtained from R&D Systems (Shanghai, China). The BCA protein assay kit was obtained from Pierce company.
METABOLIC ASSAYS
Blood glucose levels were detected with a glucometer (OneTouch Ultra Easy). Serum insulin levels were analyzed with an enzyme-linked immunosorbent assay kit from Millipore. Homeostasis model assessment of insulin resistance (HOMA-IR) was calculated according to Wallace et al.19 An intraperitoneal glucose tolerance test (IPGTT) was performed at 1 g/kg glucose (Sigma-Aldrich, St. Louis, MO) intraperitoneal injection, and an intraperitoneal insulin tolerance test (IPITT) was performed at 0.75 U/kg insulin (Novolin R; Novo Nordisk, Bagsvaerd, Denmark). For both IPGTT and IPITT, the blood glucose level was tested 0, 15, 30, 60, and 120 minutes after glucose/insulin injection. Commercial kits were used to measure triglyceride (TG), total cholesterol, and nonesterified fatty acid levels in the liver (290-63701 for TG assay, 294-65801 for total cholesterol assay, and 294-63601 for nonesterified fatty acid assay; Wako, Tokyo, Japan). All protocols were performed according to the manufacturer's instructions.
HISTOLOGICAL ANALYSES
Paraffin liver sections were prepared for hematoxylin and eosin (H&E) staining, whereas frozen liver sections were stained with Oil Red O. Both methods were used to observe the distribution of lipid accumulation and lipid droplets in the liver. In periodic acid–Schiff (PAS) staining, the liver sections were incubated in 0.5% periodic acid solution for 5 minutes at room temperature after deparaffinization and hydration. After incubation with Schiff's reagent for 15 minutes, H&E staining was performed.
BIOCHEMICAL ASSAY
Liver function tests for alanine aminotransferase (ALT), aspartate aminotransferase (AST), and alkaline phosphatase (ALP) were measured on the basis of the ADVIA 2400 chemistry system (Siemens).
HEPATIC LIPID ACCUMULATION ASSAYS
BODIPY-C16 fluorescence staining was performed. Primary hepatic cells were infected with AdCREG or AdshCREG and the corresponding controls. Next, the cells were treated with PA or vehicle control for 24 hours. Primary hepatic cells in 6-well plates were starved for 3 hours and then incubated with 100 nM BODIPY-C16 for 5 minutes, washed with PBS, and fixed with 4% paraformaldehyde (pH 7.4) for 10 minutes. Images were obtained with a fluorescence microscope (Olympus) and were analyzed with DP2-BSW software.
CELL LINES AND PRIMARY HEPATOCYTE ISOLATION AND CULTURE
Primary hepatocytes were isolated according to a previous protocol.20 Next, these primary hepatocytes were cultured in Dulbecco's modified Eagle's medium supplemented with 10% fetal bovine serum and 1% penicillin-streptomycin in a 5% CO2/water-saturated incubator. To mimic a fatty liver model in vitro, PA (0.25 mM; Sigma-Aldrich) was added to the culture medium for 24 hours. For Oil Red O staining of primary hepatocytes, the cells were fixed in 4% paraformaldehyde for 10 minutes and then stained in 0.3% Oil Red O working solution for 30 minutes. All of the cell culture reagents and other reagents were purchased from Sigma. Recombinant Ads encoding CREG, shCREG (a short hairpin RNA targeting CREG), GFP, or short hairpin RNA (as a nonspecific control) were constructed as described previously.21
REAL-TIME POLYMERASE CHAIN REACTION ASSAYS
Total messenger RNA (mRNA) was extracted from liver tissue or cultured cells with TRIzol Reagent (15596-026; Invitrogen) and was reverse transcribed into cDNA with a PrimeScript 1st Strand cDNA Synthesis Kit (TAKARA, China) according to the manufacturer's protocol. SYBR Green (SYBR Premix Ex Taq [Tli RNaseH Plus], ROX plus) was applied to quantify polymerase chain reaction amplification. The mRNA expression levels of target genes were normalized to those of GAPDH.
STATISTICAL ANALYSES
The data in this study are presented as the mean ± standard deviation. Two-tailed Student t tests were performed to compare two groups, and differences among more than two groups were evaluated using one-way analysis of variance followed by Tukey's post hoc tests. In contrast, in the absence of a normal distribution, comparison among groups were performed using nonparametric Mann-Whitney tests (comparison of two groups) or Kruskal–Wallis (more than two groups) tests as appropriate. The cutoff for statistically significant differences was a P value of 0.05. SPSS version 22.0 (SPSS Inc, Chicago, IL) was used for analysis. The animal cohort sizes were determined on the basis of similar previous studies.21 Randomization and blinding were used whenever possible.
Results
CREG IS DECREASED IN FATTY LIVERS
First, the expression levels of CREG mRNA and protein were measured in fatty livers in a mouse NAFLD model. After being fed an HFD for 12 weeks, the mRNA and protein expression levels of CREG mice were clearly decreased compared with those of the NC-treated control mice (HFD 0.43 ± 0.04 versus NC 1.00 ± 0.21; P < 0.05 versus NC, Fig. 1A; HFD 2.68 ± 1.04 versus NC 5.88 ± 0.92; P < 0.05 versus NC, Fig. 1B). To directly investigate whether CREG levels changed in liver hepatocytes exposed to a dynamic change, primary hepatocytes were exposed to concentration gradients of PA (0.1 mM, 0.2 mM, 0.4 mM; Fig. 1C), and CREG expression was significantly decreased in PA-treated primary hepatocytes in a dose-dependent manner compared with the CREG expression in the control group. Considering the multiple pathogenic signs of NAFLD, a classical feed/fasted model was established, and CREG expression was measured. In addition to changes to PEPCK and G6Pase, lipid metabolism-related proteins, CREG expression levels were significantly decreased after 24 hours of fasting (P < 0.05 versus feed; data shown in Fig. 1D). Furthermore, an examination of CREG protein levels in human samples was performed by DAB staining (Dako REAL EnVision Detection System). The obtained images showed that CREG was mainly distributed in the cytoplasm of hepatocytes and was dramatically reduced in the livers of NAFLD patients compared with normal group subjects (Fig. 1E). Next, western blotting confirmed decreased CREG levels in the NAFLD group (NAFLD 1.00 ± 0.25 versus normal 2.77 ± 0.34, P < 0.05; Fig. 1F). In short, CREG mRNA and protein expression decreased as fat accumulation increased, thus suggesting a potential role of CREG in metabolism disorder.
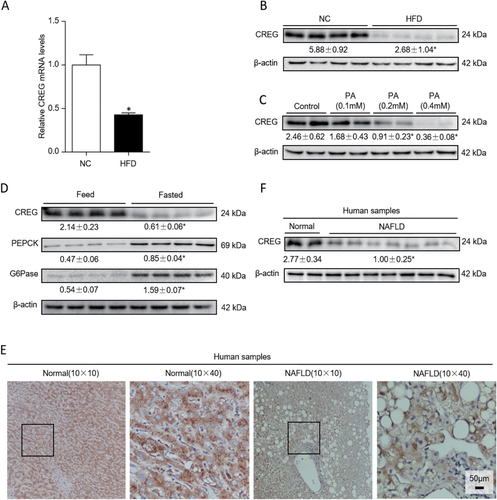
CREG expression is decreased in hepatic steatosis and is involved in lipid metabolism. (A) mRNA levels of CREG in the NC and HFD group (n = 12 in each group). *P < 0.05 versus NC. (B) CREG expression in the NC group and HFD group. *P < 0.05 versus NC (n = 4 in both the NC and HFD groups). (C) Western blot analysis of CREG expression in primary mouse hepatocytes treated with different concentrations of PA (n = 6 in each group). Control, 0.1 mM, 0.2 mM, 0.4 mM. *P < 0.05 versus control. (D) Western blot results of CREG, PEPCK, and G6Pase in the feed/fasted experiment (n = 4 in both the feed and fasted groups). *P < 0.05 versus feed. (E) Representative immunohistochemistry staining of CREG in human liver samples. Normal group: normal control livers. NAFLD group: NAFLD patients. The nuclei were counterstained with Gill's II hematoxylin, which is dark blue in color. CREG was stained with DAB and is a dark brown color. Black boxes in the left-hand images indicate zoomed-in areas shown in the right-hand images. (F) Human liver CREG protein changes in different groups. Normal group: normal control livers (n = 11). NAFLD group: NAFLD patients (n = 17). *P < 0.05 versus normal.
HEPATIC CREG DELETION AGGRAVATES HFD-INDUCED OBESITY AND INSULIN RESISTANCE.
After confirming the dramatic down-regulation of CREG in fatty livers, we sought to assess the role of CREG in NAFLD and associated complications. Therefore, CREG-CKO mice were generated (Fig. 2A), and HFD treatment was administered. Western blotting was used to validate successful liver-specific CREG-KO (Fig. 2B). CREG-KO in the liver led to significantly higher body weight, liver weight/body weight and liver weight in mice administered an HFD for 12 weeks compared with the wild-type (WT) controls (Fig. 2C,D,G). In the following glucometabolism studies, CREG-CKO mice exhibited higher fasting blood glucose and fasting serum insulin levels (Fig. 2E,F,H,I), thus leading to a higher value in the homeostasis model of assessment for insulin resistance index (HOMA-IR) (Fig. 2J). Moreover, glucose tolerance tests and insulin tolerance tests demonstrated that CREG-CKO mice developed more severe glucose tolerance and insulin sensitivity (Fig. 2K,L). To further study the influence of CREG deletion on insulin resistance, insulin signaling (IRS1/Akt, GSK3β, FOXO1) was analyzed using western blotting. The phosphorylation levels of all of these tested signaling components, for which higher levels indicate higher glucometabolism ability, were markedly lower in the KO-HFD group than in the controls (Fig. 2M). PAS showed that the glycogen content in the liver was impaired by CREG deletion (Fig. 2N). In short, this loss-of-function study suggests that CREG deletion specifically in the liver aggravates glucometabolism disorder.
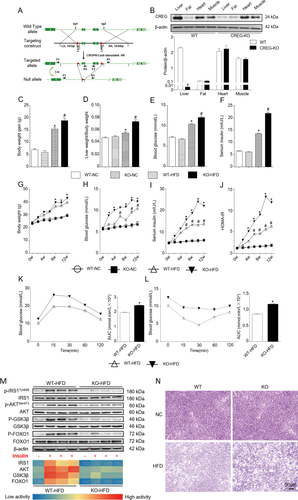
Hepatic CREG deletion aggravates HFD-induced obesity and insulin resistance. (A) Schematic of CREG-CKO in mouse livers. (B) CREG expression in different mouse tissues before (WT) and after CREG-KO (n = 3 in each type of tissue: liver, fat, heart, and muscle for both the WT group and CREG-KO group). *P < 0.05 versus WT. (C-F) Body weight gain, liver weight/body weight, fasting blood glucose, and fasting serum insulin after 12 weeks (n = 12 in each group). WT-NC: WT mice reared under normal conditions. KO-NC: hepatic CREG-CKO mice reared under normal conditions. WT-HFD: WT mice administered an HFD. KO-HFD: hepatic CREG-CKO mice administered an HFD. *P < 0.05 versus WT-NC, #P < 0.05 versus WT-HFD. (G-J) Body weight change curve, blood glucose change curve, serum insulin change curve and HOMA-IR in 12 weeks (n = 12 in each group). The details of the groups are the same as those described previously. *P < 0.05 versus the same time point data in WT-HFD mice. #P < 0.05 versus the same time point data in WT-NC mice. (K,L) IPGTT and IPITT after 12 weeks of being administered an HFD and calculation of the corresponding areas under the curve for IPGTT and IPITT (n = 12 in each group). *P < 0.05 versus WT-HFD. (M) Top: Western blot analysis of IRS1, AKT, GSK3β, and FOXO1 activities in the presence or absence of insulin. Bottom: heat map of IRS1, AKT, GSK3β, and FOXO1 activities according to the semiquantitative corresponding band in the western blotting results. Red represents high activity and blue represents low activity (n = 4 in each group). (N) PAS glycogen staining in the four groups. Details of the groups were the same as those described previously. Scale bar = 50 μm.
HEPATIC CREG OVEREXPRESSION REVERSES NAFLD PATHOLOGIES INDUCED BY HFD
After the hepatic CREG deletion study, hepatocyte-specific overexpression of CREG was evaluated to further determine the effects of CREG on hepatic steatosis and metabolic disorders (Fig. 3A). Western blotting confirmed hepatic-specific CREG overexpression (Fig. 3B), whereas nontransgenic (NTG) mice served as controls after being fed an HFD for 12 weeks. Although no significant effects on body weight were observed, CREG overexpression significantly decreased liver weight/body weight ratio (Fig. 3C,D,G). TG reversed the high blood glucose and high serum insulin levels induced by HFD feeding (Fig. 3E,F,H,I). Moreover, insulin resistance was also improved by TG in the HFD condition as assessed by HOMA-IR, glucose tolerance tests, insulin tolerance tests, and insulin signaling analysis (Fig. 3J-M). PAS results showed a higher glycogen level in the TG-HFD group than that in the littermate controls (Fig. 3N). This gain-of-function study suggested that CREG overexpression in the liver improves glucometabolism disorders.
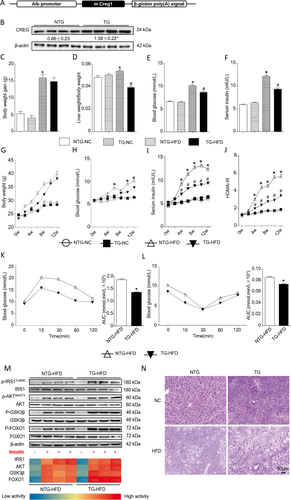
Hepatic-specific CREG overexpression alleviated the adverse effects of an HFD. (A) Schematic of the hepatic-specific CREG transgene in mouse livers. (B) CREG expression before (NTG) and after (TG) hepatic-specific CREG overexpression (n = 4 in each group). *P < 0.05 versus NTG. (C-F) Body weight gain, liver weight/body weight, fasting blood glucose, and fasting serum insulin after 12 weeks (n = 12 in each group). NTG-NC: NTG mice reared under normal conditions. TG-NC: hepatic CREG overexpression mice reared under normal conditions. NTG-HFD: NTG mice administered an HFD. TG-HFD: hepatic CREG overexpression mice administered an HFD. *P < 0.05 versus NTG-NC. #P < 0.05 versus NTG-HFD. (G-J) Body weight change curve, blood glucose change curve, serum insulin change curve, and HOMA-IR after 12 weeks (n = 12 in each group). Details of the groups were the same as those described previously. *P < 0.05 versus the same time point data in NTG-NC. #P < 0.05 versus the same time point data in NTG-HFD. (K,L) IPGTT and IPITT after 12 weeks of the HFD and the corresponding areas under the curve for IPGTT and IPITT were calculated (n = 12 in each group). *P < 0.05 versus NTG-NC. (M) Top: Western blot analysis of IRS1, AKT, GSK3β, and FOXO1 activities in the presence or absence of insulin. Bottom: heat map of IRS1, AKT, GSK3β, and FOXO1 activities according to semiquantitative analysis of the corresponding band from the western blotting results (n = 4 in each group). (N) PAS glycogen staining in the four groups. Details of the groups are the same as those in panels C-F. Scale bar = 50 μm.
CREG IMPROVES HFD-INDUCED HEPATIC STEATOSIS AND LIPID METABOLISM PERTURBATION
Next, we evaluated the effect of CREG on perturbation of lipid metabolism, a specific NAFLD feature with close connections to obesity, glucometabolic disorder, and insulin resistance. Liver ultrasound demonstrated that HFD administration led to greater lipid accumulation than that observed in the NC group (NC group thickness, 2.83 ± 0.25 mm; n = 3). When the ultrasonic probe was at the same position and detection angle, the liver was thicker in the KO-HFD group than in the WT-HFD group (thickness, 4.97 ± 0.25 mm versus 3.53 ± 0.35 mm; P < 0.05; n = 3) (Fig. 4A). Increased lipid accumulation in the liver demonstrated by H&E and Oil Red O staining accompanied increased nonesterified fatty acid, total cholesterol, and TG levels in the KO-HFD group (Fig. 4B-E). Furthermore, liver function as reflected by ALT, AST, and ALP levels was increased by KO after HFD treatment (Fig. 4F). According to the above glucometabolism studies, CREG overexpression reversed these changes (Fig. 4G-J). After the in vivo studies above, in vitro lipid accumulation in primary hepatic cells transfected with AdCREG to overexpress CREG or transfected with AdshCREG to down-regulate its expression was evaluated using Oil Red O staining (top two lines) and BODIPY-C16 fluorescence staining (bottom two lines) (Fig. 4L). Oil red O staining showed that lipid accumulation was decreased in the Ad-CREG group but was increased in the Ad-shCREG group compared with the corresponding controls. Furthermore, we observed that for BODIPY-C16 fluorescence staining, cells without lipid accumulation in the control group exhibited signet-ring changes with a clear cell outline, whereas PA triggered robust lipid accumulation. With AdCREG transfection, some cells recovered the signet-ring changes, but nearly all of the cells showed robust lipid accumulation with a crude contour and green fluorescence throughout the cytoplasm in the PA AdshCREG group (Fig. 4K).
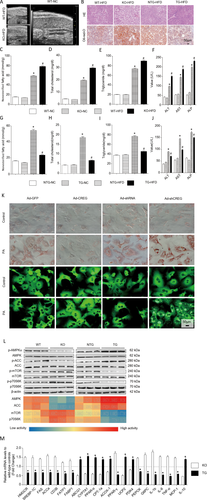
CREG improves HFD-induced lipid metabolism perturbation and hepatic steatosis. (A) Representative liver ultrasound images in WT and CREG-KO mice fed an HFD (top left and bottom left) and representative liver ultrasound image from the normal control group (right). (B) Representative liver sections stained with H&E (top row) or Oil Red O (bottom row) in WT/NTG, TG, and KO mice reared for 12 weeks on an HFD. Scale bar = 50 μm. (C-F) Levels of nonesterified fatty acids, total cholesterol, triglycerides, and liver function enzymes (ALT, AST, ALP) in CREG-KO experiments. Details of the grouping are the same as those in Figure 2C-F. *P < 0.05 versus the corresponding data in WT-NC mice. #P < 0.05 versus corresponding data in WT-HFD mice. (G-J) Levels of nonesterified fatty acids, total cholesterol, TG, and liver function enzymes (ALT, AST, ALP) in CREG overexpression experiments. Details of the grouping are the same as those in Figure 3C-F. *P < 0.05 versus corresponding data in NTG-NC mice. #P < 0.05 versus corresponding data in NTG-HFD mice. (K) Lipid accumulation in primary hepatic cells was evaluated on the basis of Oil Red O staining (top two rows) and BODIPY-C16 fluorescence (bottom two rows). Primary hepatic cells were infected with AdCREG or AdshCREG or their corresponding controls. The cells were then treated with PA or vehicle control for 24 hours. Scale bar = 50 μm. (L) The phosphorylation of AMPK, ACC, mTOR, and p70S6K was analyzed by way of western blotting (top). Different colors in the heat map represent the phosphorylation activity of the corresponding band in western blotting. (M) Changes to lipid metabolism-related mRNA levels in WT between KO and TG, as detected by real-time polymerase chain reaction. *P < 0.05 versus KO group (n = 12 in each group).
Next, the lipid metabolism-related AMPK, ACC, mTOR, and p70S6K signaling pathways were analyzed, and AMPK and ACC phosphorylation were positively correlated with CREG protein expression, whereas mTOR and p70S6K were negatively correlated (Fig. 4L). In addition, the mRNA levels of lipid metabolism- and inflammation-related genes were analyzed by using real-time polymerase chain reaction. After chronic HFD administration, CREG-TG mouse livers showed decreased expression of mRNAs associated with fatty acid synthesis (HMGCR, SREBP-1C, FAS, ACCa), fatty acid uptake (CD36, FATP1, FABP1, PPAR-γ), glycogenesis (PEPCK, G6PC), and inflammatory markers (IL-1b, IL-6, TNF-α, MCP-1) and increased levels of mRNAs associated with fatty acid oxidation/anti-inflammation (ABCG1, CYP7A1, PPAR-α, CPT-1a, ACOX-1, UCP2, IL-10, PDK4), whereas CREG-KO mouse livers exhibited expression changes that were opposite from those observed in the CREG-TG mice (Fig. 4M).
Collectively, CREG deletion increased lipid accumulation in liver, whereas CREG overexpression improved this pathology.
CREG INHIBITS INSULIN RESISTANCE AND HEPATIC STEATOSIS IN OB/OB MICE.
To study the effect of CREG on genetic NAFLD, we used genetically obese ob/ob mice. CREG protein expression decreased with increased feeding time in the livers of ob/ob mice (Fig. 5A). Lipid accumulation in the liver demonstrated by H&E and Oil Red O staining also decreased in the ob/ob-AdCREG group (Fig. 5B). However, the body weight and liver weight/body weight ratio did not change with CREG overexpression in ob/ob mice (Fig. 5C,D), although CREG overexpression largely improved hepatic steatosis and metabolic disorder (Fig. 5E-I) and insulin resistance (Fig. 5J,K). Thus, CREG overexpression alleviated hepatic steatosis and metabolic disorder in genetic NAFLD.
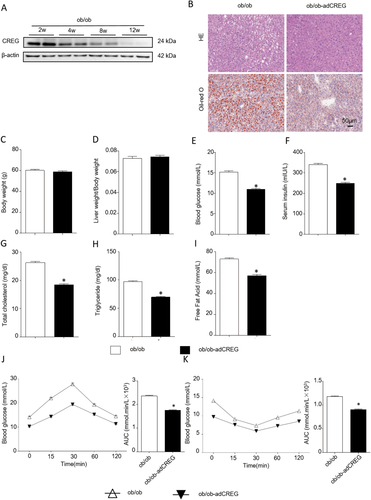
CREG inhibits obesity, insulin resistance, and hepatic steatosis in ob/ob mice. (A) Western blot analysis of CREG expression at different time points in ob/ob mouse liver (n = 6 at each time point). (B) Representative liver sections stained with H&E (top row) or Oil Red O (bottom row) in ob/ob or ob/ob-AdCREG mice. Scale bar = 50 μm. (C- I) Body weight, liver weight/body weight, blood glucose and serum insulin, total cholesterol, TG, and free fatty acids in the liver between the ob/ob group and ob/ob-AdCREG group were evaluated. ob/ob group: 8-week-old mice reared under normal conditions for 4 weeks. ob-AdCREG group: 8-week-old ob/ob mice infected with AdCREG in the liver and then reared for 4 weeks under normal conditions (n = 12 in each group). *P < 0.05 versus ob/ob group. (J-K) IPGTT and IPITT, corresponding to the areas under the curve (AUC) of IPGTT and IPITT, were calculated in the two groups (n = 12 in each group). *P < 0.05 versus the ob/ob group.
JNK SIGNALING INACTIVATION IS REQUIRED FOR THE EFFECT OF CREG ON NAFLD
To explore the underlying CREG mechanism, the mitogen-activated protein kinase (MAPK) family, which plays a critical role in hepatic steatosis and metabolic disorder, was studied. The phosphorylation levels of MEK, ERK, JNK, and P38 were analyzed by western blotting in vivo (Fig. 6A) and in vitro (Fig. 6B). In the tested proteins (Fig. 6A,B), only JNK phosphorylation changed in by CREG manipulation in vivo and in vitro. In the CREG-KO HFD and AdshCREG PA groups, JNK phosphorylation increased, whereas JNK phosphorylation decreased in the CREG TG HFD and AdCREG-mediated PA groups compared with their respective controls. Therefore, we hypothesized a potential role of JNK1/2 in CREG-mediated hepatic steatosis and metabolic disorder, and further experiments were performed to confirm this idea. First, the JNK1/2 inhibitor SP600125 was used to block JNK1/2 phosphorylation (Fig. 6C). We found that SP600125 successfully reversed the adverse effect of CREG-KO on body weight gain, liver weight/body weight, blood glucose, serum insulin, and IPGTT and IPITT response (Fig. 6D-I). The H&E and Oil Red O staining also showed that SP600125 abolished the robust lipid accumulation in the CREG-CKO group (Fig. 6J). Importantly, immunohistochemistry results from human samples showed that the expression was negatively correlated with P-JNK (Fig. 6K). These data indicated that CREG mediates hepatic steatosis and metabolic disorder by way of the JNK signaling pathway.
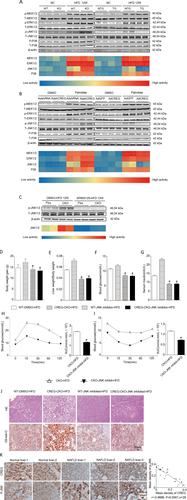
JNK signaling inactivation is required for the effect of CREG on NAFLD. The activities of metabolism-related signaling proteins, including MEK1/2, ERK1/2, JNK1/2, and p38, were analyzed by way of western blotting in vivo or in vitro. The heat map represents the phosphorylation activity of the corresponding band shown below the western blotting results (n = 3 in each independent experiment). (A) In vivo experiment; details of the groupings shown in Figure 2C-F and Figure 3C-F. (B) Primary mouse hepatocytes were infected in vitro with AdCREG or AdshCREG or the corresponding controls. The cells were then treated with PA or vehicle control for 24 hours. (C) Western blot analysis of JNK activity before and after JNK inhibitor administration. The heat map represents the phosphorylation of the corresponding band (n = 6 in each group). (D-G) Body weight gain, liver weight/body weight, blood glucose, and serum insulin after 12 weeks (n = 12 in each group). WT-DMSO-HFD: WT mice administered an HFD and injected intraperitoneally with dimethyl sulfoxide (DMSO). CREG-CKO-HFD: hepatic CREG-CKO mice administered an HFD. WT-JNK inhibitor-HFD: WT mice administered an HFD and injected intraperitoneally with the JNK inhibitor SP600125 dissolved in DMSO. CREG-CKO-JNK inhibitor-HFD: hepatic CREG-CKO mice administered an HFD and injected intraperitoneally with the JNK inhibitor SP600125 dissolved in DMSO. *P < 0.05 versus WT-DMSO-HFD mice. P# < 0.05 versus CREG-CKO-HFD mice. (H, I) IPGTT and IPITT after 12 weeks on an HFD and the corresponding areas under the curve (AUC) for IPGTT and IPITT were calculated (n = 12 in each group. *P < 0.05 versus CREG-CKO-HFD mice. (J) Representative liver sections stained with H&E (top row) or Oil Red O (bottom row) in different mouse groups that administered an HFD for 12 weeks. WT-DMSO-HFD: WT mice administered an HFD and injected intraperitoneally with DMSO. CREG-CKO-HFD: hepatic CREG-CKO mice administered an HFD. In the JNK-inhibited groups (WT-JNK inhibited-HFD, WT-JNK inhibited-HFD), HFD-fed 8-week-old mice were injected intraperitoneally with SP600125 dissolved in DMSO (10 mg/kg) (LC Laboratories, Woburn, MA) or DMSO vehicle (WT-DMSO-HFD) daily for 4 weeks. Scale bar = 50 μm. (K) Correlation analysis between CREG activity and p-JNK activity. Left: Representative immunohistochemistry staining of CREG or JNK in human liver samples. Normal group: normal control livers (n = 11), NAFLD group: NAFLD (n = 17). The nuclei were counterstained with Gill's II hematoxylin, which is dark blue. CREG (top row) and p-JNK (bottom row) were stained with DAB, which is dark brown. Scale bar = 50 μm. Right: correlation diagram between CREG and p-JNK (r = −0.8686; P < 0.0001; n = 28).
JNK1, NOT JNK2, MEDIATES CREG-REGULATED HEPATIC STEATOSIS AND METABOLIC DISORDER
Given that two major isoforms of JNK, JNK1 and JNK2, are expressed in hepatocytes22 with both overlapping and diverse functions, we next investigated the precise contribution of these two major isoforms to CREG-mediated hepatic steatosis and metabolic disorders. To clarify the requirement of JNK1 and JNK2 for physiological CREG function after HFD administration, CREG-JNK1-double gene knockout (DKO) and CREG-JNK2-DKO mice were generated (Fig. 7A). H&E and Oil Red O staining showed that lipid accumulation was decreased in the CREG-JNK1-DKO group but not the CREG-JNK2-DKO group (Fig. 7B). To further confirm the reversal of this effect in CREG-JNK1-DKO mice, the body weight gain, liver weight/body weight, blood glucose, and HOMA-IR were analyzed. The adverse effect of CREG deletion was reversed by knocking out JNK1 (Fig. 7C-F). However, JNK2 deletion did not reverse the effect of CREG knock out (Fig. 7G-J). Therefore, our findings clearly demonstrate that the role of CREG in NAFLD pathologies is largely dependent on inactivation of JNK1 but not JNK2.
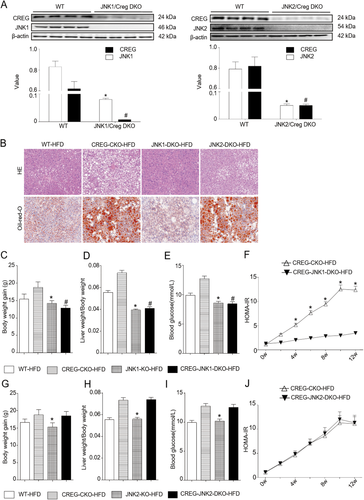
JNK1, but not JNK2, mediates CREG-associated glycolipid metabolic regulation. (A) Western blotting analysis of CREG and JNK1/JNK2 expression before and after DKO. The corresponding semiquantitative values were calculated. *P < 0.05 versus WT-CREG. #P < 0.05 versus WT-JNK1/JNK2 (n = 12 in each group). (B) Representative liver sections stained with H&E (top row) or oil red O (bottom row) in different mouse groups administered an HFD for 12 weeks. The WT-HFD and CREG-CKO-HFD groups were the same as those in Figure 4B. JNK1-DKO-HFD and JNK2-DKO-HFD: CREG and JNK1/2 DKO mice administered an HFD for 12 weeks. Scale bar = 50 μm. (C-E) Body weight gain, liver weight/body weight, and blood glucose after 12-week HFD treatment (n = 12 in each group). JNK1-KO-HFD and CREG-JNK1-DKO-HFD: JNK1 KO mice and JNK1-CREG DKO mice administered an HFD for 12 weeks. *P < 0.05 versus WT-HFD. #P < 0.05 versus CREG-CKO-HFD. (F) HOMA-IR values were calculated between the CREG-JNK1-DKO-HFD and CREG-CKO-HFD groups. *P < 0.05 versus the JNK1-CREG-DKO-HFD group (n = 12) in each group. (G-I) Body weight gain, liver weight/body weight, and blood glucose after 12 weeks of HFD treatment (n = 12 in each group). JNK2-KO-HFD and CREG-JNK2-DKO-HFD: JNK1 KO mice and JNK1-CREG DKO mice administered an HFD for 12 weeks. *P < 0.05 versus WT-HFD. (J) HOMA-IR values were calculated between the CREG-JNK2-DKO-HFD and CREG-CKO-HFD groups (n = 12 in each group).
CREG PHYSICALLY INTERACTS WITH ASK1 IN THE JNK SIGNALING PATHWAY
We next explored the link between CREG and JNK1. ASK1 is an important upstream of JNK1 signaling pathway via activating MKK4/7. In the present session, ASK1 were studied to determine whether CREG regulates JNK1 via the ASK1-MKK4/7-JNK1 cascade. Therefore, the physical interactions of CREG with components in this cascade were examined. Cells were transiently cotransfected or separately transfected with FLAG-tagged MAPK kinase (ASK1, MKK4, MKK7, JNK1), FLAG-tagged CREG, and HA-tagged ASK1. Notably, CREG was strongly bound to ASK1, but not to other tested factors in the JNK signaling cascade (Fig. 8A-C). As expected, CREG inhibited ASK1 phosphorylation in a dose-dependent manner (Fig. 8D). The inhibitory effect of CREG on ASK1 activity was further confirmed in PA-stimulated primary hepatocytes, as evidenced by the dramatically increased ASK1 phosphorylation in the KO group but the decreased phosphorylated ASK1 after CREG overexpression compared with the corresponding controls (Fig. 8E). Collectively, these data demonstrate that CREG alleviates NAFLD pathologies by directly binding to ASK1 and inhibiting ASK1-MKK4/7-JNK1 signaling.
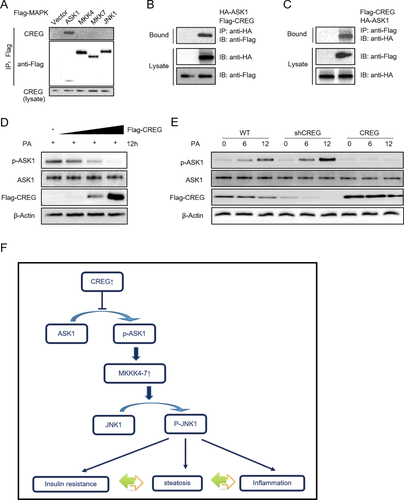
CREG physically interacts with ASK1 (MAPKKK) in the JNK signaling pathway. (A) Cells were cotransfected with CREG expression and the FLAG-tagged kinases ASK1/MKK4 and MKK7/JNK1. After immunoprecipitation with anti-FLAG antibody, co-immunoprecipitated proteins were detected by using anti-CREG antibody (top row) and anti-FLAG (middle row). The lysates were blotted by anti-CREG antibodies (bottom row). (B) Cells were cotransfected with FLAG-tagged CREG and HA-tagged ASK1 plasmids. After immunoprecipitation with anti-FLAG antibody, co-immunoprecipitated proteins were detected using anti-HA antibody (top row). The lysates were blotted using anti-HA antibody (middle row) and anti-FLAG antibody (bottom row). (C) Experiments performed similarly to panel B; anti-FLAG antibody was used for immunoprecipitation. (D) Increasing amounts of FLAG-tagged CREG were transfected into cells, and PASK1/ASK1 expression was detected. (E) Relationship between endogenous CREG and endogenous P-ASK1/ASK1 in PA-treated primary mouse hepatocytes. (F) Schematic diagram depicting the role of CREG in metabolism disorders and hepatic steatosis. In response to a continuous challenge from the HFD, up-regulated CREG inhibited ASK1 phosphorylation and activation; this was followed by the inhibition of downstream JNK signaling, thus leading to enhanced insulin resistance, an inflammatory response, and hepatic steatosis.
Discussion
In the present study, we provide evidence of a protective role of CREG in NAFLD. Despite recent research,23 the treatment strategies and mechanism underlying the complicated pathological processes of NAFLD remain unclear.24-26 After researching CREG for more than 10 years, our laboratory has found that CREG is a suppressor of various cardiovascular diseases with a basic function in promoting cell differentiation and inhibiting cell proliferation. Notably, these findings have already been used to create a nanoporous CREG-eluting stent to attenuate in-stent restenosis in porcine coronary arteries after stent implantation for acute myocardial infarction.7 However, the function of CREG in liver disease is unknown. CREG reduces insulin resistance and lipid accumulation via the inhibition of ASK1-JNK1 signaling pathway, as shown by gain- and loss-of-function experiments in vivo and in vitro. Importantly, the consistently decreased expression of CREG in the livers of NAFLD/NASH patients and the application of a nanoporous CREG-eluting stent suggest the possibility of clinical translation by targeting CREG for NAFLD treatment.
JNK, which belongs to the MAPK family, is often activated by metabolic and inflammatory factors. Consistent with our results, previous studies have indicated that hyperactivation of JNK plays a vital role in hepatic steatosis and metabolic disorder.27-30 Hirosumi et al.31 also found that JNK loss of function in the entire body results in decreased weight gain after HFD administration and a reduction in insulin resistance. Our screening of MAPK family members identified JNK as the only member modulated by CREG, thus suggesting that the JNK signaling pathway, but not those of other MAPK family members, is the principal signaling pathway responsible for CREG-mediated hepatic steatosis and metabolic disorders. Interestingly, we further observed that JNK1 inactivation, instead of JNK2, is the mechanism underlying CREG function. As reported previously,32 ASK1 regulates both JNK1 and JNK2. Consistently, we observed signal changes of ASK1, JNK1, and JNK2 during NAFLD development. However, our screening experiments highlight that only JNK1 was significantly regulated by CREG. Furthermore, examination to screening MAP3K showed that ASK1 is responsible for CREG-regulated JNK1 inactivation. Notably, our “rescue” experiments showed that ASK1-JNK1 is responsible for the phenotypic changes induced by CREG in our animal model. The specific regulation of CREG-ASK1 on JNK1 but not JNK2 might be explained by the complexity of the molecular network. This suggestion is so important that the special relationship between ASK1, JNK1, and JNK2 should be clarified in the future. Other mechanisms of CREG involving JNK1 in NAFLD might contain IRS1, peroxisome proliferator activated receptor and inflammatory factors. First, it has been reported that JNK1 inhibits the phosphorylation of serine residues on insulin receptor substrate 1, thus inducing insulin resistance and obesity-induced inflammation.33 In addition, in lipid metabolism, the complicated mechanism by which JNK1 promotes steatosis which involves hepatic and/or peripheral effects, might be related to PPARα/γ.34-36 Furthermore, there is also evidence that JNK activation might contribute to diet-induced inflammation.33 Thus, JNK affects NAFLD through both basic and multifactorial mechanisms.37
ASK1, a member of the MAPK kinase kinase (MAP3K) family, selectively activates JNK and promotes MKK4/7 phosphorylation.38 Notably, recent studies have shown that ASK1 is responsive to nutrient apply and closely participated in inflammation, insulin resistance, and hepatic steatosis. Furthermore, using ASK1 binding signals such as TRAF1 may negatively regulate NAFLD.39, 40 Recently, the ASK1 inhibitor GS-4997 is being planned for use in NASH/NAFLD patients after completion of a phase 2 clinical trial.41 In our study, we first identified ASK1 as a novel target for CREG-mediated protective role in NAFLD. The present study has confirmed that CREG colocalizes with ASK1 in the cytoplasm and binds directly to the ASK1 to inactivate ASK1-JNK1 signaling, then subsequently suppresses NAFLD pathologies and complications. Our findings of the novel binding signals ASK1 extends the biological functions and clinical application of CREG in NAFLD. The specific CREG regulation of ASK1 enables the maintenance of CREG as a therapeutic strategy for NAFLD treatment.
It is not clear how CREG physically interacts with ASK1 and results in its dephosphorization. ASK1 activates JNK and p38 in response to various stimuli such as oxidative stress, endoplasmic reticulum stress, infection, and calcium influx. Under these stress conditions, ASK1 plays various important roles in intracellular signaling pathways and biological functions. There are several potential mechanisms underlining CREG–ASK1 interaction. First, ASK1 has a serine threonine kinase domain in the middle part of the molecule. CREG might directly interact with this domain and inhibited ASK1 phosphorylation. Second, C-terminal coiled-coil domain, which is required for the full activation, might also be inhibited by CREG. Third, activation of ASK1 forms a complex with not only ASK1 but also various proteins in the cell, so it is interesting to study whether CREG disrupt ASK1 complex.
Fatty liver is a common disease that can be divided into alcoholic fatty liver (AFL) and NAFLD according to drinking history. In China, it is important to find a therapeutic treatment strategy due to higher incidence of both AFL and NAFLD. The pathogenesis of NAFLD include insulin resistance, abnormal liver fat metabolism, mitochondrial disorder, oxidative stress, and other undefined factors, whereas those related to AFL include inflammatory reaction, oxidative stress, and nutritional imbalance. There may be a common pathogenesis for both of them, in which the “two-hit” hypothesis includes alcohol, insulin resistance, fat as a first hit, and oxidative inflammatory stress as a second hit. In detailed molecular mechanisms, the ASK-JNK signaling pathway plays an important role in pathogenesis of AFL and NAFLD. Therefore, CREG might be a new target not only for NAFLD but also for other types of metabolic liver disease relating to the ASK-JNK signaling pathway. This would be a valuable subject of future studies.
In conclusion, this study elucidates the integrated biological effects and underlying mechanism of CREG in the liver. CREG-mediated hepatic steatosis and metabolic disorders occurs via direct interaction with ASK1 and inactivation of ASK1-JNK1 signaling, thereby leading to aggravated IR, glucose metabolism disorder, lipid metabolism disorder, and hepatic steatosis.
Acknowledgment
We thank Lianfeng Zhang (Institute of Laboratory Animal Science, Chinese Academy of Medical Sciences, China) for providing the JNK1-KO (B6.129S1-Mapk8) and JNK2-KO (B6.129S2-Mapk9) mice.
REFERENCES
Author names in bold designate shared co-first authorship.


