Fading of brain network fingerprint in Parkinson's disease predicts motor clinical impairment
Funding information: Bando Ricerca Competitiva 2017, Grant/Award Number: D.R. 289/2017; European Union's Horizon 2020 Research and Innovation Program, Grant/Award Number: 945539; SNSF Ambizione Project, Grant/Award Number: PZ00P2_185716; Virtual Brain Cloud, Grant/Award Number: 826421
Abstract
The clinical connectome fingerprint (CCF) was recently introduced as a way to assess brain dynamics. It is an approach able to recognize individuals, based on the brain network. It showed its applicability providing network features used to predict the cognitive decline in preclinical Alzheimer's disease. In this article, we explore the performance of CCF in 47 Parkinson's disease (PD) patients and 47 healthy controls, under the hypothesis that patients would show reduced identifiability as compared to controls, and that such reduction could be used to predict motor impairment. We used source-reconstructed magnetoencephalography signals to build two functional connectomes for 47 patients with PD and 47 healthy controls. Then, exploiting the two connectomes per individual, we investigated the identifiability characteristics of each subject in each group. We observed reduced identifiability in patients compared to healthy individuals in the beta band. Furthermore, we found that the reduction in identifiability was proportional to the motor impairment, assessed through the Unified Parkinson's Disease Rating Scale, and, interestingly, able to predict it (at the subject level), through a cross-validated regression model. Along with previous evidence, this article shows that CCF captures disrupted dynamics in neurodegenerative diseases and is particularly effective in predicting motor clinical impairment in PD.
1 INTRODUCTION
Parkinson's disease (PD), the second most common neurodegenerative disease (Balestrino & Schapira, 2020), is clinically characterized by the presence of a broad spectrum of both motor and nonmotor symptoms (and signs). However, motor impairment remains prominent in the clinical picture (Gökçal et al., 2017). The variability of symptoms across patients, and the presence of a wide spectrum of nonmotor symptoms in each patient, suggest that the pathophysiological mechanisms affecting the brain are not restricted to a limited area but, rather, spread well beyond (Stoffers et al., 2008). Indeed, predicting clinical impairment has proven elusive so far, perhaps since the correct unfolding of the interactions among brain areas has to be taken into account. Consequently, there is a wide interest in identifying signs of suboptimal large-scale organization of the brain activity in order to improve diagnosis and clinical management.
Despite brain activity alteration being a robust finding in PD, the description of the alteration regarding the large-scale brain activity is yet to be unanimous. Recently, it was shown that large-scale brain dynamics becomes stereotyped in PD patients, lacking flexibility proportionally to hypersynchronization (Sorrentino et al., 2021), which, in turn, is a recurring finding in PD (Chen et al., 2007; Hammond et al., 2007; Little & Brown, 2014). However, several studies also reported a reduction in connectivity related to several different brain areas (Hacker et al., 2012; Helmich et al., 2010; Rucco et al., 2021; Tessitore et al., 2012). In summary, altered brain activity is a main finding in PD, and it is often related to the beta band. We expect that such an alteration may compromise the identification of the individuals based on their connectomes, and that this characteristic may be proportional to the clinical condition of the specific patient. Based on this reasoning, the clinical connectome fingerprint (CCF) has been recently developed to analyze reduced identifiability in patients affected by amnestic mild cognitive impairment. In particular, CCF was able to predict the individual cognitive impairment, assessed through Mini-Mental State Examination (Sorrentino et al., 2021). In a similar study, which involved individuals affected by amyotrophic lateral sclerosis, the same approach was able to find a relationship between the CCF and the disease progression of the patients (Romano et al., 2022).
In this work, we hypothesized that the CCF would be a sensible candidate to extract patient-specific brain features, in order to predict clinical impairment in PD. To test this hypothesis, we used source-reconstructed magnetoencephalography (MEG) signals. We performed two separate recordings for each subject of both healthy and PD groups. After filtering the source-reconstructed data in the canonical frequency bands, we used the phase linearity measurement (PLM) (Baselice et al., 2019) to estimate the synchronization between regions, obtaining frequency-specific connectomes. Then, we estimated the identifiability rate of each group, based on the Pearson's correlations between connectomes. As PD commonly exhibits altered synchronization in the beta band, this was the frequency where we mainly expected reduced identifiability. The heterogeneity of the patients' connectomes was analyzed through a multilinear regression model in order to understand whether it was related to specific factors (e.g., age, clinical subtypes, pharmacological treatment). Furthermore, we compared the similarity between each patients' connectome with the healthy group's connectomes, thereby obtaining a “clinical fingerprinting” score (Iclinical) for each patient. Since more stereotyped brain dynamics has been linked to the clinical impairment in PD, we then used the Iclinical scores to predict motor clinical impairment, as assessed using the Unified PD Rating Scale part III (UPDRS-III). To this end, we built a multilinear regression model to compare the predicted and the observed UPDRS-III scores (Goetz et al., 2007).
2 METHODS
2.1 Participants
We recruited 47 patients (30 males, 17 females) affected by PD, with a mean age of 65 years (±9.7), and a mean education of 11.3 years (±4.2). The diagnosis of PD was fulfilled in accordance with the United Kingdom Parkinson's Disease Brain Bank criteria (Gelb et al., 1999). Inclusion criteria were: (a) PD onset after the age of 40 years, to exclude early onset Parkinsonism and (b) modified Hoehn and Yahr (H&Y) (Hoehn & Yahr, 1998) stage ≤ 2.5. Exclusion criteria were: (a) dementia associated with PD according to consensus criteria and (b) any other neurological disorder or clinically relevant medical condition. Disease severity was assessed through a motor examination in “off-state,” using both the UPDRS-III (Goetz et al., 2007), and the H&Y stages. Forty-seven healthy subjects (HS) were recruited as well, matched for gender (30 males, 17 females), age (61.8 ± 10 years), and education (12.9 ± 4.6 years). All the recruited individuals were right-handed. The study was performed in accordance with the Declaration of Helsinki, and all the participants signed an informed consent. The local Ethic Committee of University of Naples “L. Vanvitelli” approved the study.
2.2 MEG acquisition
All the participants underwent an MEG scan, composed of 154 magnetometers, and 9 reference sensors, placed in a magnetically shielded room (AtB Biomag UG, Ulm, Germany). Before each acquisition, we used Fastrak (Polhemus) to record head reference points like in Liparoti et al. (2021). This allowed us to locate the position of the head during the acquisition. Participants were recorded during resting state with eyes closed. PD patients were recorded while in “off-state,” after a 14-h washout period. Two recordings, 3.5 min long, were separated by a short break roughly 2 min long. This amount of time is a tradeoff which allows to record enough signal and prevent drowsiness of the subject (Fraschini et al., 2016; Gross et al., 2013). Electrocardiographic (ECG) and electro-oculographic (EOG) signals were acquired in order to remove physiological artifact (Gross et al., 2013). Signals were sampled at 1024 Hz after anti-aliasing filtering.
2.3 Magnetic resonance imaging
Eighty participants underwent magnetic resonance imaging (MRI). A 1.5-T SIGNA Explorer scanner equipped with an eight-channel parallel head coil (GE Healthcare, Milwaukee, WI, USA) was used. Specifically, three-dimensional T1-weighted images (gradient-echo sequence inversion recovery prepared fast spoiled gradient recalled-echo, time repetition = 8.216 ms, TI = 450 ms, TE = 3.08 ms, flip angle = 12, voxel size = 1 × 1 × 1.2 mm3; matrix = 256 × 256) were recorded. From the total of 94 subjects recruited, 7 patients and 7 healthy individuals refused/were unable to undergo MRI, and a standard template was used for source reconstruction.
2.4 Preprocessing
Preprocessing and source-reconstruction was performed similarly as in Sorrentino et al. (2021). In short, a fourth-order Butterworth IIR band-pass filter was implemented, using the Fieldtrip toolbox in MATLAB (Oostenveld et al., 2011), in order to filter the data in the 0.5–48 Hz range. Then, through the principal component analysis (De Cheveigné & Simon, 2007), we orthogonalized the signals with respect to the reference signals. Then, an experienced rater identified and removed noisy signals and segments after visual inspection. Finally, supervised independent component analysis (Barbati et al., 2004) was performed to identify the ECG and, if present, the EOG components present in the MEG signals.
2.5 Source reconstruction
We co-registered the MEG data with the native MRI of each subject. Then, we obtained the time series of 116 regions of interest (ROIs), based on the AAL atlas (Gong et al., 2009), using the volume conduction model proposed by Nolte (Nolte, 2003), and applying the linearly constrained minimum variance (Van Veen et al., 1997) beamformer algorithm included in the Fieldtrip toolbox (Oostenveld et al., 2011). The resulting time series were band-pass filtered in each canonical frequency band (i.e., delta [0.5–4 Hz], theta [4–8 Hz], alpha [8–13 Hz], beta [13–30 Hz], and gamma [30–48 Hz]). Only 90 ROIs were selected for further analysis, since we excluded ROIs related to the cerebellum because of low reliability.
2.6 Synchrony estimation
Synchronization was estimated through the PLM, measuring the phase difference in time between brain regions (Sorrentino et al., 2019). In short, the PLM is based on the spectrum of the interferometric signal between pairs of brain regions, and it is unaffected by volume conduction. Its values range from 0 (no synchronization) to 1 (synchronization). Computing the PLM between each couple of regions we obtained, per each frequency-band, two functional connectomes (FCs) (one per recording segment), that we named test and retest.
2.7 Fingerprint analysis
To evaluate the fingerprinting in our population, we employed an approach based on FCs, as originally proposed in Sorrentino et al. (2021). First, we aimed to create an identifiability matrix (IM) (Amico & Goñi, 2018) (Figure 1). The IM features the participants on rows and columns, while the entries are the Pearson's correlation coefficient between the test and retest FCs of each participant. The IM contains information on self-similarity (I-self, the main diagonal elements), which represent the test and retest connectomes comparison of the same participant, and similarity of each subject with the others (I-others, off diagonal elements), that represent the similarity between different individuals. Computing the difference between the mean I-self and the mean I-others, we can obtain the differential Identifiability (I-diff) (Amico & Goñi, 2018; Sorrentino et al., 2021). This score offers an estimation of the fingerprint level of a specific data set. Furthermore, we calculated the success rate (SR) value, to determine the percentage of identifiability of the subjects within a group. It was computed observing the percentage of times that each subject displayed an I-self value higher than the I-others values tested on the corresponding row and column. Finally, crossing the test–retest FCs of the healthy individuals and of the patients, it is possible to obtain the Iclinical score (“clinical identifiability,” or “clinical fingerprint”). This score represents the similarity of a patient with respect to the healthy subjects. For further details, please refer to Sorrentino et al. (2021).
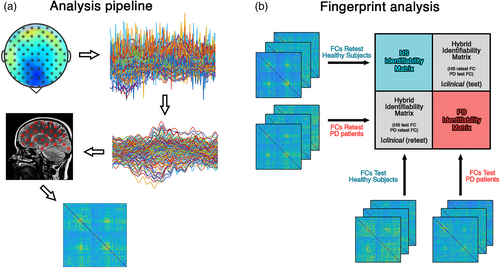
The heterogeneity of the patients' FCs (represented by the I-others), was further investigated to understand whether it could be related to demographic or clinical characteristics. In particular, a multilinear regression model for the prediction of individual I-others was built, using the following variables as predictors: age, education, gender, disease duration (in months) clinical subtypes (tremor dominant [TD]; postural instability gait difficulty [PIGD]) (van Rooden et al., 2011), depression level (Beck Depression Inventory [BDI]) (Beck et al., 1996), cognition (Montreal Cognitive Assessment [MoCA]) (Nasreddine et al., 2005), levodopa equivalent daily dose (LEDD) (Julien et al., 2021), and UPDRS-III score. We validated our model using the k-fold cross-validation with k = 5 (Varoquaux et al., 2017). This approach consists in randomly splitting the sample in five groups that were used alternatively as training group or test group. This allowed to increase the generalizability of the model and reduced the risk of overfitting. The variance inflation factor (VIF) was calculated to check for multicollinearity (Belsley et al., 2005). All the values were z-scored to make the beta coefficients comparable.
2.8 Regions of interest for fingerprint
Borrowing from previous work on identifiability (Amico & Goñi, 2018), we used the intraclass correlation coefficient (ICC) (Koch, 2004) to quantify the edgewise reliability of individual connectomes. Edges display high ICC values if they keep similar values of synchronization across the test–retest sessions. Hence, edges that are steady might contribute more to the overall identifiability. Then, we performed the fingerprint analysis sequentially adding edges according to their ICC values. We added 100 edges at each iteration, and computed the SR values at each iteration. To check that the selected edges were in fact the most relevant ones in terms of identification, we built a null model for each group (HS and PD), selecting 100 times at each iteration a set of randomly chosen edges, and then performing the fingerprint analysis on those, building a null-distribution of SR values.
2.9 Edges of interest for clinical predictions
Furthermore, we tested the hypothesis that the Iclinical score based on a subset of edges could predict the clinical condition of the patients. Hence, we built a multilinear regression model to predict the UPDRS-III scores from the Iclinical values (Shen et al., 2017). We added multiple covariates to the model, in order to account for the effect of age, education, gender, disease duration, clinical subtypes, BDI, MoCA, and LEDD. Multicollinearity was assessed through VIF (Belsley et al., 2005). The values of each variable were z-scored to make the beta coefficients comparable. We validated our model using the k-fold cross-validation with k = 5 (Varoquaux et al., 2017). Furthermore, each iteration of k-fold was repeated 100 times and the result was averaged in order to reduce the variability given by the random split procedure. To check if a subset of edges were mostly responsible for the prediction of the UPDRS-III we computed the model multiple times, adding 100 edges at each iteration, according to their ICC value (in descending order), and calculating the corresponding Iclinical. Furthermore, at each iteration, 100 surrogate models were computed, each based on the Iclinical computed on a random selection of edges. At each iteration, the Spearman's correlation coefficient between predicted and actual UPDRS values was calculated and considered as a prediction score.
2.10 Statistics
Statistical analysis was carried out in MATLAB 2020a. I-self, I-others, and I-diff values were compared between the two groups. The comparisons were performed through permutation testing, by randomly rearranging the labels of the two groups 10,000 times (Sareen et al., 2021). The absolute value of the difference was computed at each iteration, obtaining a distribution of the randomly determined differences (Nichols & Holmes, 2002). This distribution was compared to the observed differences to retrieve a statistical significance. The possible relationships between variables were investigated using Pearson's correlation. Results were corrected by false discovery rate (FDR) correction (Benjamini & Hochberg, 1995). Significance level was set at p-value <.05 after correction.
3 RESULTS
We analyzed the fingerprinting of FCs (Figure 1a) in a cohort of 94 subjects, which included 47 HSs and 47 patients with PD. To this end, we used the FCs of each group to build an IM like in Sorrentino et al. (2021) (Figure 1b). Identifiability parameters (i.e., I-self, I-others, and I-diff) were compared between the two groups, while the clinical identifiability (Iclinical) was used to investigate the relationship between identifiability and clinical impairment in PD.
3.1 Connectome fingerprint
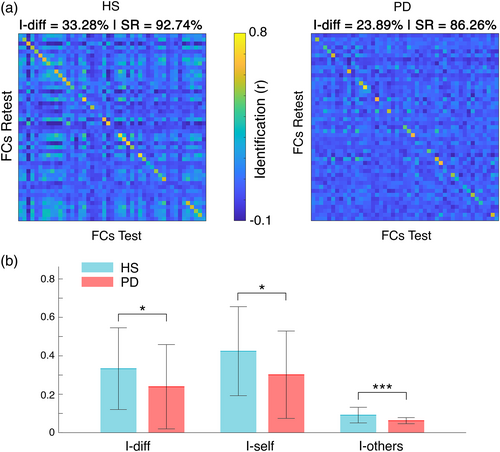
Identifiability parameters between PD patients and healthy subjects showed significant differences in the beta band (Figure 2). Specifically, HS displayed higher I-diff (HS = 0.33 ± 0.21; PD = 0.24 ± 0.22; pFDR = .034), I-self (HS = 0.42 ± 0.23; PD = 0.3 ± 0.23; pFDR = 0.017), and I-others (HS = 0.09 ± 0.04; PD = 0.06 ± 0.02; pFDR < .001) scores compared to PD patients. As a whole, patients showed lower differential identifiability (i.e., I-diff). Moreover, it is noteworthy that healthy individuals displayed high self-similarity despite being more similar among themselves with respect to patients.
3.2 Edge-based identifiability
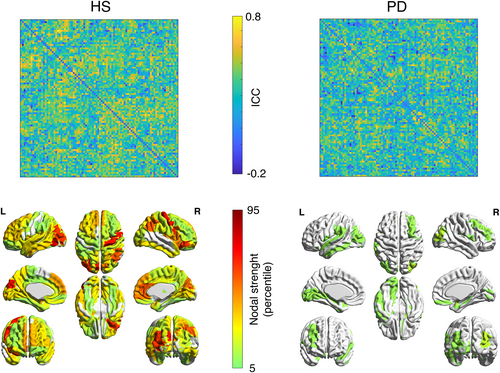
Assessing the contribution of individual FC's edges in determining the level of fingerprinting (Sorrentino et al., 2021), we observed two different behaviors in HS and PD groups (Figure 3). First, in healthy individuals, many edges have high values of ICC, hence contributing to the identification, while in the patients group the edges have generally lower values, and a few, scattered edges contribute to the identifiability. All in all, this analysis indicates a more stable edges' connectivity in healthy subjects, across the test–retest sessions.
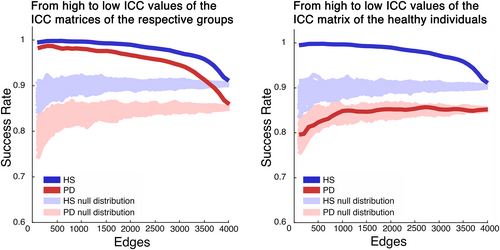
Moreover, we calculated the average SR value of each group, by investigating the percentage of identifiability of each subject within its own group. Hence, we analyzed the distribution of SR values in the fingerprint analysis performed adding 100 edges per iteration, from the most to the least stable ones, according to the ICC matrices of each group. Figure 4 shows that the HS group displays a complete SR (100%), with a result that slowly decreases when adding more edges. Conversely, the PD group's SRs did not reach the same values of the HS group, and the values never reached a stable level, and with a faster decrease. As a reliability test to our approach, we performed a surrogate analysis, this time adding edges in random order, obtaining a null distribution of SR values that were to be expected given a random selection of edges (Figure 4, left panel). As evident, the SR was always above chance level, thereby showing that the selected edges carry relevant information to identify subjects. Furthermore, we observed the SR values distribution of the PD group, when ordering the regions according to the ICC matrix of the HS (Figure 4, right panel). In this case, the patients' SR values dropped compared to the distribution performed according to the ICC matrix of the patients themselves, and was nearly invariably within the null distribution, hence confirming that edge specificity is lost in PD.
3.3 Clinical features of fingerprinting
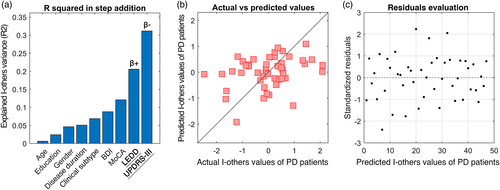
Considering the heterogeneity expressed by PD patients, we set out to investigate whether there were demographic or clinical elements related to this feature. The multilinear model built for I-others predicted 31% of its variance, with significant contribution of LEDD (p = .0356, β = .36) and UPDRS-III (p = .0224, β = −.38). Prediction performance and residuals distribution with the k-fold validation are shown in Figure 5b,c, respectively. None of the remaining variables significantly contributed to the prediction.
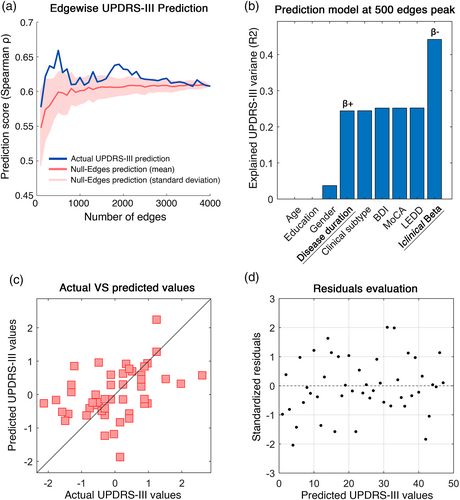
Finally, in order to verify the clinical value of this approach, we tried to predict the UPDRS-III scores, relying on the Iclinical values in the beta band. Based on the hypothesis that clinical prediction may mostly reliant on subset of edges like in Sorrentino et al. (2021), we built edge-based multilinear models including the Iclinical calculated with a growing subset of edges (from 100 to full FC, adding 100 more at each iteration) as predictor. Age, education, gender, and disease duration were added as predictors as well, while the UPDRS-III was set as response variable. The highest similarity between actual and predicted UPDRS-III scores was observed at 500 edges (Spearman ρ = 0.59). Indeed, the model explained 44% of the variance of the UPDRS-III (R2 = .44) (Figure 6b). Both the Iclinical (p = .001, β = −.48) and the disease duration (p = .0108, β = .4) significantly contributed to the predictions. Individual predictions and the distribution of the residuals obtained through the k-fold validation method (Varoquaux et al., 2017) are shown in Figure 6c,d, respectively. No significant contribution of the remaining predictors was observed.
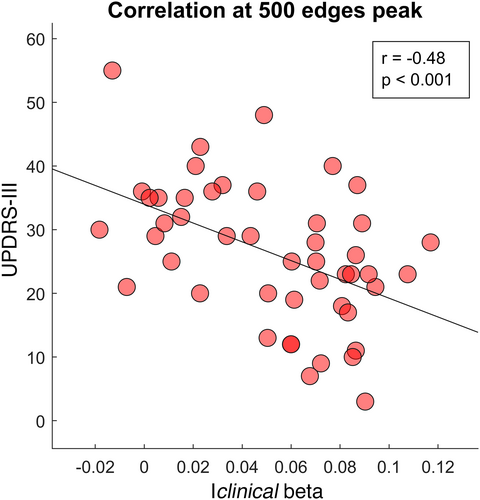
Furthermore, we specifically observed the relationship between the clinical fingerprint in the beta band and the motor condition of our patients. The correlation test between the Iclinical at 500 edges peak and the UPDRS-III scores highlighted a significant negative correlation between the two parameters (r = −.48, p < .001), as shown in Figure 7.
Finally, the main analyses were repeated using the AAL3 atlas (Rolls et al., 2020), as to test the reliability of our findings. Fingerprint features comparisons (I-diff, I-self, I-others), the multilinear regression model prediction of UPDRS-III through the Iclinical in the beta band and disease duration, and the significant correlation between the Iclinical in the beta band and UPDRS-III, were all confirmed and displayed in detail in supplementary materials.
4 DISCUSSION
In this study, we set out to investigate whether the changes induced by PD in the large-scale brain connectivity could reflect into reduced connectome-based identifiability of patients. We tested this hypothesis within the recently developed framework of the clinical connectome fingerprinting (Amico & Goñi, 2018), comparing the identifiability of patients with PD and matched controls. We therefore extracted a clinical fingerprinting score for each patient (Sorrentino et al., 2021), and exploited it to predict motor impairment in each patient, working under the hypothesis that lower identifiability would be linked to dysregulated functional connectivity.
The fingerprinting analysis was conducted by comparing the connectomes in the test/retest sessions of the participants, in each group (i.e., PD and HS) separately. The connectomes were calculated using the PLM to measure synchronization (Baselice et al., 2019) in each of the canonic frequency bands. Significant results were exclusively found in the beta band. As mentioned above, the beta band is consistently reported as altered in PD (Hammond et al., 2007). Our results showed that the PD patients displayed lower differential identifiability compared to the healthy individuals (Figure 2). Hence, the healthy connectomes are more recognizable and subject-specific. In detail, the patients showed both lower I-self and I-others scores. On the one hand, the lower I-self indicates lower similarity between the two connectomes belonging to one subject. On the other hand, the reduced I-others represents greater heterogeneity among the connectomes of the PD group. However, the I-self showed greater reduction as compared to the I-others. We speculated that this feature might be caused by the loss of the subject-specific fine-tuning of large-scale dynamics, which reflects itself primarily on the loss of similarity of a subject with him/herself, rather than of a subject with the other subjects. In PD, dopamine depletion is able to alter the brain network organization and its dynamics, and this approach may be able to catch one of the features of the unstable brain activity occurring in patients' connectomes (Olde Dubbelink et al., 2014; Shine et al., 2019; Sorrentino et al., 2021). Indeed, the reduced similarity of subsequent MEG recordings may be a consequence of the dysregulated brain activity occurring in the beta band in PD (Little & Brown, 2014).
Furthermore, the edge-specific reliability of the connectomes dropped drastically in PD patients, and reflected itself in much lower nodal stability (Figure 3). It is crucial to note that ICC matrices show the reliability of the communication between brain regions, but not the magnitude of the connectivity itself. Hence, we retrieve information that is complementary to the one related to connectivity. In summary, our results suggest that several brain regions contribute to the identifiability in the healthy controls, while only a few do so in PD. In particular, it can be observed that the motor regions provide a major contribution to the identifiability of healthy individuals, but not to that of PD patients. Once again, the abnormal activity patterns clustered in the motor regions, which are particularly affected in PD patients (Figure 3), may lead to the reduced contribution to the identifiability. To date, the quality of the alterations (in the sense of hypo/hyperactivation) related to the regions involved in the PD motor patterns is still debated (Herz et al., 2021). With regard to the motor cortex, several studies reported controversial results when comparing PD patients and healthy controls. Indeed, using functional MRI, Buhmann et al. (2003), and Grafton (2004) showed hypoactivation, while Haslinger et al. (2001), and Sabatini et al. (2000) reported hyperactivation. However, our approach did not focus on the connectivity itself; rather, we estimated how stable it is across multiple recordings of subjects belonging to the same group. Nevertheless, even in this case, beta band activity in PD connectomes revealed alterations, in terms of stability and identifiability.
Then, we observed the behavior of identifiability as a function of the number of edges utilized to perform it. In both groups, the identifiability was higher when only taking into account a subset of edges, and not the complete FC. Furthermore, following the inclusion of a minimum number of edges, the healthy individuals reached a complete and stable subject recognition, while the patients lacked to do so. A possible explanation would be that the full connectome contains more redundant information, that is, patterns that are not subject-specific but, rather, shared by multiple subjects (Figure 4). Indeed, several studies focused on the analysis of patterns of intersubject variability, reporting the presence of a global common organization in conjunction with subject-specific patterns (Gratton et al., 2018; Laumann et al., 2015; Mueller et al., 2013). Hence, considering that there is a concordance across subjects over the edges that contribute to the identification, one might further speculate that subject-specific information is contained preferentially in specific functional patterns. Furthermore, the altered activity in the beta band might contribute to the lack of identifiability in the PD group (Little & Brown, 2014). In other words, impairment of the fine-tuned regulation of the large-scale activity of the brain might make the system unable to keep its (presumably) optimal trajectory. This would in turn result in higher variability and, thus, reduced individual identifiability. Indeed, this result is in accordance with our previous interpretation of the ICC matrices (Figure 3).
In order to provide a functional interpretation to our results, we examined the contribution of the LEDD and the UPDRS-III to the heterogeneity of the patients' FCs (Figure 5). The positive coefficient of LEDD means that the higher the LEDD, the higher the similarity of a patient to the other patients. This result suggests that higher levodopa dosage induces a levodopa-dependent reorganization of the brain network that, as a consequence, makes the patients more similar among themselves (perhaps shifting them all toward the presumably optimal healthy condition). However, since our patients were recorded after a levodopa washout (14–15 h), this would mean that the network reorganization (or part of it) remains even after the washout. With regard to the UPDRS-III, we observed a negative coefficient for the prediction. This means that the higher the clinical impairment, the lower the similarity with other patients. As a consequence, the brain network of patients with high impairment presents unique patterns with respect to the ones of low-impairment, that in turn are more similar among themselves (alike the healthy controls). First, we notice, at a minimum, a fairly stringent internal coherence across these results, which are in line with the idea that patients with greater impairment develop higher heterogeneity. Furthermore, the model suggests that levodopa promotes the establishment of a common pattern in PD patients. The remaining predictors were not predictive. However, although these variables seem to have no effect in predicting changes in the FC, it is of note that recent approaches to personalized medicine in PD advise to take into consideration several different elements (e.g., lifestyle, clinical subtypes, genotypes, etc.) when tailoring a therapy (Marras et al., 2020; Titova & Chaudhuri, 2017). Our results warrant further investigation including OFF and ON conditions, in order to evaluate the fingerprint differences in both states, and the possible contribution of all variables.
Subsequently, we wondered if the altered fingerprint of PD subjects could be related to the clinical picture of the disease. Similarly to a previous study (Sorrentino et al., 2021), we used the Iclinical score in beta band to predict the motor impairment typical of PD, as assessed using the UPDRS-III. In particular, we observed that 500 edges was the number of edges that maximized the prediction (Figure 6). We found that our model could explain nearly 44% of the variance of the UPDRS-III scores across individuals. Even when accounting for nuisance variables such as age, level of instruction, disease duration, LEDD, and so forth, the Iclinical significantly improved the performance of the model. Besides the Iclinical, disease duration also contributed to the predictions. Given the negative beta-coefficient of the Iclinical, we can conclude that the more the identifiability of a PD patient's connectome is similar to that of the HS group, the milder its motor impairment. Noteworthy, these results were validated with a k-fold cross-validation that reduced the risk of overfitting.
It should be noticed that the edges that were relevant for the clinical identification were also the ones responsible for the prediction of the UPDRS-III. In both edge-based analyses (i.e., identification and clinical motor score prediction), the edges were ordered in the same way and in both cases the best performance was obtained considering only a few hundreds of edges. Hence, there is substantial overlap between the edges that allow identification and those that allow the clinical prediction. This points toward the clinical validity of this approach, showing that the selected edges were related to a functional outcome. This result once more supports the idea that the loss of stability that leads to lower identifiability might be related to mechanisms that are pathophysiologically relevant in PD. In fact, several studies showed a correlation between brain connectivity features in the beta band and motor impairment (Neumann et al., 2017; Tinkhauser et al., 2017). Furthermore, we also demonstrated the inverse linear relationship occurring between the Iclinical in the beta band and the UPDRS-III scores (Figure 6). Our results are in line with these findings and demonstrate that in PD, the connectome-based identifiability conveys the severity of the disease. Since the UPDRS-III is one of the most reliable and used motor scales in the clinical settings (Balestrino et al., 2019; Holden et al., 2018), we believe that a scalar score, based on the whole connectome conveying subject-specific features of the brain functional connectivity may be of help in the management of the disease.
However, some limitations of this work have to be highlighted. To date, the potential of this approach in diagnostics has not been tested, albeit its ability to correlate with phenomenological characteristics of specific diseases shows promise for future studies. In fact, further studies in different populations and conditions (e.g., OFF–ON states) are warranted in order to evaluate the usefulness of this approach in the diagnostic process.
In conclusion, we applied the fingerprint approach to PD, showing that the subject-specific brain network recognition is linked to the clinical condition. First, we highlighted the lower identifiability of the patients with respect to the healthy individuals. Furthermore, we showed that the degree of the connectome-based identifiability of the patients (with respect to the healthy population) is related to their clinical motor condition. Importantly, all the results were observed within the beta band, which is known to be highly involved in PD. We hope that the individualized information provided by this approach may inspire further studies specifically addressed to improve the diagnostic process.
ACKNOWLEDGMENTS
G.S. acknowledges financial support from University of Naples “Parthenope” within the Project “Bando Ricerca Competitiva 2017” (D.R. 289/2017). V.J. and P.S. acknowledge financial support from European Union's Horizon 2020 Research and Innovation Program under grant agreement 945539 (SGA3) Human Brain Project and from grant agreement No. 826421 Virtual Brain Cloud. E.A. acknowledges financial support from the SNSF Ambizione Project “Fingerprinting the brain: Network science to extract features of cognition, behaviour and dysfunction” (grant number PZ00P2_185716).
CONFLICT OF INTEREST
The authors declare no conflict of interests.
PATIENT CONSENT STATEMENT
The study was performed in accordance with the Declaration of Helsinki, and all the participants signed an informed consent.
Open Research
DATA AVAILABILITY STATEMENT
The data are available upon request to the corresponding author (Pierpaolo Sorrentino), conditional on appropriate ethics approval at the local site. The availability of the data was not previously included in the ethical approval, and therefore data cannot be shared directly. In case data are requested, the corresponding author will request an amendment to the local ethical committee. Conditional to approval, the data will be made available.


