The role of ATP citrate lyase in myelin formation and maintenance
Abstract
Formation of myelin by Schwann cells is tightly coupled to peripheral nervous system development and is important for neuronal function and long-term maintenance. Perturbation of myelin causes a number of specific disorders that are among the most prevalent diseases affecting the nervous system. Schwann cells synthesize myelin lipids de novo rather than relying on uptake of circulating lipids, yet one unresolved matter is how acetyl CoA, a central metabolite in lipid formation is generated during myelin formation and maintenance. Recent studies have shown that glucose-derived acetyl CoA itself is not required for myelination. However, the importance of mitochondrially-derived acetyl CoA has never been tested for myelination in vivo. Therefore, we have developed a Schwann cell-specific knockout of the ATP citrate lyase (Acly) gene to determine the importance of mitochondrial metabolism to supply acetyl CoA in nerve development. Intriguingly, the ACLY pathway is important for myelin maintenance rather than myelin formation. In addition, ACLY is required to maintain expression of a myelin-associated gene program and to inhibit activation of the latent Schwann cell injury program.
1 INTRODUCTION
Myelin formation involves myelin protein expression and lipid biosynthesis, coordinated with changes in cytoskeletal and extracellular matrix architecture. Myelin development is dictated by axoglial signaling and several key transcription factors such as EGR2, SOX10, and Hippo-regulated co-activators YAP/TAZ (Meijer & Svaren, 2013; Poitelon et al., 2016; Sock & Wegner, 2019). However, the pathways that coordinate the metabolic transitions of Schwann cells and oligodendrocytes are only partially elucidated (Bouçanova & Chrast, 2020; Poitelon et al., 2020).
Myelin production in Schwann cells and oligodendrocytes depends to a large degree on endogenous lipid synthesis rather than uptake of lipids from the circulation (Monnerie et al., 2017; Montani et al., 2018; Poitelon et al., 2020; Saher et al., 2005; Schmitt et al., 2015). Myelin is quite stable once formed, but lipid biosynthetic enzymes nonetheless stay elevated in mature Schwann cells, and there is significant turnover of myelin lipid that requires ongoing maintenance (Buscham et al., 2019; Cermenati et al., 2015; Verheijen et al., 2009; Zhou et al., 2020).
Transcriptional networks that promote myelination in Schwann cells regulate genes encoding lipogenic enzymes using several transcription factors, such as SREBP1/2, EGR2, SOX10, YAP/TAZ, and MAF (Kim et al., 2018; LeBlanc et al., 2005; Monnerie et al., 2017; Montani et al., 2018; Poitelon et al., 2016; Srinivasan et al., 2012; Verheijen et al., 2009). These networks include genes that generate acetyl CoA for lipid synthesis in the cytoplasm and for nuclear histone acetylation that supports gene regulation and other metabolic switches.
The canonical pathway of acetyl CoA generation involves mitochondrial metabolism of glycolysis-derived pyruvate that ultimately transfers acetyl CoA to the cytoplasm via the citrate shuttle (Figure 1). While glucose is often the source of acetyl CoA via mitochondrial metabolism, a Schwann cell-specific knockout of pyruvate dehydrogenase (Pdha1)—an enzyme required to feed glycolysis-derived pyruvate to the TCA cycle in mitochondria—had no effect on myelin formation (Della-Flora Nunes et al., 2017). This surprising finding indicated that glucose is not required for generation of cytosolic acetyl CoA for myelin lipid synthesis, and also highlights the important gap that the source of acetyl CoA for myelination in vivo is currently undefined.
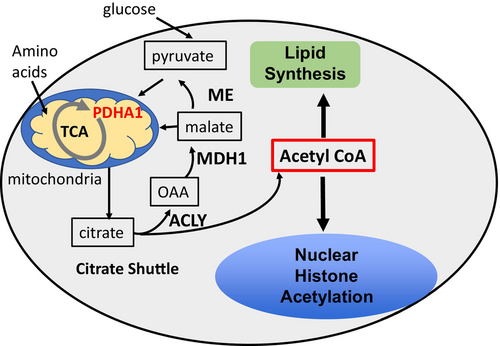
While glucose contribution to acetyl CoA is not required for myelination, other substrates (e.g., glutamine/other amino acids, fatty acids) are metabolized in mitochondria and can be exported as citrate to generate cytosolic acetyl CoA. ATP citrate lyase (ACLY) is a core component of the citrate shuttle that generates cytosolic acetyl CoA from mitochondrial sources for lipid synthesis and protein (histone) acetylation (Figure 1). Since ACLY is a critical gateway for mitochondrial export of acetyl CoA, we employed a Schwann cell-specific deletion of Acly to reveal if myelination depends upon mitochondrial TCA cycle metabolism to produce cytosolic acetyl CoA through the citrate shuttle.
2 METHODS
2.1 Mouse experiments
Animal experiments were performed according to protocols approved by the University of Wisconsin Animal Care and Use Committee. The mouse strain used for this research project, STOCK Aclytm1.1Welk/Mmjax, RRID:MMRRC_043555-JAX (Zhao et al., 2016), was obtained from the Mutant Mouse Resource and Research Center (MMRRC) at The Jackson Laboratory, an NIH-funded strain repository, and was donated to the MMRRC by Kathryn Wellen, Ph.D., University of Pennsylvania. The Acly floxed allele was maintained on the C57BL/6 genetic background and mated to mP0TOTA-Cre (Mpz-cre) (Feltri et al., 1999). Primers used to genotype the floxed AclyExon9-flox allele flanked the loxP site in Intron 8: 5’-CCCTCAGAAGGTCAGAGAACA-3′, 5’-CAGCAGGAGAGCTAGGACCA-3′. Primers used to genotype the Mpz-Cre transgene were the universal Cre recombinase primers: 5’-GAGTGATGAGGTTCGCAAGA-3′, 5’-CTACACCAGAGACGGAAATC-3′.
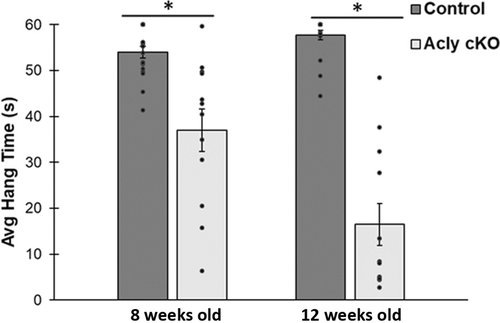
For the inverted screen test, control (n = 9 males, 9 females) and Acly cKO (N = 5 males, 7 females) were tested at 8-week-old, and again at 12-week-old, for their ability to hang on to a wire mesh screen while upside down. Mice were placed, one at time, on a piece of 1 cm × 1 cm wire mesh screen, the screen was inverted, and laid across the top of a stainless-steel box. A timer was started as the screen was inverted, and stopped when the mouse fell or at 60 s at which point the hang test was stopped. Every mouse was tested five times and every mouse had at least a 10 min rest between each test. The screen and stainless-steel box were cleaned with 70% ethanol after each test.
2.2 Morphometric quantification of myelination
Freshly dissected sciatic or femoral motor/sensory nerves at 2 or 5 weeks of age were immersion fixed in a solution of 2.5% glutaraldehyde, 2.0% paraformaldehyde in 0.1 M sodium phosphate buffer, pH 7.4, overnight at 4°. The nerves were then post-fixed in 1% osmium tetroxide in the same buffer for 2 h at room temperature. The nerves were dehydrated in a graded ethanol series, further dehydrated in propylene oxide, embedded in Epon resin, and cut into semithin transverse sections. For transmission electron microscopy (TEM) imaging, semithin sections were contrasted with Reynolds lead citrate and 8% uranyl acetate in 50% ethanol and imaged with a Philips CM120 electron microscope with an AMT BioSprint side-mounted digital camera at the UW Medical School Electron Microscope Facility.
To assess myelin thickness, semithin sections of femoral motor nerve were first stained with either toluidine blue or paraphenylenediamine (PPD) and imaged with a Nikon Ti2 microscope. Blinded observers assessed the quantity and nature of the myelin sheaths (amyelinated axons, abnormal myelination, infolding/outfoldings), and quantified g-ratios, which is a ratio of the axon diameter to the myelinated fiber diameter, using Myeltracer (Kaiser et al., 2021), excluding irregularly shaped axons. The entire femoral motor nerve was used for the analysis. Statistical analysis used Student's t test assuming equal variances or Mann Whitney to determine significance.
2.3 Western blot
- ACTB—LsBio, LS-C814520 1:1000
- JUN—Cell Signaling Technology, 9165 1:2000
- EGR2—Abcam, ab108399 1:500
- Histone H3—Cell Signaling Technology,3638 (1:1000)
- H3K27me3—EMD Millipore,07-449 (1:1000)
- H3K27ac—Active Motif,39133 (1:1000)
- H2AK119ub—Cell Signaling Technology,8240 (1:1000)
2.4 RNA seq
Using control and Acly cKO mice at 5 weeks of age (n = 3 Acly cKO/2 controls), RNA was purified from sciatic nerves using the Zymo RNA Clean & Concentrator-5 (#R1013), and 00 ng total RNA was sent to Novogene for library preparation after PolyA selection and Illumina sequencing (Novaseq 6000). Messenger RNA was purified from total RNA using poly-T oligo-attached magnetic beads. After fragmentation, the first strand cDNA was synthesized using random hexamer primers, followed by the second strand cDNA synthesis.
Reads were aligned to GRCm38/mm10 genome using Hisat2 (Mortazavi et al., 2008). FeatureCounts v1.5.0-p3 was used to count the reads numbers mapped to each gene. And then FPKM of each gene was calculated based on the length of the gene and reads count mapped to this gene. Fragment per Kilobase millions (FPKM), expected number of fragments per kilobase of transcript sequence per Million base pairs sequenced.
Data were analyzed using DESeq2 v1.20.0 (Anders et al., 2013) to determine differentially regulated genes between wild type and Acly cPKO mice (p < .05). The resulting p-values were adjusted using the Benjamini and Hochberg's approach for controlling the false discovery rate. Genes with an adjusted p-value ≤ .05 found by DESeq2 were assigned as differentially expressed. RNA-seq data are deposited in NCBI GEO under accession number GSE252209.
Gene ontology (GO) enrichment analysis of differentially expressed genes was implemented by the clusterProfiler R package, in which gene length bias was corrected. GO terms with corrected p value less than .05 were considered significantly enriched by differential expressed genes. We used clusterProfiler R package to test the statistical enrichment of differential expression genes in KEGG (Kanehisa et al., 2023) pathways.
2.5 Lipidomics
Sciatic nerve samples were collected and processed by the Mass Spectrometry Core Facility in the UW Biotechnology Center. Tissues were placed in bead-beating tubes (Qiagen PowerBead tube containing 1.4 mm ceramic beads, cat. # 13113-50), and the lipid extraction protocol (Matyash et al., 2008) employed extraction in a solution of 250 μL phosphate-buffered saline (PBS), 225 μL methanol containing internal standards (Avanti SPLASH LipidoMix (cat. # 330707-1EA) at 10 μL per sample) and 750 μL methyl tert-butyl ether (MTBE). Samples were then subjected to 4 cycles of homogenization (Qiagen TissueLyzer II) at 30 Hz for 40 s, with a 5 min rest at 4°C between cycles. After this initial homogenization step, the MTBE was added and two cycles of extraction, again at 30 Hz for 40 s each with 5 min at 4°C between, were performed. After extraction there was a final rest at 4°C for 15 min. Samples were then centrifuged at 17,000 g for 5 min at 4°C. About 700 μL of the upper MTBE phase was transferred to a new 1.5 mL tube and evaporated to dryness using a speed-vac concentrator. Dried lipid samples were then reconstituted in 150 μL isopropyl alcohol (IPA). After reconstitution in IPA samples were again centrifuged at 17,000g for 15 min at 4°C. Concurrently with sample extractions, a process blank and a process blank spiked with SPLASH Lipidomix (Avanti) were prepared. During data collection, an aliquot of the NIST standard reference material SRM-1950 (https://www-s.nist.gov/srmors/view_detail.cfm?srm=1950), Metabolites in Plasma, was analyzed along with samples and process blanks to evaluate end-to-end analysis consistency. All reconstituted extracts were stored at −80°C prior to analysis.
Samples were analyzed by Ultra high performance liquid chromatography/mass spectrometry (UHPLC/MS) and UHPLC/MS/MS in positive ion and negative ion modes. The UHPLC conditions were the same for all acquisitions, regardless of ionization polarity, dilution factor, or MS level (MS or MS/MS). The solvents consisted of A: 10 mM ammonium formate, 0.1% (v/v) formic acid, 60% (v/v) acetonitrile in water; and B: 10 mM ammonium formate, 0.1% (v/v) formic acid, 9% (v/v) acetonitrile, 1% (v/v) water in 2-propanol. The column was a Waters Acquity UPLC BEH C18 1.7 μm 2.1 mm × 50 mm, with a guard column containing the same stationary phase with dimensions 2.1 mm × 5 mm. The gradient is shown in Table 1.
| Time | %A | %B | Flow |
|---|---|---|---|
| 0.00 min | 85% | 15% | 0.5 mL/min |
| 2.40 min | 70% | 30% | 0.5 mL/min |
| 3.00 min | 52% | 48% | 0.5 mL/min |
| 13.20 min | 18% | 82% | 0.5 mL/min |
| 13.80 min | 1% | 99% | 0.5 mL/min |
| 15.40 min | 1% | 99% | 0.5 mL/min |
| 16.00 min | 85% | 15% | 0.5 mL/min |
| 20.00 min | 85% | 15% | 0.5 mL/min |
The column was maintained at 50°C. Samples were placed in an autosampler held at 8°C until injection. The UHPLC was an Agilent model 1290 Infinity II with individual components consisting of a model G7120A binary pump, model G7167B multisampler, model G7116B column compartment, and model G7110B isocratic pump. The High performance liquid chromatography (HPLC) was connected to the inlet port of an Agilent G6546A Quadrupole time of flight (QTOF) mass spectrometer, incorporating an Agilent JetStream dual Electrospray ionization (ESI) source. The column effluent was delivered to the sample nebulizer of the dual ESI source, while the isocratic pump delivered internal calibrant to the reference nebulizer of the dual ESI source. QTOF parameters differed depending on the ionization polarity and MS level of the acquired data.
Lipidomic data were analyzed using Metabolanalyst 5.0 and Biopan (Gaud et al., 2021; Pang et al., 2021). Metaboanalyst settings were: missing variables were replaced by Limit of detection (LODs) (1/5 of the minimum positive value for each variable). For differential analysis, we used row-wise normalization, Log10 data transformation: and Pareto scaling. Mass spectrometry (MS) data have been uploaded to MassIVE under the accession number MSV000094670.
2.6 Quantitative Reverse transcriptase-polymerase chain reaction (RT-PCR)
The primers used were:
Acly: F TTA AAA CCA AGC CAA TAC CTG TGA; R GAT ACA GCA GGT AGC AGA GCA A.
Actb FGACTCATCGTACTCCTGCTTG; RGATTACTGCTCTGGCTCCTAG
Egr2 FTGCTAGCCCTTTCCGTTGA; R TCTTTTCCGCTGTCCTCGAT
2.7 Histone extraction and chemical derivatization
Histones were extracted from mouse sciatic nerves in one of several related methods, differing in the level of physical dissection or pulverization of the nerve and whether histone extraction was performed on whole nerves or on extracted nuclei. Most histone preparations from sciatic nerves used direct acid extraction from nerves due to low yields via nuclear isolation approaches; some of the nuclear isolation data are included. For direct acid extraction, −80°C-stored nerves (two per mouse, processed in one tube) thawing on ice in 500 μL 0.4 N H2SO4 were disrupted in a hand-held motorized pestle/microfuge tube set (Thermo Scientific, Waltham, MA) until homogenous, approximately 1 min. For the nuclei extraction method variation, sciatic nerves with epineurial dissection (and/or pulverization) were thawed (or used fresh, when available) in 800 μL of ice-cold Buffer A (10 mM Tris–HCl pH 7.4, 10 mM NaCl, and 3 mM MgCl2) supplemented with protease and histone deacetylase inhibitors (10 μg/mL leupeptin, 10 μg/mL aprotinin, 100 μM phenylmethylsulfonyl fluoride, 10 mM nicotinamide, 1 mM sodium-butyrate, and 4 μM trichostatin A) followed by 20 strokes of loose- and 20 strokes of tight-pestle homogenization in a 1 mL Wheaton dounce homogenizer and strained through a 100 μM filter before being transferred to a new 1.5 mL Eppendorf tube. Samples were then centrifuged at 800×g for 10 min at 4°C to pellet nuclei. Supernatants were transferred to fresh 1.5 mL Eppendorf tubes or discarded. The remaining nuclei pellet was resuspended in 500 μL ice-cold PBS pH 7.4 and centrifuged at 800×g for 10 min at 4°C. The supernatant was discarded and nuclei were again washed with 500 μL ice-cold PBS pH 7.4. Next, pelleted nuclei were resuspended in 500 μL of 0.4 N H2SO4, similar to the direct acid protocol. Acidified extracts (whole cell or nuclear) were rotated at 4°C for 4 h. Samples were centrifuged at 21,000×g for 5 min at 4°C to pellet debris and proteins that were not acid soluble. Supernatants were transferred to new 1.5 mL microfuge tubes and 132 μL of 100% trichloroacetic acid was added and incubated overnight at 4°C. Samples were centrifuged at 21,000×g for 5 min at 4° to pellet precipitated histone proteins. Supernatants were discarded and precipitates were washed twice with 1 mL ice-cold acetone, centrifuging at 21,000×g for 2 min at 4°C and discarding the supernatant from each wash. Trace residual acetone was allowed to evaporate at room temperature for 10 min after which dried precipitates were resuspended in water with pipet trituration. Finally, samples were centrifuged at 21,000×g for 5 min at 4°C to pellet any remaining insoluble debris; supernatants comprised of purified histones were transferred to new microfuge tubes for −80°C storage until use.
Histone samples were derivatized at lysines and digested before analysis. Each sample (5 μg) was diluted with water to a final volume of 9 μL. Triethylammonium bicarbonate (1 μL of 1 M) was added to each sample to buffer the solution to a final pH of 8–9. Next, 1 μL of 1:50 d6-acetic anhydride:H2O was added to each reaction, labeling reactive lysines and neutralizing charge; the reaction was quenched via addition of 1 μL 80 mM hydroxylamine followed by a 20 min room temperature incubation. Next, d3-acetylated histones were digested with 0.1 μg trypsin for 4 h at 37°C in a ThermoMixer with heated lid. Upon completion of trypsin digestion, 0.02 M NaOH was added to adjust the final pH to ~9–10. Prepared histone peptides were then N-terminally modified with 1 μL 1:50 phenyl isocyanate: Acetonitrile (ACN) for 1-h at 37°C. Modified peptides were desalted and eluted-off of Empore C18 extraction membrane using lab-made STAGE tips. Eluted samples were dried completely using a Thermo Fisher Scientific Savant ISS110 SpeedVac and resuspended in 40 μL sample diluent (94.9% H2O, 5% ACN, 0.1% Fatty acid (FA)). Resuspended samples were centrifuged at max speed for 5 min at 4°C after which supernatants were transferred to glass vials for LC–MS/MS analysis.
2.8 LC–MS/MS histone proteomics
We performed LC–MS/MS for histone PTM profiling using a Thermo Q Exactive Orbitrap mass spectrometer coupled to a Dionex Ultimate 3000 RSLC nano UPLC with a Waters Atlantis C18 3 μm reverse phase NanoEase column (100 μm × 150 mm) adapted to a steel emitter on a Thermo NanoSpray Flex ion source. The mobile phases contain 0.1% formic acid in UHPLC grade H2O as solvent A and 0.1% formic acid in UHPLC grade ACN as solvent B. After an initial 5′ at 5% B, the sample is eluted over a linear gradient of 5%–35% B at a flow rate of 800 nL/min over a 55′ gradient, with 2′ ramps to/from an 8′ 95% B plateau and subsequent 12′ re-equilibration to 5% B. The system alternates between MS and MS/MS routines. Full MS-SIM scans cover an m/z range of 400–900 at 35 k resolution, 1e6 AGC, 100 ms max IT; data independent scans (DIA) for MS/MS fragmentation and analysis of peptides are run at a resolution of 17.5 k, 1e6 AGC target, auto max IT (functionally 55 ms max), an inclusion list specifying 20 m/z isolation windows, normalized collision energy 30, and a loop count of 25 peptides between full MS scans. Ion source/ MS entry settings are spray voltage 3.7 kV, sheath gas 5, and a capillary temperature of 320°C. When indicated, samples were run on a comparable LC–MS system at the UW School of Pharmacy's Analytical Instrumentation Center; a Thermo Q Exactive is run paired with a Waters Nano-Acquity UPLC System run as trap-elute at 350 nL/min. DIA Thermo.raw files were analyzed via the EpiProfile 2.0 the AcD3 module (Yuan et al., 2018). Subsequent data filtering (i.e., removing samples with (1) >2 null values for common peptides or (2) >50% CV) and normalization was performed using published Histone Analysis Workflow (Thomas et al., 2020). MS data has been uploaded to MassIVE (MSV000094403). Epiprofile2.0 Matlab scripts for peak extraction are hosted at https://github.com/zfyuan/EpiProfile2.0_Family.
3 RESULTS
3.1 Targeted disruption of Acly in Schwann cells causes neuropathy
ACLY is a key enzyme of the citrate shuttle, which allows transfer of acetyl CoA from metabolism of mitochondrial substrates (pyruvate, fatty acids, amino acids, ketone bodies) to the cytosol/nucleus (Figure 1). The shuttle exports citrate from mitochondria, followed by conversion to oxaloacetate and acetyl CoA, which is used for cytoplasmic fatty acid/cholesterol synthesis, and acetylation reactions in the cytosol/nucleus. Oxaloacetate is converted to malate or pyruvate which can be transported into mitochondria to maintain TCA cycle intermediates. The citrate shuttle is critical for production of acetyl CoA from glucose/pyruvate, as well as acetyl CoA derived from mitochondrial metabolism of amino acids and ketone bodies.
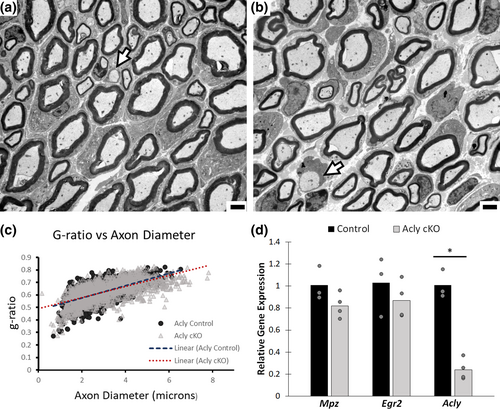
The Acly gene is ubiquitously expressed in the various cell types in peripheral nerve (Gerber et al., 2021). Therefore, to test the role of mitochondrial-derived acetyl CoA in Schwann cells, a floxed allele of Acly (Zhao et al., 2016) was bred with the commonly used Mpz-cre transgene (Feltri et al., 1999), which leads to embryonic deletion of Acly exon 9 (encoding the catalytic domain) in Schwann cells. This allele leads to nonsense-mediated decay because of the resulting frameshift in the Acly mRNA. In the following, Acly fl/fl/Mpz-cre mice are designated as Acly cKO (conditional knockout), and Acly fl/fl littermates (no Mpz-cre) are controls. Quantitative PCR analysis (Figure 3d) showed that there was a reduction in Acly transcript in knockout nerve, commensurate with the proportion of Schwann cells in sciatic nerve, as shown previously (Duong et al., 2021; Duong et al., 2023; Ma et al., 2015). The reduction of Acly was also observed in RNA-seq data (discussed in further detail below).
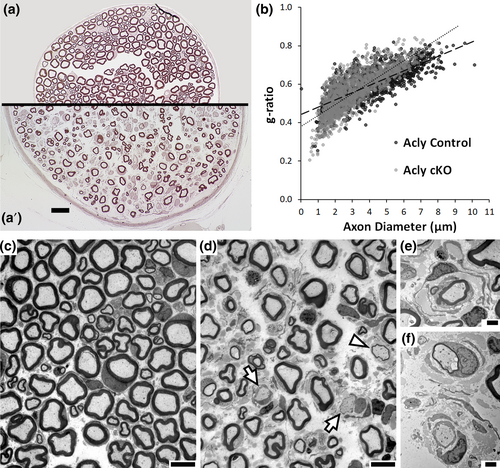
To determine if myelination is affected, we analyzed morphology of femoral motor nerve at 5–6 weeks of age (Figure 2). Electron microscopy of Acly cKO nerve revealed amyelinated axons (arrowheads), hypomyelination (arrows), and some onion bulb morphology (Figure 2d–f). Morphological analysis of myelinated axons revealed an overall reduction in axon diameters (Table 2). While the overall g ratio of myelinated axons was not significantly changed in the Acly cKO, axons >5 μm in diameter were significantly hypomyelinated. Moreover, there was a significant increase in the percentage of amyelinated axons. The apparent decrease in axon density was due in part to an overall increase in nerve diameter (Figure 2), and quantitation of total axon numbers of femoral motor nerve did not reveal an overall decrease in axon number (Table 2).
| 2-week-old femoral nerve | 5-week-old femoral nerve | |||
|---|---|---|---|---|
| Controla | Acly cKOa | Controla | Acly cKOa | |
| Avg. axon diameter (μm) | 2.9 ± 0.02 | 3.3 ± 0.5 | 4.3 ± 0.3 | 3.3 ± 0.1b |
| Avg. g ratio | 0.62 ± 0.01 | 0.64 ± 0.004 | 0.60 ± 0.02 | 0.57 ± 0.01c |
| Avg. g ratio axon diameter >5 μm | 0.74 ± 0.02 | 0.74 ± 0.02 | 0.67 ± 0.01 | 0.69 ± 0.002b |
| Avg. # myelinated axons | 504 ± 3.8 | 520 ± 18.1 | 562 ± 32.6 | 515 ± 17.1 |
| Avg. # amyelinated axons | 2 ± 1.2 | 11 ± 2.6b | 5 ± 1.2 | 42 ± 4.5b |
| Avg. percentage amyelinated axons | 0.4 ± 0.2 | 2.0 ± 0.5b | 0.9 ± 0.2 | 7.5 ± 0.9b |
- a One Sciatic nerve measured per mouse; N = 3 and N = 4, at 2 and 5 weeks, respectively.
- b p ≤ .05, t-test, when compared with control group of the same age.
- c p = .052, t-test, when compared with control group of the same age.
In addition, we also examined the sciatic nerve and femoral sensory nerve (Figure S1). In both cases, the analysis at 5 weeks did show thinly myelinated and amyelinated axons in the Acly cKO, consistent with the findings in the femoral motor nerve.
3.2 Acly is not required at a peak timepoint of myelination
We initially presumed that this phenotype reflected loss of ACLY-generated acetyl CoA during the most active phase of myelination (P0–P21). However, analysis at P14 surprisingly revealed little evidence of aberrantly formed myelin (Figure 3, based on 3 control/3 Acly cKO mice). The g ratios were largely unchanged (0.6 in Acly cKO vs. 0.629 in control), and average axon diameter was also very similar. We did occasionally see amyelinated axons (arrowhead) or thinly myelinated axons in the Acly cKO, although overall they were <1% of all axons (Table 2). Nonetheless, the surprising finding is that ACLY is largely not required during the most active period of myelination, but instead is required during the transition to myelin maintenance. Since myelination is largely normal at 2 weeks of age, we conclude that the thinner myelin is due to remyelination of larger diameter axons that have lost their myelin. Moreover, we conclude that mitochondrial metabolism of several inputs into the TCA cycle, including amino acids (glutamine), and fatty acids, is not required for generation of the large amount of acetyl CoA required for myelin formation. However, by 5 weeks of age, the ACLY enzyme becomes required for the maintenance of myelination. The 2 week analysis of the femoral sensory nerve shows comparatively little abnormalities in either myelinated axons or Remak bundles compared with the control (Figure S1).
To evaluate motor function of the Acly deficient mice, we used an inverted wire hang test (Figure 4), in which mice were tested for their ability to hang onto a wire grid over five 60-s trials. The results show a clear motor deficit, which progresses from 8 to 12 weeks of age. Acly cKO mice had a reduced average hang time (n = 18 control and 12 Acly cKO mice). Furthermore, control mice fell in only 8% of all trials, whereas Acly cKO mice fell in 87% of all trials at 12 weeks of age.
3.3 ACLY is required for gene regulatory networks in Schwann cells
To determine the impact of Acly deletion on gene expression, we performed RNA-seq (Figure 5a) in sciatic nerve from 5 week old mice. The bulk RNA-seq analysis can obscure cell type-specific changes, but we have focused the analysis on genes that are expressed in Schwann cells by using sorted Schwann cell and single cell RNA-seq data sets (Clements et al., 2017; Gerber et al., 2021; Toma et al., 2020; Yim et al., 2022; Zhao et al., 2022), although many such genes are also expressed in other cell types in nerve.
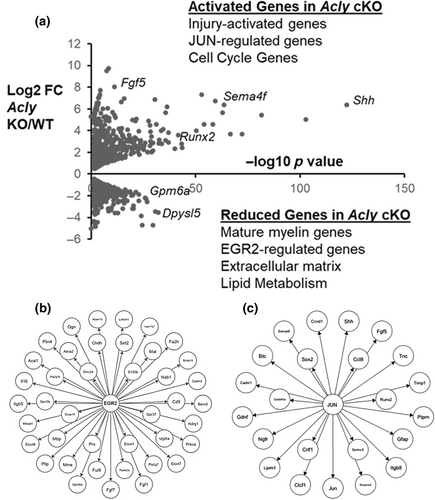
GO analysis using the KEGG database revealed a number of enriched categories in downregulated genes in Acly cKO mice, such as Extracellular matrix (ECM)-receptor interaction and focal adhesion (Figure S2), including several collagen, integrin, and laminin genes, although most of these changes were <2-fold. One example of such a gene is Dpysl5, which is involved in axon/Schwann cell interactions (Camdessanché et al., 2012). In addition, several signaling pathway categories were enriched in downregulated genes, such as the RAS, PI3-AKT, and cGMP-PKG signaling pathways.
One of the striking categories of dowregulated genes in the Acly cKO is EGR2 target genes (Figure 5b) (Le et al., 2005a, 2005b) (>150: e.g., Gpm4a, Fgf1, Mbp, Pllp). EGR2 is a transcription factor required for induction and maintenance of the myelination program in Schwann cells (Decker et al., 2006; Le et al., 2005a, 2005b; Topilko et al., 1994), and its target gene network encompasses myelin genes and lipid biosynthetic genes (Srinivasan et al., 2012). Among the EGR2 target genes, several major myelin genes are significantly downregulated, including Myelin Protein Zero and Peripheral Myelin Protein 22 (Log2 FC −0.8, −0.7, respectively). In addition, there is a reduction of EGR2-regulated lipid-modifying genes in the Acly cKO: fatty acid 2-hydroxylase Fa2h, and fatty acid elongases Elovl1, −6, and − 7. Western blot of sciatic nerve lysates confirmed a significant reduction in EGR2 levels (Figure S5).
GO analysis of upregulated genes identified several enriched KEGG categories, such as cytokine-cytokine receptor interaction and cell cycle pathways (Figure S2). The cell cycle pathways are consistent with the onion bulb pathology seen in the femoral motor nerve, which typically reflects additional Schwann cells. The RNA-seq data did not show evidence of significant macrophage infiltration (e.g., macrophage markers <2-fold increased), but there was a modest increase in mast cell markers. Some of the elevated cytokines/chemokines are expressed in Schwann cells after injury (Cxcl14, Clcf1, Crlf1) (Brosius Lutz et al., 2022). Interestingly, CLCF1 and CRLF1 form a complex that can activate GP130/JAK/STAT signaling, and have been shown to have trophic effects on motor neurons (Forger et al., 2003; Plun-Favreau et al., 2001). In addition, axon guidance and ECM-receptor genes (e.g., Integrin Itgb8 and Semaphorin Sema4f) are elevated in the Acly cKO.
Elevated genes in the Acly cKO include several transcription factors that are induced in Schwann cells after nerve injury, such as Jun, Fos, and Runx2 (log2 fold change = 1.5, 2.8, and 3.6, respectively). These transcription factors are activated in the unique capacity of Schwann cells to reprogram themselves after nerve injury from a terminally differentiated state to a repair state that supports nerve regeneration (Arthur-Farraj et al., 2012; Arthur-Farraj et al., 2017; Hung et al., 2015). Overall, we identified ~380 additional upregulated genes in Acly cKO nerves that are known to be induced in response to injury (Arthur-Farraj et al., 2012; Brosius Lutz et al., 2022; Kalinski et al., 2020; Nagarajan et al., 2002). Among these were many JUN target genes (Figure 4c), including the well-established injury response genes Shh and Gdnf (Arthur-Farraj et al., 2012; Ramesh et al., 2022).
We had previously found that the injury program (including Shh, Gdnf, Runx2) is also regulated by polycomb repression through polycomb repressive complex 2, and a number of the activated genes in the Acly cKO are also activated in a knockout of the EED subunit of PRC2 (Ma et al., 2015; Ma et al., 2016; Ma et al., 2018). Therefore, it appears that ACLY deficiency leads to activation of the nerve injury program in Schwann cells through JUN activation and/or via regulation of polycomb repression. Notably, the Nrg1 transcript encoding neuregulin was also induced, similar to the nerve injury-induced production of soluble type 1 neuregulin from Schwann cells (Stassart et al., 2013). Interestingly, this contributes to onion bulb formation (Fledrich et al., 2019). Since we do not see an overall decrease in axon number, we conclude that the Schwann cell injury program is not activated as a consequence of axon degeneration, but rather is caused by the intrinsic loss of Acly in Schwann cells.
3.4 Lipidomics analysis of Acly cKO mice
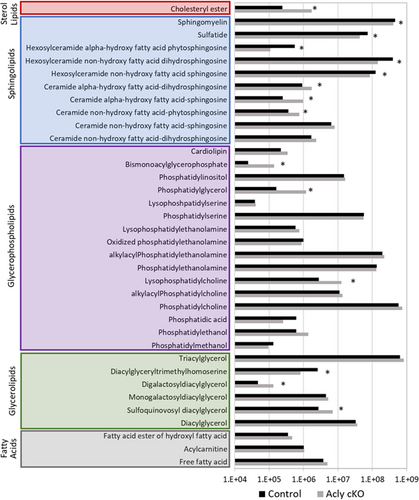
Given the importance of acetyl CoA to myelin lipid formation and maintenance, we performed a lipidomics analysis of the Acly cKO at 5–6 weeks old (n = 3/genotype). Analysis of lipid classes in the Acly cKO (Figure 6) revealed decreases in several sphingolipids: glycosphingolipids (HexCer_NS and HexCer_NDS: Hexosylceramide non-hydroxy fatty acid sphingosine and dihydrosphingosine) and the sulfated derivatives (sHexCer/sulfatides). Galactosphingolipids are among the lipid classes that are most highly enriched in PNS myelin compared to other membranes (Garbay et al., 2000; Poitelon et al., 2020). Interestingly, the Ugt8a gene (encoding ceramide galactosyl transferase, CGT) is decreased in Acly cKO mice (log2 FC = −1.3), which may account for this change (Figure 7c). However, many lipid categories were relatively unchanged, including plasmalogens (etherPE and etherPC) and acylcarnitines, and both have been identified as important regulators of nerve function (da Silva et al., 2014; Viader et al., 2013).
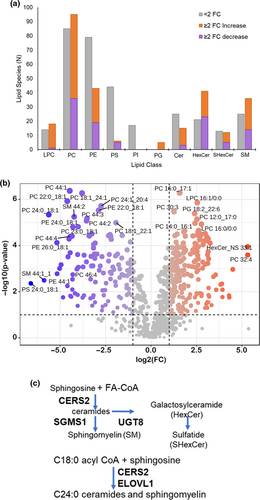
While the overall abundance of several lipid classes did not significantly change (e.g., phosphatidylcholine and phosphatidylethanolamine), numerous individual lipid species within those classes were significantly different (Figure 7a). These dramatic changes emerged from the volcano plot (Figure 7b), which showed a number of specific lipids that were highly altered (some >10-fold) in the Acly cKO. In depth analysis of the significantly altered lipid species revealed a distinct deficiency in longer chain saturated and monounsaturated fatty acids (e.g., 24:0 and 26:0) and an accumulation of shorter chain fatty acids (e.g., 16:0) (Figures S3 and S4). In contrast, lipid species with long chain polyunsaturated fatty acids are elevated (e.g., 22:6, 22:4, 20:4 in phosphatidylcholines, Figures S3 and S4). Free fatty acids are a relatively minor component of the total fatty acid in sciatic nerve, and there were no significant changes in overall or individual levels of free fatty acids.
While deficient acetyl CoA could cause this shift in the length of fatty acid constituents, a network analysis of the lipidomic data using Biopan (Figure S4) (Gaud et al., 2021) indicated that it may also reflect downregulation of fatty acid elongases (e.g., ELOVL1 and ELOVL7), which are highly expressed in myelinating Schwann cells in sorted cell and single cell RNA-seq data (Clements et al., 2017; Gerber et al., 2021; Kalinski et al., 2020; Yim et al., 2022). ELOVL elongases have varying substrate specificities, and ELOVL1 and −7 have overlapping specificity (ELOVL1 C20-24 and ELOVL7 C16-20) for saturated and monounsaturated fatty acid substrates (Ohno et al., 2010). The RNA-seq analysis confirmed downregulation of these ELOVL family members in the Acly cKO (Figure 5), and Elovl1 and Elovl7 are part of the EGR2 target gene network (Le et al., 2005a, 2005b).
3.5 Histone acetylation
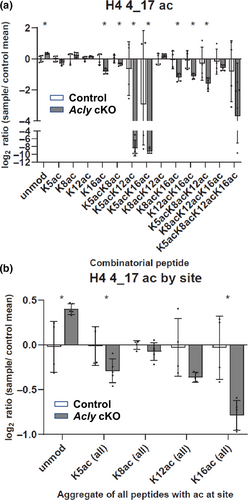
ACLY has been investigated in several cell types as an important regulator of epigenetics, as it is translocated to the nucleus to support histone acetylation (Wellen et al., 2009; Zaidi et al., 2012). To determine how loss of ACLY alters the global histone post-translational modification landscape and particularly acetylation, we performed a quantitative MS approach that profiles over 100 unique histone Post-translational modifications (PTM) states (Krautkramer et al., 2015; Thomas et al., 2020). Histones were extracted from sciatic nerves from control and Acly cKO mice at 12–13 weeks of age and analyzed for altered states of chromatin. The later time point was chosen to increase the chance that acetyl CoA depletion would affect global patterns of histone acetylation. Direct comparisons showed a clear loss of lysine acetylation at multiple sites in the Acly cKO mice (Figure 8a, Figure S6), most prominently at Lys5, Lys12, and Lys16 of H4 (Figure 8b). Consistently, there is a general corresponding increase in the unmodified forms of peptides (e.g., unmodified H4 4–17) which collectively show a decrease in acetylation. These are major sites of acetylation on chromatin and indicate that Acly cKO mice display an inability to maintain normal levels of chromatin acetylation at 12 weeks of age.
4 DISCUSSION
ACLY is a key mediator of the citrate shuttle, and we had expected that it would be critical for the large increase in lipid synthesis during myelination. The Acly gene is regulated by key transcription factors like the SREBP factors, and studies in peripheral nerve have tied its regulation to known regulators of Schwann cell differentiation, such as the c-Maf transcription factor, the Erbb2 neuregulin receptor, and the YAP/TAZ co-factors in the HIPPO pathway (Kim et al., 2018; Poitelon et al., 2016). However, our data indicate that myelination is largely unaffected at a peak time of myelination despite the absence of mitochondrially-derived acetyl CoA. This advances previous findings that glucose-derived acetyl CoA is not required for myelination (Della-Flora Nunes et al., 2017), since deletion of Acly inhibits production of cytosolic acetyl CoA from glucose and other mitochondrial substrates such as amino acids and fatty acid oxidation. This would suggest that extramitochondrial pathways of acetyl CoA generation are entirely sufficient in the early postnatal period to meet the high demand for myelin lipid synthesis and histone acetylation.
The most likely non-mitochondrial sources of acetyl CoA are the cytosolic metabolism of ketone bodies and exogenous acetate, which has been demonstrated in sciatic nerve explants employing radiolabeled precursors (Clouet & Bourre, 1988). Similar studies showed that Central nervous system (CNS) myelin lipid could be derived from acetate and ketone bodies in vitro (Edmond et al., 1987; Lopes-Cardozo et al., 1984; Patel & Owen, 1976; Yeh et al., 1977; Yeh & Sheehan, 1985) and in vivo (Koper et al., 1981; Webber & Edmond, 1979). Accordingly, ketone bodies are elevated in the neonatal period in humans/rodents when myelin synthesis is most active (Girard et al., 1992; Hawkins et al., 1971; Page et al., 1971; Roeder et al., 1982). However, these studies did not show the importance of ketone body incorporation into myelin lipids in vivo. Therefore, eliminating ACLY as an obligatory source for myelin formation highlights the importance of extramitochondrial acetyl CoA-generating pathways for myelination in vivo. Other potential sources of acetyl CoA have been identified, including acetyl-carnitine shuttling (Izzo et al., 2023), peroxisomal beta oxidation of fatty acids (Kuna et al., 2023), and recycling of acetate derived from protein deacetylation (Soaita et al., 2023).
In contrast, we see a much different outcome at 5 weeks where ACLY becomes important for myelin maintenance. The effect includes demyelination of axons, as well as evidence of remyelination (thinner myelin) and an overall decrease in axon diameter. In addition, we observed not only hypomyelination of large diameter axons, but also hypermyelination of some small diameter axons, which is observed in rodent models of the human peripheral neuropathy known as Charcot–Marie–Tooth disease type 1A (CMT1A), in which there are amyelinated axons and changes in axon diameters (Bai et al., 2022; Hantke et al., 2014; Sereda et al., 1996), along with evidence of onion bulb formation that is consistent with proliferation of Schwann cells, which is normally not observed in mature nerve (Fledrich et al., 2019). We speculate that the failure of myelin maintenance in the Acly cKO reflects a decreased abundance of plasma ketone bodies post-weaning (Girard et al., 1992; Hawkins et al., 1971; Page et al., 1971; Roeder et al., 1982). As noted below, myelin homeostasis depends upon repression of dedifferentiation pathways, which appear to become active by 5 weeks in the knockout.
ACLY has been proposed to play an important role in regulating gene expression through histone acetylation, as ACLY resides in both the cytosol and nucleus (Haws et al., 2020; Sivanand et al., 2018; Wellen et al., 2009; Zhao et al., 2016). We have characterized histone acetylation associated with enhancers in Schwann cells (Jang & Svaren, 2009; Jones et al., 2011; Lopez-Anido et al., 2015; Lopez-Anido et al., 2016; Pantera et al., 2020; Srinivasan et al., 2012). The histone H3K27 acetylation (H3K27ac) that marks myelin gene-associated enhancers is programmed into the epigenome at an early stage of myelination (Lopez-Anido et al., 2015; Lopez-Anido et al., 2016). Acetylation of histones at many sites is dynamically regulated, and important roles of histone deacetylases have been described at several stages of Schwann cell development (Beirowski et al., 2011; Gomis-Coloma et al., 2018; He et al., 2018; Jacob, 2017; Rosenberg et al., 2018). Our study has identified a novel factor required for maintaining histone acetylation in Schwann cells.
The significant decrease in histone acetylation at 12 weeks could underlie the downregulation of major myelin genes (e.g., Egr2, Mpz, Pmp22) in the Acly cKO, suggesting that there is an acetyl CoA-dependent feedback loop to myelin gene expression. One of the genetic networks that is downregulated is controlled by the EGR2 transcription factor, which is required for initiation and maintenance of myelination (Decker et al., 2006; Le et al., 2005a, 2005b; Topilko et al., 1994). Therefore, it is also possible that activity of EGR2 and/or other transcription factors is regulated by acetylation (Noritsugu et al., 2017; Wang et al., 2017).
Aside from gene downregulation, we also observe a significant elevation of several gene sets. Many of these genes have been identified as part of the Schwann cell injury program, as Schwann cells have a unique ability after nerve injury to reprogram themselves to a pro-regenerative state that supports axon growth and eventual remyelination (Jessen & Mirsky, 2016; Ma & Svaren, 2018). This program has been most closely linked to the activation of the JUN transcription factor, which is required for Schwann cell responses to nerve injury (Arthur-Farraj et al., 2012; Arthur-Farraj et al., 2017; Hung et al., 2015). The injury response program is normally silenced in mature nerve via polycomb repression (Duong et al., 2023; Ma et al., 2018). Therefore, we speculate that generation of acetyl CoA by ACLY is required to actively repress the injury program, which is required for homeostasis of mature nerve.
The effects of the Acly cKO on myelin maintenance could be due to acetyl CoA-dependent changes in lipid synthesis. The lipidomic analysis at 5 weeks revealed a number of important changes in the Acly cKO, such as loss of hexosylceramides, sulfatides and sphingomyelin, all of which are normally enriched in myelin (Poitelon et al., 2020). In addition, there is an accumulation of lysophosphatidylcholine, which contains one fatty acid compared with the two fatty acids in phosphatidylcholine. However, the most dramatic changes are observed in specific lipid species, in which shorter chain fatty acids (e.g., 14:0 and 16:0) are more abundant, and longer chain saturated and monounsaturated fatty acids are decreased (e.g., 24:0, 26:0). Many of these lipidomic changes could reflect decreased levels of acetyl CoA. However, RNA-seq analysis revealed downregulation of several fatty acid elongases (Elovl1, 6, and 7) in the Acly cKO, and the substrate specificity of these elongases is consistent with the observed changes in fatty acid distribution (Ohno et al., 2010). Interestingly, Elovl1, 6 and 7 are all highly expressed in Schwann cells (Clements et al., 2017; Gerber et al., 2021; Kalinski et al., 2020; Yim et al., 2022), and they are regulated by the EGR2 transcription factor based on knockout expression data and ChIP-seq analysis of EGR2 target genes (Le et al., 2005a, 2005b; Nagarajan et al., 2002; Srinivasan et al., 2012). Interestingly, analysis of a mouse model of neuropathy caused by Pmp22 mutation (Trembler) showed a specific deficiency in elongation of C18 fatty acids (Sargueil et al., 1999), and the ELOVL7 is fairly specific for this particular step among elongases expressed in Schwann cells (Ohno et al., 2010).
Saturated and monounsaturated very long chain fatty acids are common sphingolipid components in myelin and the depletion of 24:0 and 24:1 fatty acid-containing species has been observed after ELOVL1 inhibition (Isokawa et al., 2019; Ohno et al., 2010). Moreover, C24 ceramides are also regulated by ceramide synthase 2 (CERS2), and ELOVL1 forms a complex with CERS2. CERS2 is also highly expressed in Schwann cells, and its expression is also reduced in the Acly cKO (log2 fold change = −0.6). Therefore, EGR2 could regulate C24 sphingolipids via regulation of ELOVL1 and CERS2.
Lipidomics has been performed in several different models of peripheral neuropathy. The loss of myelin lipid has been documented in several models of neuropathy (CMT disease), including the C3 model of CMT1A, Trembler model of CMT1E, and the mTOR/MCT1 knockout models, which have identified altered lipid content in peripheral nerve (Bourre et al., 1986; Fledrich et al., 2018; Jha et al., 2020; Larrouquère-Régnier et al., 1979; Norrmén et al., 2014; Prior et al., 2024; Verheijen et al., 2009). In addition, lipidomic analysis of a dog model of CMT4D (Ndrg1 mutation) demonstrated specific loss of glycosphingolipids that is somewhat similar to our observations (Skedsmo et al., 2021).
However, the lipidomic profile of the Acly knockout is distinct in several aspects. There was a significant decrease in the abundance of sphingolipids in Acly cKO nerves, though simultaneously, the relative abundance of many other lipid classes was not significantly different. However, within those classes, there were many lipid species that were significantly different with the general trend being a decrease in long chain fatty acids, and an increase in shorter chain fatty acids. In contrast, there was a generalized decrease in most lipid classes in the Schwann cell-specific deletion of fatty acid synthase (Montani et al., 2018) and raptor (mTORC1) (Norrmén et al., 2014), which was also observed in the rat model of CMT1A (Fledrich et al., 2018). Also, we observed that many of the SREBP target genes in the fatty acid and cholesterol biosynthetic pathways were changed in other models (Fledrich et al., 2018; Jha et al., 2020; Norrmén et al., 2014; Verheijen et al., 2009), but are unchanged in the RNA-seq analysis of the Acly cKO (e.g., Fatty acid synthase, HMG CoA reductase, etc.). The Schwann cell-specific knockout of Scap had a similar redistribution of longer to shorter chain fatty acids (Verheijen et al., 2009), although not to the same degree. Therefore, the knockout of Acly in Schwann cells identifies a uniquely regulated subprogram of the lipid biosynthetic program focused on sphingolipid and saturated Very long chain fatty acid (VLCFA) synthesis, which correlates with deregulation of several genes.
The genesis of the study was to determine if mitochondrially-derived sources of acetyl CoA were required for myelination, but several findings are relevant to the consideration of myelin formation/maintenance and neuropathy. First, as noted above, defects in lipid synthesis/homeostasis appear to be a common denominator in several models of peripheral neuropathy, but it has not been established if lipidomic deficits are a cause rather than consequence of peripheral neuropathy. Our findings suggest that deficient acetyl CoA per se may provoke some aspects of peripheral neuropathy including pathology that has been observed in rodent models of CMT. Second, the effects on EGR2- and JUN-regulated gene networks could mean there is an acetyl CoA-dependent linkage to EGR2 activation and/or suppression of JUN-regulated pathways, but the mechanisms of this linkage remain to be discovered. Third, the relatively specific nature of the lipidomic deficits (changes in fatty acid length and sphingomyelin) suggest a mechanistic linkage between acetyl CoA levels and the unique myelin lipid composition of peripheral nerve, and several key enzymes as noted have been linked to the EGR2/Krox20 transcriptional regulation. Finally, the development of myelin deficits within a short time from 2 to 5 weeks, potentially allows analysis of some key mechanisms that may be in common with development of myelin pathology in models of CMT.
AUTHOR CONTRIBUTIONS
Andrew Schneider and John Svaren designed the experiments, performed data analysis and wrote the manuscript. Andrew Schneider managed the mouse colony and prepared samples for histology analysis. Eric Armstrong and Greg Barrett-Wilt performed mass spectrometry and data analysis. Aaron Cooper, Amulya Suresh, and Rachell Rivera performed data analysis. John Denu and Judith Simcox guided and designed the proteomic analyses. Seongsik Won performed quantitative PCR and Western blot analysis. All authors contributed to the manuscript and approved the submitted version.
ACKNOWLEDGMENTS
The authors thank Randall Massey from the Electron Microscopy Facility for processing microscopy samples, Luigi Puglielli for comments/discussion, Daniel Okhuevbie, Emma Geiduschek and Gonzalo Fernandez-Fuente for technical assistance, and the University of Wisconsin Biotechnology Center Mass Spectrometry Facility.
FUNDING INFORMATION
This work was supported by the Vilas Associates Award and National Institutes of Health: R01 NS130566 to JS, and by a core grant to the Waisman Center from the Eunice Kennedy Shriver National Institute of Child Health and Human Development (P50 HD105353). This study was supported in part by UW-Madison Comprehensive Diabetes Center Core Services Pilot Award UWCDC-CSPA-20-8 and the University of Wisconsin—Madison Office of the Vice Chancellor for Research and Graduate Education with funding from the Wisconsin Alumni Research Foundation.
Open Research
DATA AVAILABILITY STATEMENT
RNA-seq data are deposited in NCBI GEO under accession number GSE252209.Other data are provided in supplementary tables. Mass spectrometry data has been uploaded to MassIVE (massive.ucsd.edu) under the accession numbers MSV000094670 and MSV000094403. Epiprofile2.0 Matlab scripts for peak extraction are hosted at https://github.com/zfyuan/EpiProfile2.0_Family.


