Evaluation of the impact of climate change on rainfall for potential landslide triggering in Japan
Abstract
Intense rainfall events associated with climate change may increase future landslide hazards. Therefore, future landslide probability should be constrained using rainfall projections from global climate models (GCMs). However, because landslides can occur in association with various rainfall patterns, such as short-duration (few hours) intense rainfall to long-term accumulated rainfall over a few days, general projections of daily rainfall are inadequate for evaluation of rainfall with landslide-triggering potential. To address this problem, this study adopted a new approach using 72-h GCM rainfall projections based on 100-year rainfall return levels and applied it to 10 regions in Japan where landslides widely occur. We found that rainfall with landslide-triggering potential becomes more frequent toward 2,100 in response to intensified global warming. In some regions, under the scenario that future greenhouse gas emissions continue to increase owing to inadequate regulation, intense rainfall with landslide-triggering potential is projected to become more frequent and widespread, especially after approximately 2060. In relation to this projected spread of the areas of persistent rain, rainfall with landslide-triggering potential might occur synchronously in two to five regions. However, even under the scenario that aerosol emissions are reduced rapidly to mitigate global warming, rainfall might intensify before 2060 in some regions, resulting in a projection of high landslide probability. The presented projections are not definitive and require further refinement; however, they do suggest that the impact of climate change on the frequency and region of hazard of landslide occurrence might change in the future depending on the effort made to mitigate global warming.
1 INTRODUCTION
Landslides are one of the most hazardous geomorphic processes in terms of damage, cost and number of fatalities, and they frequently jeopardize human communities in mountainous regions and areas further downstream on a scale that depends on their magnitude and mobility (Froude & Petley, 2018; Petley, 2012). In addition to the aspect of human risk, stripped sediment, soil and trees are the principal natural components transported from a headwater channel to downstream areas and further offshore, occasionally reaching deep-sea areas (Hilton et al., 2008; Hilton, Galy, & Hovius, 2008; West et al., 2011; Wohl & Iskin, 2021). The balance and pace regarding deposition and discharge of transported sediment, soil and trees might govern landform changes and carbon dynamics in impacted watersheds (Berhe et al., 2007; Campforts et al., 2020, 2022; Frith et al., 2018; Hilton et al., 2011; Ramos-Scharrón, Castellanos, & Restrepo, 2012; Stallard, 1998; Vascik et al., 2021). Landslide scars left by the stripping of hillslope material can also affect the carbon cycle via denudation and weathering processes owing to exposure to fresh slip surfaces (Gabet, 2007; Hilton and West, 2020). The transport of sediment, soil and trees by landsliding is responsible for disturbing landslide runout areas, driving forest succession and encouraging ecological transition (Clark et al., 2016; Restrepo et al., 2009; Sidle & Bogaard, 2016). Therefore, forecasting the potential for landslide occurrence is crucial not only for mitigation of related hazards, but also for understanding the aftermath and impacts of landslide events with respect to landscape change, the carbon cycle and ecological transition.
Landslides are triggered primarily by rainfall (Froude & Petley, 2018; Segoni, Piciullo, & Gariano, 2018). Increases in the amount, intensity and duration of rainfall, projected as a consequence of climate change, will necessarily increase the frequency of landslides and related hazards in the future (Crozier, 2010; Gariano & Guzzetti, 2016, 2022; Jakob, 2022; Kirschbaum, Stanley, & Zhou, 2015). Therefore, investigation of future changes in the potential for landslide occurrence, based on rainfall projections of global climate model (GCMs), is a promising approach for predicting landslide-related risks (Kaitna et al., 2023; Lin et al., 2022; Melchiorre & Frattini, 2012; Shou & Yang, 2015).
Evaluation of the potential for landslide occurrence has certain difficulties when using GCM-based rainfall projections. First, the uncertainty in precipitation projections is larger than that in relation to temperature projections, mainly because of the strong sensitivity to the alteration of aerosol concentrations by unpredictable anthropogenic and volcanic activities (Shiogama et al., 2022). These unpredictable influences impede the minimization of inter-model variation in precipitation projections by GCMs (Shiogama et al., 2022). Second, landslide properties, such as depth, area, volume, lithology and presence/absence of trees, are generally different in response to environmental settings that vary widely from hillslope to regional scales (Büschelberger et al., 2022; Larsen, Montgomery, & Korup, 2010; Tsunetaka, Asano, & Murakami, 2022). Consequently, depending on such environmental differences, various types of rainfall that can range from downpours that persist for just a few hours to long-term rainfall that continues for a few days have the potential for triggering landsliding (Bogaard & Greco, 2018; Marc et al., 2019; Tsunetaka, 2021). Although estimates of future rainfall are generally provided with daily temporal resolution (Samset et al., 2019), this resolution might be responsible for generating false positives of the potential for landslide occurrence, especially for landslides triggered by downpours that occur over a few hours.
In addition to the issues arising from data quality and landslide-triggering mechanisms, certain methodological problems remain. A rainfall threshold used for diagnosing landslide occurrence is generally derived from the upper bound of rainfall that did not trigger a landslide or from the lower bound of rainfall that did trigger a landslide (Brunetti et al., 2010; Caine, 1980; Guzzetti et al., 2007, 2008; Saito, Nakayama, & Matsuyama, 2010). Therefore, this approach is limited in practice by the availability of records of previous landslides. Additionally, the spatial resolution of projections of future rainfall from GCMs is typically of the order of several kilometres, even after downscaling (Eyring et al., 2016; Taylor, Stouffer, & Meehl, 2012), which means that local landslides are beyond the target of diagnosis using GCM rainfall projections.
Addressing the quality of rainfall projection data remains difficult owing to the limitations of current GCMs; however, other problems could possibly be resolved through ingenuity in rainfall evaluation and selection of the magnitude of target landslide events. Numerous landslides are often triggered by widespread intense rainfall on the regional scale (Büschelberger et al., 2022; Marc et al., 2019, 2022; Tsunetaka, 2021; Yano et al., 2019). Because the area affected by such widespread landsliding can exceed several square kilometres, even the rainfall projections of GCMs could likely characterize the properties of the triggering rainfall. Analysis of widespread landslides in Japan revealed that the triggering rainfall tended to approach the 100-year return level when landslides occurred, regardless of the rainfall pattern (Tsunetaka, 2021). Therefore, the return level of rainfall could be a useful proxy threshold for diagnosing whether projected rainfall has the potential to trigger landslides, especially in cases where records of previous landslides are scant (Marc et al., 2019, 2022; Mtibaa & Tsunetaka, 2023; Tsunetaka, 2021).
In this study, under the assumption that rainfall projections of GCMs allow characterization of the rainfall properties associated with the triggering of widespread landslides, future changes in the number and the spatial extent of intense rainfall events with the potential to trigger landslides were investigated. Considering relationships between the rainfall return level and rainfall projections, this study focused on 10 regions in Japan that experience widespread landslides, including both shallow landslides that occur on non-volcanic hillslopes and in areas affected by volcanic eruptions and deep-seated landslides. The projections of two GCMs under two (moderate and severe) global warming scenarios were compared to assess both the effects of differences in GCMs and the impact of the degree of climate change on projections of future landslide probability. On the basis of those comparisons, we investigated how differences in the degree of climate change could affect the spatial extent of the increase in the future potential for landslide hazard, and determined when and where such an increase might change substantially. The goal was to identify how differences in the degree of climate change could potentially lead to variations in landslide probability from the perspective of changes in rainfall.
2 STUDY REGIONS
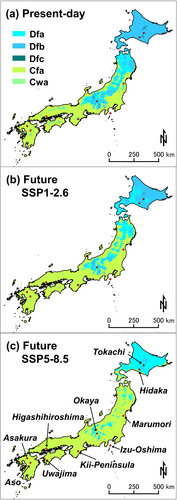
This investigation focused on 10 regions in Japan (Figure 1, Table 1) where landslides occurred widely during 2003–2019 (Tsunetaka, 2021). The regions were selected based on the properties outlined below with respect to current landslide-triggering rainfall conditions investigated by Tsunetaka (2021). First, on average, the triggered landslides occurred 1.7–27.3 km from the closest rain gauge station managed by the Japan Meteorological Agency, but their triggering conditions were well characterized by 100-year rainfall return levels estimated using the closest gauged rainfall data. Specifically, the current potential for landslide triggering generally increases when the mean rainfall intensity approaches the 100-year return level within 72 h. Second, in each region, the distance between the most distant landslides was >1 km. Commonly, the rainfall events triggered numerous widespread landslides across an area exceeding 1 km2 in the 10 regions, and the triggering-rainfall conditions of such regional landslides were characterized by 100-year return levels (Tsunetaka, 2021). Given the above properties of the 10 regions considered, we assumed that rainfall return levels estimated using the 1-km downscaled rainfall projected by the GCMs allowed evaluation of future landslide probability. The details of the analysis are described in Section 3.
| Region | Date of previous landslides | Number of examined grid cells | Climate classification of examined grid cellsa | Landslide typeb | Trigger type | ||
|---|---|---|---|---|---|---|---|
| Present-day | Future SSP1–2.6 | Future SSP5–8.5 | |||||
| Tokachi | 31 August 2016 | 50 | Dfb | Dfb | Dfa, Dfb | SL | Accumulation |
| Hidaka | 9 August 2003 | 20 | Dfb | Dfa, Dfb | Dfa | SL | Downpour |
| Marumori | 19 October 2019 | 317 | Dfa, Cfa | Cfa | Cfa | SL | Downpour |
| Okaya | 19 July 2006 | 12 | Dfa | Dfa, Cfa | Cfa | SL | Accumulation |
| Izu-Oshima | 16 October 2013 | 12 | Cfa | Cfa | Cfa | VSL | Downpour |
| Kii-Peninsula | 3–4 September 2011 | 1,026 | Dfa, Dfb, Cfa | Dfb, Cfac | Cfad | DL | Accumulation |
| Higashihiroshima | 7 July 2018 | 526 | Cfa | Cfa | Cfa | SL | Accumulation |
| Uwajima | 7 July 2018 | 146 | Cfa | Cfa | Cfa | SL | Accumulation |
| Asakura | 6 July 2017 | 274 | Cfa | Cfa | Cfa | SL | Downpour |
| Aso | 12 July 2012 | 4 | Cfae | Cfa | Cfa | VSL | Downpour |
- a Beck et al. (2023): present-day and future classifications correspond to 1991–2020 and 2071–2099, respectively.
- b VSL = shallow landslide in volcanic area; SL = shallow landslide in non-volcanic area; DL = deep-seated landslide.
- c Dfa category appears slightly but is ignorable (Figure S6c).
- d Dfb category appears slightly but is ignorable (Figure S6d).
- e Dfb category appears slightly but is ignorable (Figure S10b).
Multiple grid cells of the GCM projections were analysed, but the number varied between the examined regions in accordance with differences in the spatial range of previous landslides (Figures S1–S10, Table 1). For example, the properties considered included the distance between areas with dense landslides and those without landslides (e.g., coastal, flat and urban areas), the variation in elevation and the size of the area of dense landslides. Moreover, the evaluation of the properties was based on an existing landslide inventory used in Tsunetaka (2021); however, it was acknowledged that the quality of the landslide inventory might differ depending on the scale, date and quality of the data sources and on the expertise of the interpreters (Malamud et al., 2004). Considering that the above properties differed between the examined regions, approaches to select grid cells based on a consistent slope-gradient threshold (e.g., Mtibaa & Tsunetaka, 2023; Perkins et al., 2024) were difficult to implement for this study. Thus, while covering the landslides and removing unnecessary areas (e.g., gently sloping zones such as urban areas), the grid cells selected for examination were chosen manually.
The 10 regions considered are distributed widely from the north to the south of Japan (Figure 1). Beck et al. (2023) estimated the present-day (1991–2020) and future (2071–2099) Köppen climate classification of the regions using seven high-resolution, topography-corrected, observation-based climatic datasets, together with temperature and precipitation data projected by GCMs that are included in the sixth phase of the Coupled Model Intercomparison Project (CMIP6; Eyring et al., 2016). Following the Köppen climate classification by Beck et al. (2023), two, one and five regions are categorized as Dfb, Dfa and Cfa, respectively, in the present-day (1991–2020) climate classification (Figure 1a, Table 1). The classification of the other two regions is mainly Cfa but partly Dfa and/or Dfb (Figures S3, S6, Table 1). Here, category Dfb indicates a cold climate with warm summers, category Dfa indicates a cold climate with hot summers and category Cfa indicates a temperate climate with hot summers (Beck et al., 2023). Each categorization indicates that no dry season occurs (Beck et al., 2023).
In accordance with the moderate and severe global warming scenarios represented by two shared socioeconomic pathways (SSPs) and representative concentration pathway (RCP) scenarios considered in the sixth assessment report of the Intergovernmental Panel on Climate Change (IPCC AR6), i.e., SSP1-RCP2.6 (SSP1–2.6) and SSP5-RCP8.5 (SSP5–8.5), respectively (the details of each scenario are described in Section 3), expected during 2071–2099, together with analysis of the examined grid cells, it is projected that half of the selected regions in Japan might experience a shift in their future climate classification from that of the present day (Figure 1b, c, Table 1). In the Tokachi region, a large part of the area with Dfb classification becomes classified as Dfa under the SSP5–8.5 scenario (Figure S1). In the Hidaka region, much of the area classified as Dfb shifts to the Dfa category under the SSP1–2.6 scenario, whereas the entire area becomes classified as Dfa under the SSP5–8.5 scenario (Figure S2). In the Marumori region, the area classified as Dfa shifts to the Cfa category under both scenarios (Figure S3). In the Okaya region, a large part of the area with Dfa classification becomes classified as Cfa under the SSP1–2.6 scenario, whereas the entire area becomes classified as Cfa under the SSP5–8.5 scenario (Figure S4). In the Kii-Peninsula region, part of the area classified as Dfa and Dfb shifts to the Cfa category under the SSP1–2.6 scenario, whereas almost all areas classified as Dfa and Dfb shift to the Cfa category under the SSP5–8.5 scenario (Figure S6). In the other five regions, no shift of the climate classification is projected (Figures S5, S7–S10). The climate classification and the trend of shift might vary among the examined regions, thereby allowing investigation of the future potential of landslide occurrence with consideration of differences in climatic setting.
In the Izu-Oshima and Aso regions, shallow landslides with depths of ~1–1.6 m have occurred most often because of slipping of the soil layer that consists of volcanic deposits. In the Kii-Peninsula region, at least 18 deep-seated landslides (depth: ~10–37 m) have occurred because of accumulated rainfall of over 1,000 mm. In the other seven regions, shallow landslides with depth of ~0.5–5.0 m have occurred mainly because of slipping of the surface soil mantle layer. The details of these events, including the characteristics of the landslides and the triggering rainfall, have been documented in Tsunetaka (2021). Importantly, in the Kii-Peninsula region, the rainfall return levels for landslide triggering were investigated by focusing on deep-seated landslides because their occurrence time was well determined (Tsunetaka, 2021; Yamada et al., 2012). However, owing to the same triggering rainfall, over 1,900 shallow landslides also occurred (Marc et al., 2018, 2019). Thus, the presented approach for evaluation of the potential for landslide occurrence might be reliable only for specific types of corresponding target landslides (e.g., deep-seated landslides in the Kii-Peninsula region) in the respective regions.
3 METHODS
3.1 Rainfall data
Two types of rainfall data projected by GCMs were used: (1) rainfall projections for the historical period from 1980 to 2014 (historical rainfall) and (2) rainfall projections for the future period from 2015 to 2,100 (future rainfall). Typically, GCM-based projected-rainfall data have a spatial resolution of several tens to hundreds of kilometres (Navarro-Racines et al., 2020), and therefore downscaling is required to evaluate future landslide probability. Moreover, GCM simulations commonly contain systematic errors, meaning that it is essential that bias correction based on measurements be performed for an accurate evaluation of the impacts of future landslide probability (Gomez-Garcia et al., 2019; Iizumi et al., 2017; Maraun & Widmann, 2018). The method of bias correction applied will affect the properties of the projected rainfall (e.g., total precipitation and number of rain days) (Ishizaki et al., 2020). Therefore, an appropriate bias-correction method should be selected depending on the targeted usage for assessing climate change impacts.
In the case of Japan, the bias-correction and downscaling method called the cumulative distribution function-based downscaling method (CDFDM; Iizumi et al. (2010, 2017) is considered effective for reproducing rainfall seasonality (Ishizaki et al., 2020). The CDFDM approach is classified as a non-parametric method that corrects the bias in respective percentiles of the GCM projections (Ishizaki et al., 2022). First, errors in the GCM projections are identified by comparison with reference data (e.g., gauged rainfall data). Assuming that the error-percentile relationship is invariable over each bias-correction period, the bias in the GCM projections is minimized using the obtained empirical cumulative functions of the error. Originally, the error-percentile relationship was specified over a half-year time span (e.g., Iizumi et al., 2010, 2017; Ishizaki et al., 2020), but the CDFDM using the monthly error-percentile relationship (CDFDM-M) can further accurately reproduce rainfall seasonality (Ishizaki et al., 2022).
Because rainfall seasonality is one of the critical factors in determining landslide probability, we used NIES2020 data, bias-corrected using the CDFDM-M approach (Ishizaki, 2021; Ishizaki et al., 2022), for the historical and future rainfall projections. For CDFDM-M processing, ~1-km gridded rainfall data (Agro-Meteorological Grid Square Data; Ohno et al., 2016) were used as reference rainfall data. The reference data were produced through statistical interpolation of rainfall, measured during 1980–2018 by rain gauges, using the inverse distance weighting method (Ishizaki et al., 2022; Ohno et al., 2016). Both the historical and the future rainfall data comprised downscaled GCM rainfall data (resolution: ~1 km2) covering all of Japan. The daily rainfall value was contained in each daily time stamp of the rainfall data.
To compare differences in the trend of future landslide probability originating from inter-model variation, we investigated projected-rainfall data obtained from two different GCMs developed in Japan: MIROC6 (Tatebe et al., 2019) and MRI-ESM 2 (Yukimoto et al., 2019). These GCMs are two of the models considered in the CMIP6 (Eyring et al., 2016). The CMIP6 complies with the IPCC AR6 and is conducted to quantitatively evaluate uncertainty between modelled projections (Eyring et al., 2016). The inter-model deviation of CMIP6 models is reduced in comparison with the projections of the previous (CMIP5) models (Yuan, Quiring, & Leasor, 2021).
To compare the impacts of global warming, the projections using the GCMs were based on SSP1–2.6 and SSP5–8.5 (O'Neill et al., 2016). Both SSP1 and SSP5 envision further human development owing to aggressive investments in education and health, rapid economic growth and well-functioning institutions (O'Neill et al., 2016); however, the underlying economic principles are substantially different. For example, SSP1 assumes that the economy shifts toward sustainable practices, whereas SSP5 assumes increasing commitment to a fossil-based economy (O'Neill et al., 2016). RCP2.6 represents radiative forcing due to greenhouse gas trajectories under a mitigation scenario, whereas RCP8.5 represents a continued increase in greenhouse gas emissions (Meinshausen et al., 2011; van Vuuren et al., 2011). Accordingly, the SSP1–2.6 scenario supposes the realization of maximum human effort with respect to mitigation of the impacts of global warming, whereas the SSP5–8.5 scenario corresponds to a continued disorderly increase in greenhouse gas emissions. Comparison of the results between the two SSP-RCP scenarios allows investigation of how human efforts to mitigate the effects of global warming could change the future landslide probability.
3.2 Rainfall analysis
3.2.1 Concept
As shown in Figure 2, in the defined 72-h period, landslides tended to occur (blue circles) when the mean rainfall intensity (light blue lines) approached or exceeded the 100-year return level (red lines) in all examined regions. However, the rainfall patterns that triggered landslides were different and could be divided broadly into two types: short period (2–4 h) intense rainfall (downpour-type) and accumulated rainfall over a long period (~72 h; accumulation-type). In downpour-type instances (Figure 2b, c, e, i, j), although the rainfall approached the 100-year return level in a relatively short time, such a high rainfall return level was maintained in most cases even after landslide occurrence. In accumulation-type instances (Figure 2a, d, f, g, h), the 72-h rainfall eventually increased to a return level comparable to or exceeding that of the 100-year return level. On the right-hand side of each panel in Figure 2, the light blue lines approach or cross the red lines, indicating that the 72-h rainfall tended to reach or exceed the 100-year return level, regardless of differences in the rainfall patterns. This is because the total precipitation produced by downpours in a few hours is comparable to that produced by accumulation-type rainfall, regardless of whether rainfall continues after landslide occurrence.
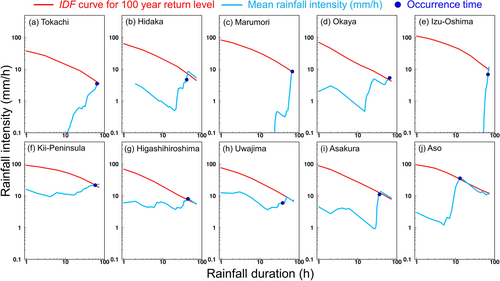
In this sense, rainfall events that produce 72-h rainfall with a 100-year return level can be generated by various rainfall patterns that include both downpour-type and accumulation-type. In other words, the consistency of the return level of landslide-triggering rainfall shown in Figure 2 might allow diagnosis of rainfall with the potential to trigger landslides depending on whether the projected 72-h rainfall reaches the 100-year return level. Unfortunately, it is difficult to determine whether either or both types of rainfall trigger landslides in a particular region. Additionally, the landslide occurrence time was approximated based on the identified occurrence time of at least one landslide (Tsunetaka, 2021); however, the actual time of landslide occurrence has greater or lesser variation among respective landslides depending on the spread and shift of rain areas. Consequently, the 100-year return level is not necessarily adequate for all landslides in each region. Thus, diagnosis based on 72-h rainfall contains unavoidable uncertainty that leads to an inevitable overestimation of the number of rainfall events with the potential to trigger landslides. However, the approach has merit in that the 72-h rainfall can be calculated using data with low temporal resolution (e.g., daily rainfall), thereby allowing diagnosis of future landslide probability using projected-rainfall data. Moreover, unlike the actual 72-h rainfall maxima that triggered the previous landslides, the use of the return level as a proxy threshold has the advantage that the approach could be applied to other regions with no record of previous landslides.
3.2.2 MEV-based rainfall return level analysis
Considering the background and concepts outlined above, the potential of future rainfall to trigger landslides was investigated based on the rainfall return level. First, we estimated the 100-year return level of the 72-h rainfall using historical data (i.e., rainfall projections from 1980 to 2014). In many earlier studies, rainfall return levels have been estimated based on extreme value theory (EVT; Fischer & Tippett, 1928; Gnedenko, 1943; Gumbel, 1958). The EVT approach mostly uses only annual rainfall maxima; thus, the number of rainfall samples analysed is limited to the measurement years. This data restriction of the EVT approach hinders the optimization of quantile estimation in achieving an acceptable level of uncertainty in the estimation of the rainfall return levels (Miniussi & Marani, 2020).
To resolve this problem, we estimated rainfall return levels based on a Metastatistical Extreme Value (MEV) framework (Marani & Ignaccolo, 2015). Unlike the EVT approach, which focuses on annual maxima, the MEV framework models the probability distribution of extremes based on the full distribution of ordinary rainfall events sampled annually (Marani & Ignaccolo, 2015; Zorzetto, Botter, & Marani, 2016). Thus, the MEV approach exploits all available rainfall data in defining the probability distributions, without the data restriction associated with the EVT approach. In this context, in comparison with the EVT approach, the MEV framework relaxes certain statistical assumptions in modelling the probability distributions, which consequentially reduces the uncertainty of high-quantile estimates (Zorzetto, Botter, & Marani, 2016).
The 100-year return level of the 72-h rainfall was estimated with respect to all examined grid cells of the GCM projections following the MEV-based procedure. First, using the respective projected-rainfall data (i.e., historical and future rainfall), 72-h rainfall intensities were calculated by summarizing the daily rainfall values of the corresponding date and the previous two days. Accordingly, the 72-h rainfall intensities of all dates during 1980–2,100 were obtained. Here, to define a wet day (i.e., a day on which ordinary rainfall occurred) for the MEV approach, we set a rainfall threshold. Following the guidelines of the World Meteorological Organization (Klein Tank, Zwiers, & Zhang, 2009), Zorzetto & Marani (2019) and Miniussi & Marani (2020) defined a wet day as a day on which rainfall of ≥1 mm occurs. Following those previous studies, we defined a wet day as a daily time stamp that records a 72-h rainfall projection of ≥1 mm. In other words, we studied the 72-h rainfall exceedance with respect to the 1-mm threshold. On the basis of the 72-h rainfall exceedances during 1980–2014 (i.e., the historical period) and using probability-weighted moments, we estimated the parameters describing the Weibull distribution based on the MEV approach. This estimation was performed following the implementation of Zorzetto, Botter, & Marani (2016). Probability-weighted moment estimation can reduce both bias and uncertainty and mitigate the influence of outliers (Greenwood et al., 1979).
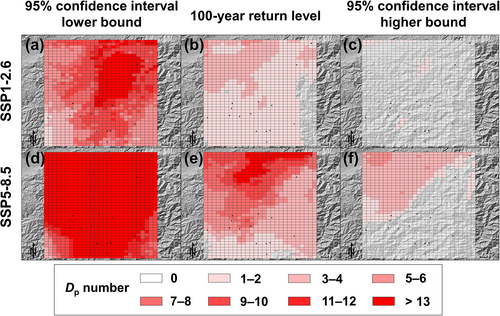
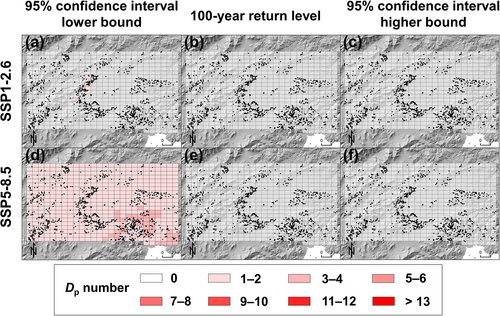
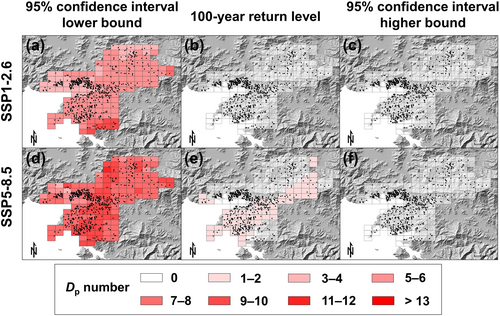
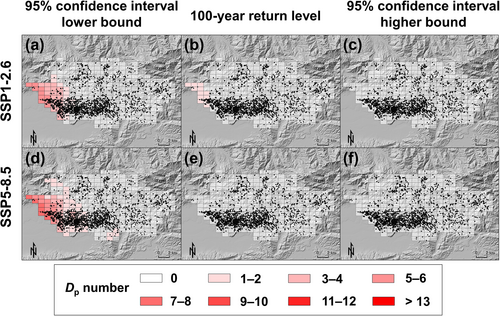
Given the modelled distribution, the 100-year return level of 72-h rainfall and its 95% confidence interval were estimated for each examined grid cell. The values of the 72-h rainfall intensities with daily resolution from 2015 to 2,100 were compared with three respective proxy thresholds (i.e., the 100-year return level estimated by the MEV approach, and the lower and higher bounds of the 95% confidence interval). When the 72-h rainfall intensities exceeded these proxy thresholds, the corresponding date was diagnosed as a day with potential for landslide occurrence (hereafter, referred to as Dp) and the Dp number was counted for each grid cell from 2015 to 2,100. To identify a threshold for landslide occurrence, multiple combinations of rainfall duration (e.g., 1 to 72 h) and return levels (e.g., 50 to 100 years) have been tested in terms of diagnostic accuracy for previous landslides (e.g., Marc et al., 2019, 2022; Mtibaa & Tsunetaka, 2023). In this context, the proxy thresholds based on the lower and higher bounds of the 95% confidence interval correspond to lower (frequent) and higher (rare) return levels compared with the 100-year return level. However, in the present study using rainfall projections, the diagnosed Dp instances did not reflect actual landslide occurrences. Consequently, we could not validate the accuracy of the proxy thresholds. Therefore, the use of the proxy thresholds was intended to provide a comprehensive basis for comparing the properties of Dp instances depending on differences in the examined GCMs and global warming scenarios, rather than identifying a robust threshold. The number and spatial extent of Dp occurrences were compared in relation to the differences in the GCM models, scenarios and regions.
Additionally, the continuity of the Ap index was investigated. In the case that rainfall occurs across dates, because the projected-rainfall data consists of values that comply with the daily timestamp from 00:00 to 24:00 JST (JST = UTC + 9), a calculated 72-h rainfall value cannot necessarily indicate the maximum 72-h rainfall provided by a rainfall event. However, when the Ap index exceeded zero (i.e., a Dp instance was observed somewhere in a grid cell; hereafter, referred to as a Dp rainfall event) on two consecutive days, intense long-lasting rainfall exceeding three days is likely. When Dp rainfall events occurred for more than two consecutive days, they were integrated and counted as a single continuous Dp rainfall event. In this integrated case, owing to the longer time span of the rainfall, the occurrence possibility of rainfall patterns that could trigger landslides is increased, suggesting that the corresponding rainfall is unlikely an overestimation resulting from sporadic GCM errors. In this context, if the investigated continuity of a Dp rainfall event exceeds two days, the corresponding rainfall has greater potential for triggering landslides.
Similarly, occurrences of a Dp rainfall event in different regions within a few days imply broader rain areas, which are more likely to enhance the possibility of landslide occurrence in comparison with a single and local Dp instance. Accordingly, the continuous occurrence of Dp rainfall events over several days in various regions is a robust index for the evaluation of landslide probability, while minimizing the disadvantages of the presented diagnostic approach. Thus, we investigated whether there were periods in which Dp rainfall events occurred within three days (72 h) before and after a certain date in more than two regions. This investigation, conducted under the hypothesis that more long-lasting rainfall will occur over broader areas as global warming becomes more severe, was intended to examine when such periods might become observed more often (e.g., after 2060).
4 RESULTS
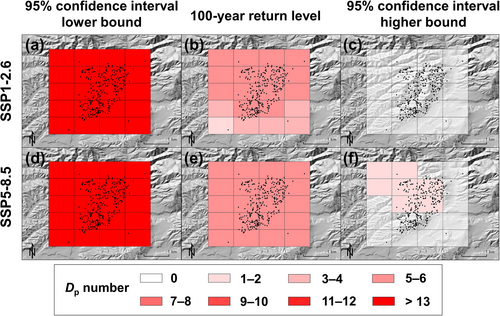
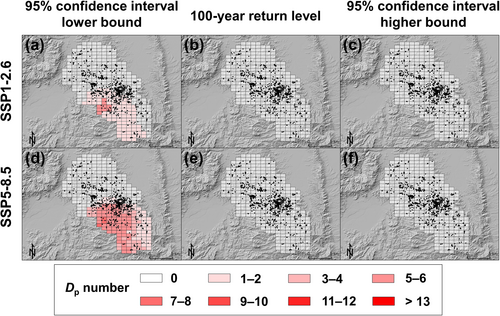
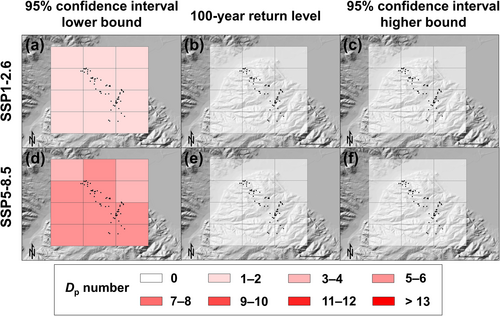
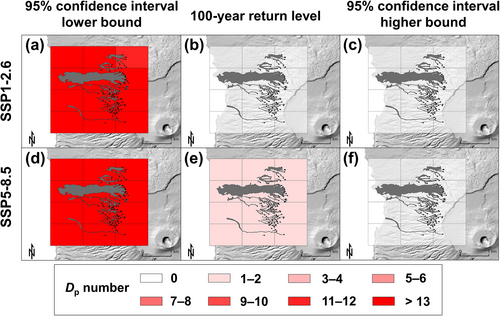
The number of occurrences of Dp instances was different between the examined global warming scenarios (Figures 3-12). In the MIROC6 simulations under the SSP1–2.6 and SSP5–8.5 scenarios, when the lower bound of 95% confidence interval with respect to the 100-year return level was used as the proxy threshold, Dp instances were observed from 2015 to 2,100 in nine of the examined regions, but not for the result under the SSP5–8.5 scenario in the Aso region (Figures 3-12). Focusing on the difference in the global warming scenarios, in the simulations under the SSP5–8.5 scenario, a large number of Dp instances tended to occur at the same grid cells in seven regions (i.e., Tokachi, Marumori, Okaya, Kii-Peninsula, Higashihiroshima, Uwajima and Asakura), in comparison with the results of the simulations under the SSP1–2.6 scenario (Figures 3, 5, 6, 8-11). In six regions (i.e., Tokachi, Hidaka, Okaya, Izu-Oshima, Kii-Peninsula and Uwajima), at least one Dp instance was observed in all examined grid cells regardless of the global warming scenario; thus, the spatial extent of Dp instances (number of grid cells with Dp > 1) did not differ (Figures 3, 4, 6-8, 10a, d). In the other three regions (i.e., Marumori, Higashihiroshima and Asakura), the number of cells with Dp > 1 increased in the simulation under the SSP5–8.5 scenario compared with that under the SSP1–2.6 scenario (Figures 5, 9, 11a, d). In the Aso region only, the number and spatial extent of Dp instances of the simulation under the SSP5–8.5 scenario were below those obtained under the SSP1–2.6 scenario (Figure 12a, d). When the 100-year return level was used as the proxy threshold, Dp instances were observed in six regions (i.e., Tokachi, Hidaka, Izu-Oshima, Kii-Peninsula, Uwajima and Asakura) (Figures 3,4,7,8,10, 11b, e). Except for the Asakura region (Figure 11b, e), the number and spatial extent of Dp instances increased in the simulations under the SSP5–8.5 scenario compared with those obtained under the SSP1–2.6 scenario (Figures 3, 4, 7, 8, 10b, e). A similar trend was also observed in the Hidaka and Kii-Peninsula regions when the higher bound of the 95% confidence interval was used as the proxy threshold (Figures 4, 8c, f). These results highlight that severe global warming might increasingly intensify landslide hazards in most regions in Japan.
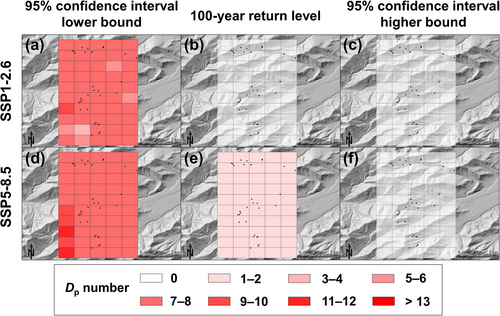
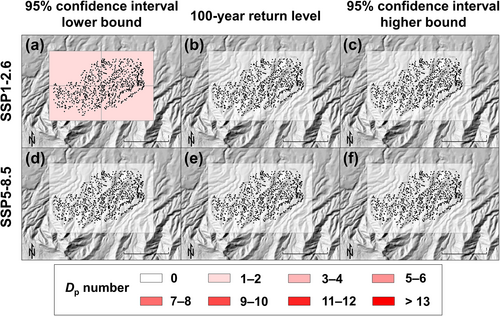
A somewhat similar trend was observed in the MRI-ESM 2 simulations (Figures S11–S20). In the Higashihiroshima and Uwajima regions, when the lower bound of the 95% confidence interval with respect to the 100-year return level was used as the proxy threshold, the number and spatial extent of Dp instances of the simulation under the SSP5–8.5 scenario were below those obtained under the SSP1–2.6 scenario (Figures S17, S18a, d). Thus, the trend of projection of Dp instances does not necessarily correspond between the two GCM simulations. However, in the Izu-Oshima and Kii-Peninsula regions, the simulations under the SSP5–8.5 scenario projected increases in the number and spatial extent of Dp instances compared with those obtained under the SSP1–2.6 scenario, especially for the proxy thresholds of the 100-year return level of 72-h rainfall and its higher bound of the 95% confidence interval (Figures S15 and S16). Therefore, although the projected trends are not completely coincident among the GCMs in all examined regions, in some regions, severe global warming might enhance the possibility of landslide occurrence by intensifying the rainfall.
As mentioned above, the lower bound of the 95% confidence interval with respect to the 100-year return level diagnosed the largest number of Dp instances, and those Dp instances were investigated to identify the timing of the increase in rainfall with the potential for landslide occurrence. In the MIROC6 simulations, the number of Dp rainfall events (i.e., rainfall for which a Dp instance was observed somewhere in a grid cell) from 2061 to 2,100 (latter projection period) exceeded that from 2015 to 2060 (former projection period) in seven regions: the Tokachi and Aso regions (under the SSP1–2.6 scenario), the Hidaka, Izu-Oshima, Kii-Peninsula and Uwajima regions (under the SSP5–8.5 scenario) and the Okaya region (under both the SSP1–2.6 and the SSP5–8.5 scenarios) (Table 2). In the MRI-ESM 2 simulations, the number of Dp events from 2061 to 2,100 exceeded that from 2015 to 2060 in six regions: the Tokachi, Hidaka and Kii-Peninsula regions (under the SSP1–2.6 scenario) and the Okaya, Higashihiroshima and Aso regions (under the SSP5–8.5 scenario) (Table 2). Except for the Aso region, where only one Dp event was projected, an increase in Dp events from the earlier projection period (2015–2060) to the later projection period (2061–2,100) was observed in both the MIROC6 and the MRI-ESM 2 GCM simulations in the Tokachi, Hidaka, Okaya and Kii-Peninsula regions (Table 2). Focusing on the simulations under the SSP1–2.6 scenario, more than twice the number of Dp events were projected for the period 2015–2060 compared with 2061–2,100 in the Izu-Oshima and Kii-Peninsula regions (MIROC5) and the Okaya, Higashihiroshima, Uwajima and Asakura regions (MRI-ESM 2) (Table 2). Thus, time series changes in the landslide probability might vary depending on the global warming scenario and region.
| Region | Number of Dp events projected by MIROC6 | Number of Dp events projected by MRI-ESM 2 | ||||||
|---|---|---|---|---|---|---|---|---|
| SSP1–2.6 | SSP5–8.5 | SSP1–2.6 | SSP5–8.5 | |||||
| 2015–2060 | 2061–2,100 | 2015–2060 | 2061–2,100 | 2015–2060 | 2061–2,100 | 2015–2060 | 2061–2,100 | |
| Tokachi | 1 | 3 | 2 | 2 | 1 | 5 | 4 | 4 |
| Hidaka | 6 | 6 | 5 | 6 | 5 | 8 | 10 | 8 |
| Marumori | 1 | 1 | 2 | 1 | 3 | 3 | 4 | 4 |
| Okaya | 1 | 2 | 0 | 2 | 6 | 2 | 2 | 6 |
| Izu-Oshima | 5 | 2 | 3 | 5 | 2 | 2 | 3 | 2 |
| Kii-Peninsula | 13 | 6 | 9 | 14 | 13 | 15 | 13 | 9 |
| Higashihiroshima | 1 | 0 | 0 | 2 | 6 | 2 | 0 | 4 |
| Uwajima | 3 | 2 | 2 | 5 | 6 | 2 | 1 | 1 |
| Asakura | 1 | 1 | 2 | 2 | 3 | 1 | 3 | 1 |
| Aso | 0 | 1 | 0 | 0 | 1 | 0 | 0 | 1 |
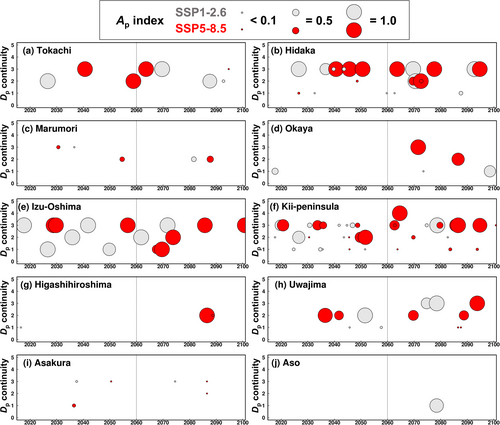
The continuity and spatial extent of Dp events differed depending on the examined regions and the global warming scenarios (Figure 13). In the MIROC6 simulations, the maximum continuity of Dp events under the SSP5–8.5 scenario was greater than that under the SSP1–2.6 scenario in three regions (i.e., Okaya, Kii-Peninsula, Higashihiroshima) (Figure 13d, f, g). Corresponding maxima under the SSP5–8.5 scenario were observed in the latter (2061–2,100) period (Figure 13d, f, g). In the Okaya and Higashihiroshima regions, the corresponding high continuity of Dp events indicates the highest Ap index value of close to 1 (Figure 13d, g). In the Aso region, because a Dp event was not projected under the SSP5–8.5 scenario, the maximum continuity and Ap index of Dp events were observed in the simulation under the SSP1–2.6 scenario (Figure 13j). In the other six regions, the maximum continuity and Ap index of Dp events were comparable between the SSP1–2.6 and SSP5–8.5 scenarios (Figure 13a–c, e, h, i). Accordingly, the MIROC6 simulations projected that severe global warming might result in long-lasting and widespread intense rainfall in some regions, which could consequentially lead to higher landslide probability, especially after the 2060s.
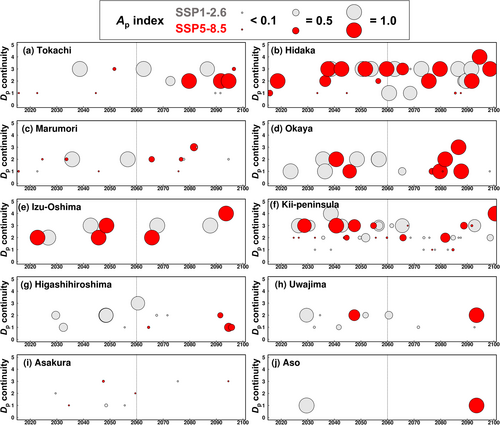
In the MRI-ESM 2 simulation, the Dp continuity under the SSP5–8.5 scenario was greater than that under the SSP1–2.6 scenario in three regions (i.e., Hidaka, Okaya and Izu-Oshima) (Figure 14b, d, e). During these Dp events with high continuity, the Ap index approached a high value (~1) (Figure 14b, d, e). Conversely, the Dp continuity under the SSP1–2.6 scenario was greater than that under the SSP5–8.5 scenario in the Higashihiroshima region (Figure 14g). The difference in the Ap index between the SSP1–2.6 and SSP5–8.5 scenarios was substantial in the Marumori and Higashihiroshima regions (Figure 14c, g). In these cases, a Dp rainfall event with a greater Ap value was observed in the simulation under the SSP1–2.6 scenario before the 2060s (Figure 14c, g). Therefore, the projected rainfall continuity and affected area differed somewhat between the GCMs used, i.e., some simulations projected a high potential for landslide occurrence in the near future (until 2060), even under moderate global warming.
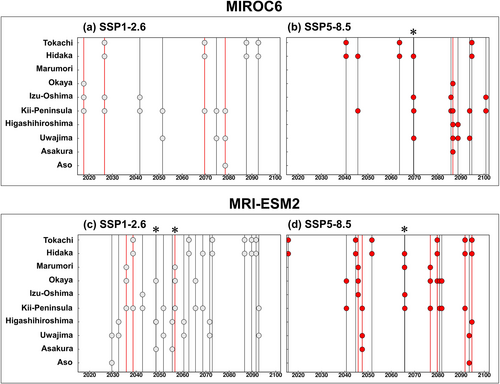
In accordance with intensifying global warming, severe rainfall with the potential for landslide occurrence might occur in various regions. In the MIROC6 simulation under the SSP1–2.6 scenario, Dp rainfall events were observed within a period of 72 h twice in two regions during 2015–2060, and such cases occurred three times during 2061–2,100 (Figure 15a). Additionally, Dp rainfall events were observed within a period of 72 h twice in three or four regions during both 2015–2060 and 2061–2,100 (Figure 15a). In the MIROC6 simulation under the SSP5–8.5 scenario, the number of Dp rainfall events occurring in multiple regions increased in the period 2061–2,100 (Figure 15b). Within a period of 72 h in two regions, Dp rainfall events were observed twice during 2015–2060, and such cases occurred eight times during 2061–2,100 (Figure 15b). The number of regions in which Dp events occurred with similar timing also increased, i.e., Dp rainfall events were observed within a period of 72 h in five regions once in the late 2080s (Figure 15b). In the MRI-ESM 2 simulation under the SSP1–2.6 scenario, Dp rainfall events were observed within a period of 72 h in three regions three times during 2015–2060, whereas no such case occurred during 2061–2,100 (Figure 15c). Additionally, Dp rainfall events were observed within a period of 72 h in two regions 8 times during 2015–2060, and such cases occurred 10 times during 2061–2,100 (Figure 15c). In the MRI-ESM 2 simulation under the SSP5–8.5 scenario, Dp rainfall events were observed within a period of 72 h in three regions six times (twice during 2015–2060 and four times during 2061–2,100), highlighting the increase in such cases with time (Figure 15d). Within a period of 72 h in two regions, Dp rainfall events were observed four times during 2015–2060, and such cases occurred five times during 2061–2,100 (Figure 15d). Therefore, although the extent of the impact of global warming varies among the GCMs, related rainfall intensification might increase landslide probability in multiple regions.
5 DISCUSSION
In Japan, rainfall projected by the examined GCMs indicates that the frequency of rainfall with the potential to trigger landslides might increase as global warming becomes more severe (Figures 3-12). If unrestrained emission of greenhouse gases continues (i.e., the SSP5–8.5 scenario), with an approximate boundary in the 2060s, landslides might occur more frequently and synchronously in different regions, and their impact could be over a broader spatial extent owing to increase in long-lasting widespread areas of rain (Figures 13-15). Notably, the rainfall projected by the GCMs inevitably includes uncertainty. Especially in the future period, e.g., after 2060, uncertainty in the projected rainfall increases owing to an increase in two major components of uncertainty: model-related uncertainty arising from differences and selections in model construction, model tuning and the simulation of responses to external forces; and scenario-based uncertainty arising from difficulties in constraints regarding future radiative forcing, attributable primarily to the uncertainty in future greenhouse gas emissions (Lehner et al., 2020). Partitioning these uncertainties is generally difficult because the use of a limited number of GCMs (Lehner et al., 2020) impedes quantitative evaluation of the uncertainty of the presented projection with respect to the future landslide probability. Thus, the obtained results cannot be considered definitive; instead, they should be interpreted in terms of the common trends between the examined GCMs. In this sense, because the simulations using MIROC6 and MRI-ESM 2 under the severe global warming scenario (SSP5–8.5) similarly indicate an increase in landslide probability (Figures 3-12, S11–S20), the obtained trend is considered somewhat robust. Therefore, future variations of when and where landslides might occur could be modulated, depending on human efforts with respect to the reduction in greenhouse gas emissions.
Variations in emissions of both greenhouse gases and aerosols might influence the future landslide probability. Simulations under the SSP1–2.6 scenario indicate a higher probability of landslides during 2015–2060 compared with 2061–2,100 in some regions (Table 2, Figures 13-15). This high landslide probability suggests that intense rainfall might occur more frequently before 2060 rather than after 2060. Therefore, in Japan, rainfall intensity will not be constrained solely by differences in warming (Hayashi et al., 2024; Ishizaki et al., 2022). Under the SSP1–2.6 scenario, substantial efforts to reduce air pollutants are assumed to mitigate global warming, leading to a rapid decline in anthropogenic aerosol emissions from East Asia, particularly East China (Hayashi et al., 2024). The resulting cleaner atmosphere enhances surface downward shortwave radiation around Japan, increasing evaporation (Hayashi et al., 2024). Thus, under the SSP1–2.6 scenario, GCMs project an increase in precipitation in Japan before 2050 (Hayashi et al., 2024). Consequently, the relatively high landslide probability during 2015–2060 is likely attributable to severe rainfall intensified by reduced aerosol concentrations. In this context, for robust evaluation of the impact of climate change on rainfall that potentially triggers landslides, it is crucial to constrain future variations in both greenhouse gas emissions and aerosol concentrations.
A caveat is that the presented approach ignores the details of rainfall patterns that trigger landslides. In the Tokachi region, the rainfall that triggered the landslide event on August 31, 2016, did not reach the highest recorded 72-h rainfall since 1976 (Tsunetaka, 2021). Instead, on August 31, 2016, the hourly rainfall peak occurred synchronously with the peak of the 72-h rainfall and triggered the landslide, indicating that landslides in this region are triggered by coincident rainfall peaks with different time spans (Tsunetaka, 2021). In such regions, where landslides are triggered by the combination of rainfall peaks with various time spans, the presented approach based on the return level of the 72-h rainfall inevitably leads to an overestimation of intense rainfall with the potential to trigger landslides. In the Asakura region, when not only the long-term (e.g., 72 h) rainfall but also the short-term (e.g., 3 h) rainfall exceeded the 100-year return level, more landslides tended to occur with higher density and larger size, in comparison with those in areas where only the rainfall of a specific time span exceeded the 100-year return level (Mtibaa & Tsunetaka, 2023). Moreover, in the Kii-Peninsula region, the representative time span of rainfall for landslide occurrence varies depending on the lithological setting, which likely relates to differences in the hydrological response of hillslopes (Marc et al., 2019). In this context, the representative time span of the triggering rainfall differs between shallow- and deep-seated landslides (Marc et al., 2019). Therefore, to evaluate the occurrence probability of multiple types of landslides (e.g., shallow and deep-seated), with consideration of their magnitude and density in broader areas across different lithological settings, investigation of rainfall with multiple time spans would be crucial. In other words, as in the Tokachi, Asakura and Kii-Peninsula regions, the applicability of the presented approach for diagnosing future landslide probability becomes more uncertain in other countries and regions where landslide occurrence and density are governed by a combination of rainfall peaks over varying time spans rather than by total rainfall amount.
To constrain the impact of climate change on landslide probability in detail, an increase in the temporal resolution of rainfall estimates projected by GCMs is demanded. Currently, by investigating whether previous landslides were triggered by the highest recorded 72-h rainfall, we can evaluate to some degree whether the presented approach can adequately diagnose landslide-triggering rainfall. In Japan, previous landslide-triggering rainfall mostly reached the highest recorded 72-h rainfall (Tsunetaka, 2021), which confirms that the presented approach is reasonable, to a certain extent, for the evaluation of landslide probability in Japan. Additionally, even if the 100-year return level of the 24-h rainfall and its 95% confidence interval were used as proxy thresholds, the overall trend of the projected landslide probability is broadly similar to the results based on the 72-h rainfall (i.e., the frequency of rainfall with potential to trigger landslides might increase as global warming becomes more severe) (Figures S25–S44). This suggests that intense 72-h rainfall is likely correlated with intense 24-h rainfall, implying some redundancy in the available time span of rainfall for proxy thresholds. Importantly, relatively high accumulated rainfall does not necessarily accompany short-duration intense rainfall. In the MRI-ESM 2 simulations under the SSP1–2.6 scenario, the proxy threshold based on the 72-h rainfall projected higher landslide probability compared with that based on 24-h rainfall in the Higashihiroshima region (e.g., Figures S17a and S38a). Considering that previous landslides were triggered by rainfall accumulation over 24 h rather than by short-duration intense rainfall in this region (Tsunetaka, 2021), the application of relatively short time spans for rainfall in the presented approach might lead to neglect of long-lasting heavy rainfall and cause underestimation of landslide probability.
In the Tokachi, Hidaka, Okaya and Kii-Peninsula regions, the number of Dp events during 2061–2,100 was greater than that during 2015–2060 in two or more simulation cases (Table 2). In part or in all areas of these regions, the climate classification is projected to change from Dfb to Dfa (Tokachi and Hidaka) or from Dfa or Dfb to Cfa (Okaya and Kii-Peninsula) from the present (1991–2020) to the future (2071–2099) periods (Figures S1, S2, S4, S6). Such changes in the climate classification reflect a substantial alteration in both temperature and precipitation, highlighting that landslide probability is susceptible to climate change. A large part of northern Japan, where the Tokachi and Hidaka regions are located, is classified as having a cold climate (i.e., category D), even in the future period under severe global warming (Figure 1b, c). In contrast, areas currently classified as category D owing to their high elevation, e.g., southern areas such as the Okaya and Kii-Peninsula regions, are projected to shift to a temperate climate (i.e., category C) in the future (Figure 1b, c). In the Okaya and Kii-Peninsula regions, continuous and widespread rainfall with the potential to cause landslide occurrence is projected to increase with time (Figures 13 and 14). Therefore, in such high-elevation areas of Japan, the shift from a cold to a more temperate climate means that landslide-triggering events might become substantially enhanced in the future, potentially resulting in a higher rate of export of stripped sediment, soil and trees.
The presented approach considers only future changes in rainfall and ignores changes in the boundary conditions of hillslopes (e.g., changes in vegetation cover, land use and landscape and the effects of external perturbations such as earthquakes and volcanic eruptions). Given that rainfall conditions are the main determinants of landslide properties and occurrences (Bellugi et al., 2015; Mondini, Guzzetti, & Melillo, 2023; Mtibaa & Tsunetaka, 2023), the use of only rainfall data is a reasonable simplification to minimize influences arising from the uncertainties of projections of hillslope conditions. However, linkages between the rainfall return level and the triggering of landslides are likely produced by the landscape equilibrium resulting from hillslope coevolution attributable to the balance between soil and regolith recovery and previous erosion (landsliding) (Marc et al., 2019). Thus, depending on the recovery rate of the soil and regolith of hillslopes, projected frequent intense rainfall will not necessarily trigger repeated landslides (Montgomery et al., 2000; Perron, 2017). Moreover, the time scales required to achieve hillslope coevolution (e.g., 100–1,000 years; Marc et al., 2019) are not well constrained but might be modulated in response to changes in environmental conditions, e.g., weathering and soil production facilitated by the increase in mean annual precipitation (Chadwick et al., 2013; Heimsath, Chappell, & Fifield, 2010; Norton, Molnar, & Schlunegger, 2014; Owen et al., 2011; Pelletier & Rasmussen, 2009). If changes on such time scales are substantial, the assumption that the 100-year return level based on the current climate could be available as a proxy threshold for landslide-triggering rainfall might be irrational. In this context, rainfall conditions with the potential to trigger landslides could themselves change in response to climate change through landscape evolution, which is a subject that deserves consideration for further robust and long-term projection of changes in future landslide probability.
6 CONCLUSIONS
This study investigated whether rainfall with the potential to trigger landslides will increase in accordance with the effects of climate change in 10 regions of Japan where widespread landslides occurred during 2003–2019. Using projected rainfall during 2015–2,100 from GCM simulations, differences in the number and occurrence years of such potential landslide-triggering rainfall were compared in relation to the level of global warming. The obtained results projected that rainfall with the potential to trigger landslides will increase in some regions toward 2,100 in response to increasingly intensified global warming. The projected extent to which changes in climate might enhance landslide probability with time differed between the examined regions under different climate change scenarios. Given a scenario in which future greenhouse gas emissions continue to increase owing to lack of adequate regulation, and taking 2060 as the approximate boundary, intense rainfall events with the potential to trigger landslides are projected to become more frequent and widespread in some regions. In relation to this intensifying precipitation, rainfall with landslide-triggering potential might occur synchronously in two to five regions. Moreover, even under the moderate global warming scenario, rainfall might intensify before 2060 owing to rapid decline in aerosol concentration, resulting in a projection of high landslide probability in certain regions. Taken together, regarding the future occurrence of landslides in Japan, the extent of human efforts to mitigate global warming might alter the frequency and region of hazard of landslide occurrence. These projections are not definitive and should be continuously refined and renewed using more advanced approaches and the accumulation of related data. Nevertheless, the presented approach is meaningful in terms of providing a unifying framework for comparison of the impacts of climate change on landslides.
CONFLICT OF INTEREST STATEMENT
The authors declare that they have no competing interests.
ACKNOWLEDGEMENTS
The authors thank Odin Marc and the two anonymous reviewers for their insightful comments. This research was supported by the Japan Society for the Promotion of Science KAKENHI (Grant Number 23 K13987) and the Environment Research and Technology Development Fund (JPMEERF20S11808) of the Environmental Restoration and Conservation Agency of Japan. We thank James Buxton MSc, from Edanz (https://jp.edanz.com/ac), for editing a draft of this manuscript.
Open Research
DATA AVAILABILITY STATEMENT
The rainfall data projected by the GCMs are available from the following website: https://www.nies.go.jp/doi/10.17595/20210501.001-e.html. The metastatistical extreme value distribution was calculated using the distributed code: https://github.com/EnricoZorzetto/mevpy.


