Comparison of Dynamic Charge Acceptance Tests on Lead–Acid Cells for Carbon Additive Screening
Abstract
Including a certain amount of carbon in the negative active material is currently the state-of-the-art method to improve the dynamic charge acceptance (DCA) of lead–acid batteries. The DCA is a key parameter of batteries used in microhybrid cars where brake energy recuperation is implemented. To find the optimal carbon additive, it is essential to test the carbon both in short-term and long-term tests. This work investigates the long-term and short-term DCA of 2 V, 2.5 Ah lead–acid cells and correlates the results with the external surface area of the carbon. Five different carbons with tailored particle size (27–633 nm) and external surface area (7.1–159.3 m2 g−1) are employed as additives in the negative electrodes. The charge acceptance of cells according to the charge acceptance test 2 (SBA), the DCA (EN) test, and the run-in DCA test (Ford) is increased via an increase in the carbon external surface area. A correlation between the short-term tests and the first week of the run-in DCA test is established for the carbon impact. After several weeks of run-in DCA test, the carbon effect is diminished and only a differentiation between high and low DCA cells is possible.
1 Introduction
The charge acceptance (CA) of lead–acid batteries (LABs) has become one of the important criteria for their application in microhybrid vehicles. In such applications, the LABs are operated mainly at a partial state-of-charge (PSoC) due to the additional functions of brake energy recuperation and stop/start.[1] As the CA of LABs is dependent on the history of the cells, a new definition of CA, known as the “dynamic charge acceptance” or DCA, has been introduced.[2] Improved DCA for 12 V batteries is essential for car makers to reduce fuel consumption as well as CO2 emissions by energy recuperation from the braking system.[3] Several tests exist to evaluate the DCA. One short test, the “CA test 2,” was developed by the Battery Association of Japan (SBA S0101:2014).[4] This test includes a single charge pulse after the battery has been preconditioned and discharged into a 91.5% SoC. The European committee has developed a DCA test method (EN 50342-6), in which the CA is determined after various charge and discharge histories of batteries as well as during a 1 week stop/start driving cycle (DCRss).[5] These two short-term CA tests are widely used to estimate the rechargeability of 12 V LABs.[6]
LABs are faced with a lack of predictability and consistency for the DCA under realistic long-term vehicle usage conditions.[7] There is often a discrepancy between the long-term DCA performance of a battery in the field and the prediction based on the short-term tests.[8] This means that after several months of vehicle operation, the batteries would not necessarily experience the same benefits in terms of fuel-saving and electric function availability as at the beginning of service life. Batteries and active material compositions that perform well in the DCA short test sometimes exhibit a rather poor DCA in field tests. Therefore, it is essential to adapt the established DCA tests to the laboratory cell level. Furthermore, these cells shall be subjected to short-term and long-term DCA tests to understand the discrepancy that arises. Such information is needed to guide and improve active materials development.
Various studies have shown that an incorporation of small amounts of carbon in the negative active material (NAM) can increase not only the cycle life at PSoC,[9-13] but also the CA of LABs.[10, 14-16] The possible functions of carbon in terms of an improved cycle life at high rate PSoC (HRPSoC) have been summarized[17] as follows: 1) enhancing the overall conductivity of NAM;[18] 2) limiting the PbSO4 crystal growth;[19] 3) decreasing the hydrogen overpotential and facilitating hydrogen emission;[20] and 4) providing a capacitive contribution in case of high surface area carbons.[21] Novel additive combinations, often involving carbons in the NAM, have resulted in a two- to threefold increase of DCA,[22] but the role of carbon in this improve requires further investigation.
This work aims to improve the cell-level measurement methodology for DCA and to evaluate different CA tests for the purpose of carbon material screening. As material screening is normally carried out on the lab scale, this study demonstrates the DCA testing can be an effective measurement tool in the 2 V cell size. For this purpose, it is important that carbon additives generate a significant difference in the CA. In a previous study,[14] it was found that the external surface area of the carbon materials increased the short-term DCA of laboratory cells according to the DCA EN test.[14] Therefore, in the present work, similar carbon additives that have a distinct difference in the external surface area (ranging from 7 to 159 m2 g−1) were used as additives for negative electrodes to ensure that differences in the DCA could be seen. The 2 V, 2.5 Ah lead–acid cells were subjected to the short-term (CA 2 from SBA and DCA from EN) and long-term (run-in DCA) CA tests.
2 Results
2.1 Structural Properties of the Carbon and Lead–Carbon Electrodes
To understand the impact of the additives on the long-term DCA, a characterization of the carbons themselves is necessary. The textural properties of the carbon powders as well as of the cured lead–carbon electrodes obtained from the N2 sorption measurements are presented in Table 1. The carbons have a similar specific Brunauer, Emmett, and Teller (BET) surface area (SBET) and specific pore volume (Vmic). In contrast, the specific external surface area (Sext) of the carbons varies from 7.1 up to 159.3 m2 g−1, while the average particle size (dpart) changes between 27 and 633 nm. Sext is the surface area generated by the interparticle pores and the envelope surface area of the particles. As the surface-area-to-volume ratio of a sphere is inversely proportional to its diameter, Sext increases with decreasing the particle diameter. The structural properties of the carbons (Table 1) are in line with the previous published study[14] in which the carbon xerogels, synthesized by a similar procedure, were used.
| Material | Carbon | Electrode | ||||
|---|---|---|---|---|---|---|
| V mic [cm3 g−1] | S BET [m2 g−1] | S ext [m2 g−1] | d part [nm] | S BET [m2 g−1] | S ext [m2 g−1] | |
| C1 | 0.262 | 685.9 | 7.1 | 633 | 11.0 | 3.6 |
| C2 | 0.262 | 699.1 | 20.3 | 221 | 10.9 | 3.0 |
| C3 | 0.254 | 706.5 | 50.4 | 88 | 10.2 | 3.9 |
| C4 | 0.244 | 713.3 | 92.1 | 48 | 6.9 | 4.4 |
| C5 | 0.226 | 717.6 | 159.3 | 27 | 6.7 | 5.6 |
The SBET of the cured lead–carbon electrodes is between 6.7 and 11 m2 g−1. The negative electrodes containing carbons with larger particle sizes provide higher SBET. It can be assumed that micropores in the negative electrode structure are mainly associated with the carbon additive. It is likely that some of the micropores in the outer parts of the carbon might be blocked by paste components such as lignosulfonate or lead oxide during mixing and curing. The blocking of micropores seems to be more significant for the smaller carbon particles.
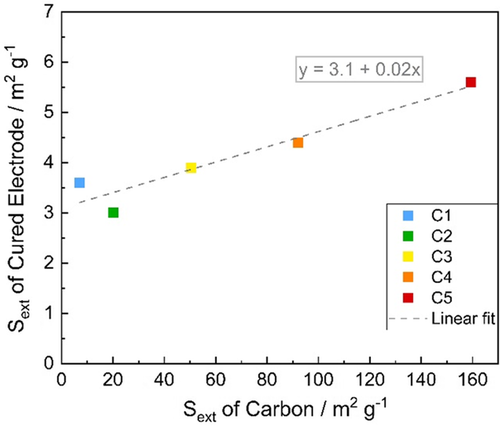
In Equation (1), the surface contribution of the other additives in the negative paste is neglected. The slope of the linear fit in Figure 1 is 0.02, which is perfectly in line with the equation above implying that additional external surface of the carbon directly enlarges the external surface of the cured active mass by the same amount. Therefore, the negative electrodes containing carbon additives with larger Sext result in higher Sext of the electrodes as well.
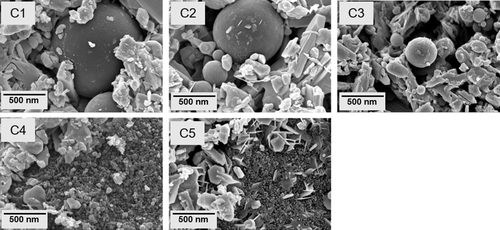
Figure 2 presents the SEM micrographs of the cured lead–carbon electrodes. The spherical particles in the micrographs are the carbon particles, which are generally darker than the surrounding structure. The decrease of carbon particle size from C1 to C5 can be easily recognized. As the carbon particle size is reduced, the carbon particles are mainly present as agglomerates such as can be seen with C4 and C5. Therefore, the volume of the free carbon particles (as opposed to embedded carbon) in the lead skeleton is expected to be larger. This may influence the adsorption of lignosulfonate to the carbon surface leading to different electrochemical activity of the carbon surface. The particles in SEM pictures with much lighter color are lead oxide and tribasic lead sulfate (3BS), which are interconnected during the curing process. Tetrabasic lead sulfate (4BS) crystals are not observed because the drying part of the curing procedure was carried out at 45 °C.
2.2 DCA of Lead–Carbon Electrodes
This work investigates the influence of carbon additives not only on short-term DCA, but also on the long-term DCA test. Additionally, the different CA tests are compared on the 2 V cell level to validate the screening of carbon additives. The results obtained from three different CA tests are presented and discussed in the following paragraphs.
2.2.1 CA Test 2 According to SBA
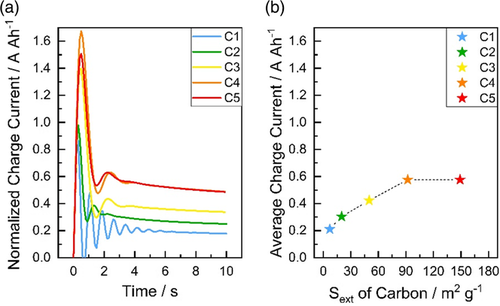
The normalized charge currents during the 10 s charge and the average charge current with respect to the Sext of the carbon additive for all five cells are presented in Figure 3a,b, respectively. The current values were normalized to the 20 h discharge capacity of the corresponding cell. The current overshoot during the first seconds in Figure 3a is an artifact due to the voltage regulation of the battery test channel, but its effect on the average charge currents is less than 5%. As shown in Figure 3a, the charge current values increase stepwise from C1 to C4. The cells with C4 and C5 provide almost the same charge currents. As can be seen in Figure 3b, the average charge current depends almost directly on the Sext of the carbon additive. An increase of the Sext of carbon from 7.1 m2 g−1 (C1) to 92.1 m2 g−1 (C4) enhances the CA of cell from 0.21 A Ah−1 (C1) to 0.58 A Ah−1 (C4). In comparison to C4, an additional increase of the Sext of carbon to 159.3 m2 g−1 (C5) does not further improve the CA. This result may be attributed to several effects. First, the plateau in CA might be due to the limitation of mixing the negative paste components with the small carbon particles. Due to the agglomeration of smaller sized carbon (Figure 2), mixing such particles is much more difficult. Second, the CA plateau may be originated from other limitations in the cell such as electrode grid or the CA of the positive electrode rather than the NAM. Third, the adsorption of lignosulfonate to the carbon surface may have reached a maximum for C4. Thus, an additional increase of carbon external surface area might not influence the interaction between carbon and lignosulfonate significantly. As a result, the influence of carbon additives on the charging currents may be revealed by applying this static CA test containing a single charge pulse. However, it is possible that even this test may not show a difference in the CA of cells consisting of highly active carbons (C4 and C5).
2.2.2 DCA Test According to EN
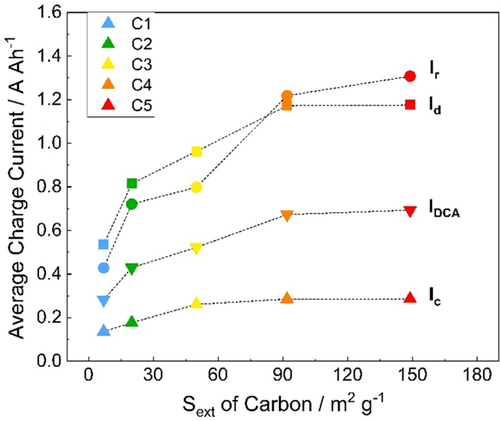
The normalized charge currents obtained from each charge pulse in the quick DCA (qDCA) (Ic and Id) and DCRss parts of the test (Ir) are shown in Figure 4. As seen for Ic, the charge currents increase for C1–C3 over the 20 cycles (Figure 4a). The cells containing C4 and C5 provide comparable charge currents with C3. In case of Id and Ir, the charge currents improve from C1 to C5 (with decreased carbon particle size and increased Sext), although only minor differences between C4 and C5 cells are evident (Figure 4b,c). This plateau in the response was also observed in the results obtained from the SBA CA test and might be attributed to other unknown limiting effects in the battery (e.g., grids and dispersion of carbon particles). These limiting effects hinder a further improvement of the DCA by adding more carbon surface to the NAM.
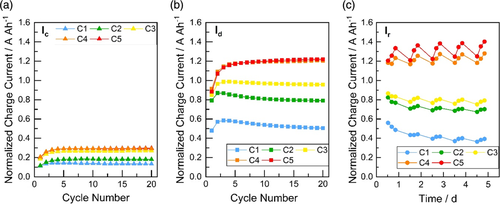
The change of the CA during the microcycles is also of interest. In case of Ic, the normalized charge currents increase in all cells for the first three cycles. The current values then remain stable during the next 20 cycles. For Id, the higher DCA cells (C4 and C5) exhibit stable DCA cycling over 20 cycles after the maximum charge current value is reached in cycle 3. The charging currents slightly decrease during 20 cycles with the lower DCA cells (C1 and C2). The charging behavior of the laboratory cells obtained from the qDCA section of the test (Ic and Id) is similar to that of the 12 V batteries.[1] For the charge current Ir, a reduced DCA is observed after every night and the DCA increases during the day. This behavior is known from the trend in the DCRss profile known from 12 V batteries.[1] In looking at the start and end of the week, the DCA values remain almost the same for C4 and C5, while there is a slight decrease for C1 (0.2 A Ah−1), and C2 and C3 (0.1 A Ah−1). Despite this drop, the effect of carbon is still maintained during the week.
The relationship between the average charge currents (Ic, Id, Ir, and IDCA) of the cells and Sext of the carbon additives is presented in Figure 5. The CA is improved via an increase of the carbon external surface area for all the different short-term histories, which was previously demonstrated for similar carbons.[14] In the published work, the DCA improvement is attributed to the higher electrochemical activity (e.g., specific double-layer capacitance) of the lead–carbon electrodes which comes with increasing external surface area of the carbon additives.[14] As shown in Figure 5, an increase of Sext from 7 m2 g−1 (C1) to 159 m2 g−1 (C5) promotes the final DCA value (IDCA) by more than a factor of 2. As with the SBA test, the charge currents of the C4 and C5 cells are essentially the same in the DCA test.
2.2.3 Run-In DCA Test
The recuperation currents (Irecu) of the cells obtained from the 1 week of the DCRss part of the EN test, followed by 3 weeks of the run-in test and 4 weeks of the run-in DCA test, are presented in Figure 6a. In this test, each week consists of 5 days of start/stop cycling followed by 2 days of weekend parking. There are 3 trips each day, meaning a total of 15 trips in a week. Each point shows the average DCA of a simulated trip. Each continuous line represents the moving average DCA of each cell, calculated from the 15 trips.
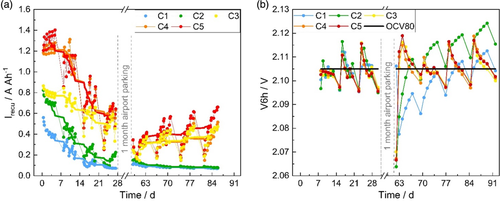
The run-in DCA test includes an ampere-hour balance to keep the SoC level at 80% SoC. The quasi-open-circuit voltage (OCV) of cells, called V6h, recorded after night and weekend parking during the whole run-in DCA test is plotted (Figure 6b) and the visible trend validates the algorithm. Each point illustrates an OCV value measured. The OCV values start from day 8 on because this algorithm is used only in the run-in DCA test. The first V6h value of cells (day 8), that recorded before starting the run-in test, is between 2.097 and 2.104 V. Thus, there is no significant difference in the OCV of cells after the DCRss part (EN test) due to acid stratification. The following five V6h values represent the OCVs after night parking from Monday to Friday. The sixth V6h is the OCV after weekend parking. During the first part of the run-in test (from day 8 to day 30), V6h of all cells shows a sawtooth swing, which indicates the validity of the algorithm in the run-in test for 2 V cell level. It can be clearly seen that an OCV of 2.105 V is needed to maintain the 80% SoC during testing. During the second part of the run-in test (from day 62 to day 91), C3, C4, and C5 all show the characteristic V6h behavior. For the cells C1 and C2, there is a continuous increase in the V6h values, which can be attributed to their low CA and therefore constant charging throughout the entire week. After airport parking, these cells cannot be easily charged to reach OCV80 value, particularly in the case of C1.
As shown in Figure 6a, the trend of the recuperation currents in the run-in test (from day 7 on) is similar to those in the DCRss part (EN test). The recuperation currents of cells increase during each trip and are followed by a reduction in the current values after every night. The high DCA cells (C3, C4, and C5) shown this typical trend during the 3 weeks of the run-in test and the 4 weeks of the run-in test after airport parking. In case of the low DCA cells (C1 and C2), this trend is partially obtained during the 3 weeks of the run-in test. However, after the airport parking, the low DCA cells do not show this typical trend and significantly lower recuperation currents are obtained. This observation is attributed to the self-amplifying effect of low DCA. It is known that the cells with low DCA tend to fade overproportionally in the run-in test due to an increased number of charging events after charge history. As the recuperation current of C1 and C2 falls below 0.15 A Ah−1, the cells cannot be efficiently recharged. In contrast, the high DCA cells can keep the CA values still high. This phenomenon is expected to be particularly dominant after longer rest periods (e.g., airport parking), which is clearly observed in Figure 6a. Thus, a correlation between the external surface area of the carbon and the DCA can only be established during the first 3 weeks of the run-in test. After airport parking, only high DCA cells (C3, C4, and C5) and low DCA cells (C1 and C2) can be differentiated.
A significant decline in Irecu is observed in the cycling behavior of the 2 V cells after each weekend (run-in test, from second to fourth week). Furthermore, all cells reach a plateau in the DCA values. These trends are known from commercial 12 V batteries.[1] At the end of the run-in test, all cells approach a minimum DCA value, which is also observed in commercial 12 V LABs.[7]
2.3 Comparison of CA Tests
The CA of laboratory test cells obtained from the CA test 2 according to SBA standard, the DCA test according to EN standard, and the run-in DCA test is compared in Figure 7. A linear correlation between the CA values from the SBA and EN tests can be established (Figure 7a). The average charge currents obtained for all cells from the SBA test are lower than the values in the EN test. This observation is unexpected and opposite of a parallel study conducted with different 2 V lead–acid cells, which examined the correlation between cell layout and DCA.[23] As the CA in the SBA test is determined after discharge history, the CA according to the SBA standard is expected to be higher than that obtained from the EN test, which is executed after charge, discharge, and during the course of several microcycles. The reason that the trend is the opposite in this study might be due to the electrical test order. Here, the freshly formed cells were first subjected to the CA test 2 from SBA. Afterward, the EN test, consisting of precycling, qDCA, and DCRss, was performed. As a result, the DCA of the negative electrodes, which are the limiting cell component, might have been increased due to active mass restructuring and postformation effects during precycling (two times reserve capacity and one C20 discharge).
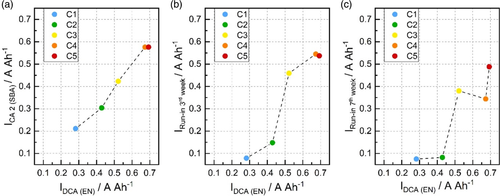
The relationship between the CA values according to the EN test and the third week of the run-in test is shown in Figure 7b. The y-axis presents the last value of the moving average of Irecu before airport parking (day 25 in Figure 6a). The cells containing carbons with low external surface area (C1 and C2) provide much lower charge currents in the run-in test than in the EN test. As described above, this observation can be explained by the fact that the run-in test depresses the DCA of cells with poor performance to minimum levels. In terms of the cells with high DCA (C4 and C5), the recuperation currents in the run-in test are still lower in comparison to the ones in DCA but the difference to the short-term DCA is smaller. Only in case of C3, the charge currents obtained from EN and first part of the run-in test are similar.
The impact of carbon external surface area is still evident even after 3 weeks of the run-in test. However, the proportionality between the carbon additives is not maintained at the end of the run-in test. As shown in Figure 7c, no clear correlation between the EN test and the seventh week of the run-in test can be found. This observation might originate from the characteristics of the run-in test. High DCA cells can maintain their charge currents at high levels, while the DCA values of cells with poor performance are reduced to the point that they can no longer practically provide brake energy recuperation, even if they are continuously charged.
3 Conclusion
In this work, the run-in DCA test was demonstrated to be a necessary test to understand the impact of carbon additives on the long-term usage of lead–acid cells. For this purpose, five different amorphous carbons with a specially adjusted particle sizes and thus various external surface areas were used as additives in the negative electrodes of 2 V lead–acid cells. The external surface area of the carbon ranges between 7.1 and 159.3 m2 g−1, while the particle size changes between 27 and 633 nm. The cured negative electrodes containing such carbon additives have an external surface area between 2.6 and 5.6 m2 g−1 and are almost linearly correlated with the external surface area of carbons. The SEM micrographs of the cured negative electrodes showed the presence of lead oxide, tribasic lead sulfates, and carbon particles. Additionally, agglomeration of carbon particles in the negative electrodes containing the smaller carbon additives was observed.
Three different CA tests, including the CA test 2 (SBA S0101:2014), the DCA test (EN 50 342-6:2015), and the run-in DCA test (Ford, Test B), were executed on 2 V, 2.5 Ah laboratory cells. In SBA, EN, and the first part of the run-in test, the cells containing carbons with higher external surface area also provided higher DCA. A clear proportionality between the external surface area of carbon and DCA was found. In case of the DCA values above 0.5 A Ah−1, a limit of this correlation was observed. This plateau effect is attributed to other factors in the test setup that limited the carbon effect, such as carbon agglomeration or a saturation in lignin adsorption.
The second part of the run-in DCA test, executed after airport parking, did not possess a clear correlation to the previous CA tests. This is due to the fact that the DCA of the cells, which was under a certain threshold value, was driven to a minimum DCA value of around 0.1 A Ah−1 by the test itself. Only cells with a higher DCA are able to maintain a certain DCA. In that case, an effect related to the carbon was observed. The highest DCA was obtained with the cell containing the carbon additive with the highest external surface area (159.3 m2 g−1).
In conclusion, the impact of carbon additives on CA in both short- and long-term DCA tests was revealed. The external surface area of carbon seems to be a crucial parameter to adjust not only the short-term, but also the long-term DCA. Both the short- and long-term DCA tests provide comparable values, to a certain extent such as before the 4 weeks pause in the test (airport parking), and allow a quantitative comparison of the effect of the additive. Moreover, the cycling behavior of 2 V cells during the DCA (EN 50 342-6:2015) and run-in DCA tests is similar to that already known for 12 V LABs.[1, 7] This validates the DCA test methodology for carbon additive screening in the 2 V cell.
4 Experimental Section
Tailored Carbon Additives
As in a previous work,[14] a new batch of five different amorphous carbon powders, each with a tailored particle size and specific external surface area, was used. These tailored carbons were provided by the Bavarian Center for Applied Energy Research (ZAE Bayern), the research group of Nanomaterials located in Würzburg. The spherical carbons with were synthesized via a sol–gel process based on the reactants of resorcinol and formaldehyde. To diminish the formation of a gel network, the concentration of the reactants in the organic aqueous solution was kept below 20%. The particle sizes were varied over a wide range by changing the molar ratio of resorcinol to catalyst (0.1 mol L−1 Na2CO3) from 700 to 3000. The solution was held for 24 h at 85 °C. The particles were extracted from the dispersion by convective drying over several days. Finally, the resultant organic powder was carbonized at 800 °C under an argon atmosphere. Further details on the synthesis procedure of the carbons are described in the literature.[24]
Preparation of Negative Electrodes and Laboratory Cells
Pastes were prepared to produce negative electrodes with the tailored carbon additives. These pastes were composed of leady oxide (ball mill process) as an active material, 13 wt% distilled water, 8 wt% diluted sulfuric acid (50 wt%, diluted from concentrated sulfuric acid, ACS grade, Sigma-Aldrich), 0.8 wt% barium sulfate (Merck) as a nucleation agent, 0.2 wt% sodium lignosulfonate (Vanisperse A, Borregaards Lignotech), and 2 wt% carbon additive. All given concentrations are relative to the amount of leady oxide amount, which is considered 100 wt%. The negative paste components were mixed in a SpeedMixer (Hauschild, Germany, DAC 400.1) for a total of 15 min, while the paste temperature was kept below 65 °C. Directly after mixing, the negative grids (Pb: 99 wt%, Sn: 0.92 wt%, Ca: 0.07 wt%, and Bi: 0.01 wt%) were manually prepared with (17 ± 1) g paste. The negative plates were cured at 45 °C in two steps. The first step was performed at a relative humidity of 99% for 15 h. In the second step, the relative humidity was reduced slowly to around 10% over the course of 7 h.
The 2 V laboratory test cells, consisting of one negative plate, two positive plates, and a reversible hydrogen electrode (RHE, Hydroflex, Gaskatel, Germany) as reference electrode, were assembled. The positive plates were enveloped by polyethylene separators (Daramic HP, Daramic LLC). The asymmetric design of two positive electrodes and one negative electrode (2P1N) was chosen in order to limit all cell properties by the negative electrode. The test cells provide a 20 h discharge capacity of around 2.5 Ah. The cells are named according to the carbon additive that they contain, i.e., cell C1 contains carbon additive C1, etc.
The container formation method was used for the electrochemical formation of the cured negative and positive plates. The test cells were filled with sulfuric acid with a density of 1.15 g mL−1. The formation procedure contains six different constant current (CC) steps. In the first five steps, cells were charged with CC of 0.4 · I20, 0.8 · I20, 1.2 · I20, and 1.6 · I20 for 30 min each. In the last step, a CC charging with 2 · I20 was applied for 34 h. The current I20 was calculated considering an empirical C20 capacity of 0.14 Ah g−1 according to the weight of the cured NAM.
Structural Characterization of Carbon and Lead–Carbon Electrodes
In case of the lead–carbon (negative) electrodes, the nitrogen sorption measurements were performed with an Autosorb 3B Quantachrome. Before analysis, the lead–carbon electrodes were degassed at 150 °C for 24 h.
Electrical Tests of Laboratory Cells
The CA of lead–acid cells was determined by applying short- and long-term CA tests. For the short-term testing, the CA test 2 according to SBA S0101:2014[4] and the DCA test from EN 50 342–6:2015[5] were employed. In case of long-term testing, the run-in DCA test (test B) developed by Ford was executed. The detailed procedure of these three tests can be found elsewhere[23] and a brief explanation of the tests is given below. In the rest of the article, the CA test 2 (SBA S0101:2014), the DCA (EN 50342-6:2015), and the run-in DCA (test B) will be referred to SBA, EN, and run-in test, respectively. The voltages from the original standard test procedures were divided by six (adapted from 12 V battery to the 2 V cell). The currents were scaled from a 70 Ah battery to the C20 of 2.5 Ah of a laboratory test cell (IN = I20).
CA Test 2 (SBA S0101:2014)
The fully charged cells were first discharged with 3.42·I20 for 30 min and then maintained in a rest period of 16 h. A constant voltage of 2.42 V was then applied for 10 s, in which the charging current was recorded. The CA of the cell was determined from the normalized current calculated from this 10 s charging pulse.
DCA Test (EN 50 342-6:2015)
Run-In DCA Test (Ford, Test B)
This long-term test simulates a real-world usage profile in microhybrid vehicles, which differentiates this test from accelerated laboratory tests to predict the DCA of a battery. The purpose of using this test was to investigate the applicability of the test on the laboratory cell level and to determine whether the run-in effect (decline in DCA over several weeks of cycling) could be also observed in 2 V cells. Furthermore, the effect of carbon additives on the short- and long-term DCA was investigated.
The run-in DCA test was conducted on the same cells after the DCRss part of the DCA (EN) test. The same key-off load resistors as in the DCRss (EN) test remained connected at the battery terminals, which discharged the cells by 25% SoC within 31 days. The run-in DCA test is a continuation of the DCRss (EN) test and includes 3 weeks of modified DCRss test, followed by 31 days of rest (called airport parking) and another 4 weeks of modified DCRss test. An ampere-hour balance was used to control the target of 80% SoC. Further details about the test procedure can be found in the literature.[23]
In this test, the following parameters had to be adjusted for the small laboratory test cells. For 12 V batteries, the change in the OCV of 1% SoC, known as the dV value, is generally between 10 and 15 mV. In case of 2 V cells, this value is expected to be divided by six. Taking the acid surplus into consideration, the change of 1% SoC generates an even lower dV. For this reason, a dV value of 1 mV was used. Furthermore, the OCV80 was set as 2.105 V for all cells based on the OCV after the end of DCRss test (EN). All other voltage values in the test were divided by six. The current values were also adjusted according to the C20 of cells.
Acknowledgements
The financial support received from the Advanced Lead-Acid Battery Consortium (ALABC Project 1618BST_CNP7_INTW) is gratefully acknowledged.
Open access funding enabled and organized by Projekt DEAL.
Conflict of Interest
The authors declare no conflict of interest.
Open Research
Data Availability Statement
The data that support the findings of this study are available from the corresponding author upon reasonable request.


