Enrichment of Sunflower Oil with γ-Tocopherol. Study by 1H NMR of Its Effect Under Accelerated Storage Conditions
Abstract
The effect of the enrichment of sunflower oil with γ-tocopherol on the evolution of its oxidation is the subject of this study. Sunflower oil and samples of this oil enriched with different γ-tocopherol concentrations are submitted to accelerated storage conditions and their evolution, until total polymerization is monitored by 1H NMR spectroscopy. The concentrations of linoleic acyl groups, of primary and of a great number of secondary oxidation compounds are determined throughout the process. These concentrations, and the times at which the main changes in them occur are analyzed to elucidate if they are valid markers of the global effect of γ-tocopherol enrichment. It is proved for the first time that certain comparisons between concentrations of some of the compounds formed in oxidation can lead to erroneous conclusions about the effect of this enrichment. It is shown that, during a first short period of time under accelerated storage conditions, the higher the concentration of γ-tocopherol the faster the degradation of linoleic acyl groups and the higher the concentration of hydroperoxides; after this first period this relationship is more complex. Generally, the higher the γ-tocopherol concentration the slower the degradation of the oil, except in the first period.
Practical Applications: This study provides very valuable information about the effect caused by enrichment with γ-tocopherol on sunflower oil oxidative stability and oxidation across a very broad range of concentrations. In addition, the amount of information obtained can be of great importance from several points of view because the oxidation process has been monitored globally. This may be of interest not only to researchers involved in the analysis of oxidation mechanisms but also to those in the field of technology and edible oil legislation, and even to those worried about edible oil safety and its effect on nutrition and health. Another important feature of this study, from the practical point of view, is the methodology used because it does not involve the chemical modification of the sample and the same 1H NMR spectrum is able to provide information about all the above-mentioned aspects.
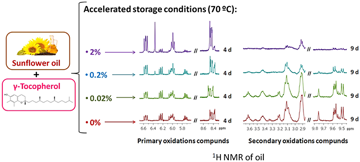
Sunflower oil enriched with different levels of γ-tocopherol. Concentrations of primary and secondary oxidation compounds after 4 and 9 days, respectively, under accelerated storage conditions.
1 Introduction
The enrichment of foods with compounds capable of acting as antioxidants either to extend their shelf life or to incorporate compounds with healthy properties has become common practice in recent years. This is the case of food enrichment with some of the different forms of vitamin E, like γ-tocopherol (γ-T), which is commonly present in vegetable oils. European Legislation allows the enrichment of refined oils (except olive oil) with tocopherols with no maximum limit (principle “quantum satis“).1
However, the effect of the addition of some of these compounds to edible oils is not well understood today because, apparently, controversial results have been reported. Thus, it has been reported that the γ-T addition to linoleic acid in aqueous media at a concentration of 3.8% in weight submitted to room temperature, causes an antioxidant effect. This conclusion was based on the delayed formation and degradation of hydroperoxides (primary oxidation compounds) in relation to the control.2 These compounds were monitored by High Performance Liquid Chromatography (HPLC) after their previous extraction. The effect of γ-T, in concentrations ranging from 0.001 to 0.1% in weight, on methyl linoleate, kept at 40 °C, has also been described as antioxidant. This conclusion was based on either delayed or total inhibition of the hydroperoxides, hydroxides, and ketodienes formation throughout 4 days, monitored as above by HPLC.3
In addition to pure compounds, studies of the effect of γ-T enrichment on the oxidative stability of more complex systems have also been carried out. Thus, the effect of γ-T on purified sunflower triglycerides, enriched with concentrations ranging between 0.0001% and 0.2% in weight, submitted to 55 °C has been also described as antioxidant. This conclusion was based both on the peroxide values reached after 7 days under the above-mentioned conditions compared with those of the control and also on the monitoring of dimers and polymers by High-Performance Size Exclusion Chromatography (HPSEC).4
By contrast with the above-mentioned studies, the effect of γ-T on edible oil triglycerides oxidation has been described as concentration-dependent by other authors. Thus, at concentrations above 0.025% by weight the effect of this compound has been described as prooxidant on soybean oil triglycerides submitted to 55 °C in the dark, and as antioxidant at lower concentrations. These conclusions were drawn from the peroxide value and headspace oxygen consumption monitored for several days under the above-mentioned conditions.5 Likewise, the effect of γ-T, in concentrations ranging from 0.01 to 0.1% by weight, on corn oil triglyceride oxidation caused at 60 °C throughout 7 days under these conditions has been studied. The markers, hydroperoxide and hexanal concentrations were monitored daily from day 0 to day 7. The results of this study indicated that in all concentrations tested γ-T behaves as antioxidant.6
Edible oils are much more complex than triglycerides and they are closer to the industry and consumers. The effect of γ-T on soybean oil, and oil with a significant proportion of linolenic acyl groups, has been already studied by 1H NMR. This study has shown that γ-T concentration has a great influence on this effect.7
It is true to say that oil oxidation process is both very complex and is influenced by its composition in main and minor components and by the conditions to which it is subjected.8 For this reason, its understanding requires as complete as possible a study to establish correct conclusions regarding the effect of lipid enrichment with γ-T. Some of the above mentioned studies provide only a partial view of the process due to the use of a reduced number of oxidation markers monitored either for a fixed or over a more or less reduced period of time under oxidative conditions and always on systems that can be considered models.
In this context the present study faced the topic with a new approach. Firstly, the lipidic system subject of study is not a model system but a real system; it concerns sunflower oil, an oil practically free of linolenic acyl groups, and susceptible to enrichment with γ-T at industrial scale. This oil will be enriched with proportions of γ-T ranging from 0.02 to 2% because there are no limits for this enrichment established in the legislation. These systems will be submitted to accelerated storage conditions and their oxidation process will be monitored from day 0 until the total polymerization of the sample. This monitoring will be carried out by 1H NMR spectroscopy. This technique does not require chemical modification of the sample9, 10 and has rarely been used for this purpose.7, 11 It allows one to estimate the concentration of linoleic acyl groups, hydroperoxides and a great number of secondary oxidation compounds, from the same spectrum. The information obtained will be analyzed throughout the whole oxidation process in both the control sample and the samples enriched with γ-T. This analysis will allow to test the validity of certain parameters to be used as markers of the global effect of different degrees of enrichment with γ-T on the sunflower oil oxidation under the conditions of this study. Particularly the parameters that will be monitored are the evolution of the concentrations of the compounds above mentioned, and the times at which certain important changes in their concentration occur. After this global study the effect of different γ-T enrichment degrees on sunflower oil degradation under the conditions of this study will be established on a solid basis, as well as the ability of this compound to act either as antioxidant or prooxidant on this real system. Furthermore, the consequences, from technological, nutritional and safety points of view, that this enrichment can have after submission of this enriched oil to accelerated storage conditions over a certain period of time can be deduced.
2 Materials and Methods
2.1 Samples
The starting oil was refined sunflower oil purchased from a local supermarket. Its composition in main components expressed as molar percentages of the different types of acyl groups was: linoleic 58.7 ± 0.2%, oleic 30.4 ± 0.2% and saturated groups 11.0 ± 0.2%. These were determined by 1H NMR, as in previous studies.12, 13 The γ-T used (purity ≥90.0%) was kindly provided by Eisai Food & Chemical Co., Ltd. (2-13-10 Nihonbashi, Chuo-ku, Tokyo, 103-0027 Japan). The samples subject of study were: refined sunflower oil (SF) and refined sunflower oil enriched with γ-T in the following percentages in weight: 0.02% (SF0.02), 0.2% (SF0.2), and 2% (SF2).
2.2 Accelerated Storage
For accelerated storage, 10 g portions of each sample were poured into Petri dishes of 80 mm diameter. These were placed in a convection oven and were kept at 70 °C without forced convection, simulating accelerated storage conditions. Aliquots were taken every day for their study by 1H NMR. The evolution of the samples was monitored until their total polymerization. The accelerated storage experiments were carried out in duplicate.
2.3 Monitoring by 1NMR of the Oxidation Process, During Accelerated Storage, of SF and SF Enriched With γ-T
2.3.1 Operating Conditions
The 1H NMR spectra were acquired using a Bruker Avance 400 spectrometer operating at 400 MHz. The weight of each aliquot was approximately 0.16 g. These were mixed in a 5 mm diameter tube with 400 μL of deuterated chloroform that contained 0.2% of non deuterated chloroform and a small amount (0.03%) of tetramethylsilane as internal references. The acquisition parameters used were: spectral width 6410 Hz, relaxation delay 3 s, number of scans 64, acquisition time 4.8190 s, and pulse width 90°, with a total acquisition time of 8 min 38 s, as in previous studies.14 The relaxation delay and acquisition time selected allow the complete relaxation of the protons, the signal areas thus being proportional to the number of protons that generate them, making possible their use for quantitative purposes. Each sample was analyzed in duplicate, in order to obtain a mean value for the concentration of each compound under investigation.
2.3.2 Identification of several compound groups
Figures 1-4A show the 1H NMR spectral region between 0 and 5.5 ppm of SF oil and of SF enriched with different γ-T levels, after submission to accelerated storage conditions, for different periods of time. Signals labeled with A, B, C, D, E, F, G, H, and I, are due to the main sunflower oil components, which is to say to protons of their acyl groups and glycerol backbone. They are well known and their assignments are reported in Table S1, Supporting Information. These spectral regions have been drawn at a fixed value of absolute intensity to be valid for comparative purposes. The same figures also show, conveniently enlarged, some 1H NMR spectral regions in which important signals due to protons of compounds formed during the oxidation process appear. These regions belong to the same spectra above mentioned and they have also been drawn at a fixed value of absolute intensity to be valid for comparison between them. Most of the assignments of these signals are also well known and are indicated in Table S1, Supporting Information. In addition, the signal of the only aromatic proton of γ-T (at 6.371 ppm)15 can be observed in Figures 3A and 4A, indicated by an asterisk. This signal, due to one proton, is only visible at γ-T concentrations of 0.2 and 2%.


The identification of the several compounds present in the samples was achieved by literature data and by considering standard compounds such as: (E)-2-hexenal, (E)-2-heptenal, (E)-2-decenal, (E,E)-2,4-hexadienal, (E,E)-2,4-heptadienal, (E,E)-2,4-decadienal, 4,5-epoxy-(E)-2-decenal and 12,13-epoxy-9(Z)-octadecenoic acid methyl ester (isoleukotoxin methyl ester), acquired from Sigma–Aldrich (St. Louis, MO, USA), and 4-hydroxy-(E)-2-nonenal, 4-hydroperoxy-(E)-2-nonenal, 9,10-dihydroxy-12(Z)-octadecenoic acid (leukotoxin diol), 12,13-dihydroxy-9(Z)-octadecenoic acid (isoleukotoxin diol), trans-12,13-epoxy-9-keto-10(E)-octadecenoic acid, 9-keto-10(E),12(E)-octadecadienoic acid and 12R-hydroxy-9(Z)-octadecenoic acid methyl ester (ricinoleic acid methyl ester), purchased from Cayman Chemical (Ann Arbor, MI, USA) (Table S1, Supporting Information).
2.3.3 Estimation of the Concentration of the Several Compound Groups From 1NMR Spectra
The concentration of the linoleic acyl group (%L), expressed as molar percentage, was estimated by means of the equation%L = 100 (2AF/3AG).16 In this equation, AF is the area of the signal (F) of bis-allylic protons of linoleic acyl group and AG is the area of the signals (G) due to the glycerol protons at the sn-1 and sn-3 positions of TG (see Figures 1-4A and Table S1, Supporting Information).
The concentrations of the different kinds of oxidation compounds, throughout the storage, were determined by means of the equation [OC] = [(AOC/n)/(AG/4)]*1000. In this equation AOC is the area of the signal selected for the quantification of each oxidation compound (OC), n the number of protons that generate the signal, and AG the area of the protons at sn-1 and sn-3 positions in the glycerol backbone of TG (signal G in Table S1, Supporting Information). The concentrations thus determined are given in millimol per mol of triglyceride (mmol mol−1 TG).
2.4 Statistic and Kinetic Studies
All the equations and fitting procedures were performed by using Microsoft Office Excel 2007 software. This software works automatically and only requires the introduction of the data of the corresponding variables and the selection of the type of equations to be tested. Thus equations that relate the variables involved are obtained in a very simple way, and also their correlation coefficients.
3 Results and Discussion
A great deal of information was obtained from the analysis of the 1H NMR spectra of the several samples at different storage times. Sunflower oil degradation begins with the degradation of its main unsaturated acyl group, the linoleic group. For this reason, if oxidation takes place, the concentration of this group will diminish. As a result, the linoleic group molar percentage evolution throughout storage time could be a potential marker for evaluating the effect of the enrichment with γ-T on the degradation of sunflower oil. It should be added that in none of the previously cited studies about this issue the evolution of either this parameter or of another equivalent was used to this aim. The degradation of linoleic acyl groups gives rise to the formation of primary oxidation compounds or hydroperoxides, which in turn degrade to give secondary oxidation compounds. The potential of the evolution of the hydroperoxides concentration of as marker of the enrichment with γ-T effect will be also analyzed. To this aim two variables will be considered, namely, concentrations and times at which main changes in the concentrations occur. It must be remembered that in all studies previously cited about this subject, either hydroperoxide concentration or peroxide values were used to elucidate the effect of the enrichment with γ-T on lipids.2-6 Finally, the evolution of the concentration of a great number of secondary oxidation compounds will also be analyzed along the storage time. These latter compounds have only been scarcely considered as markers in previous studies.3, 6 However, it should not be forgotten that more and more emphasis is being placed on the need to use as many markers as possible in the oxidation processes in order to be able to draw solid conclusions.
3.1 Evolution of Linoleic Acyl Group Concentration Throughout the Storage Time as Marker
The 1H NMR spectra (between 0 and 5.5 ppm) of the SF oil and the three enriched samples after submission to accelerated storage conditions for different periods of time are shown in Figures 1-4A. In these spectra, the signal of the bis-allylic protons of the linoleic group is clearly visible (signal F; Table S1, Supporting Information), as well as the diminution of its intensity during storage. The concentration of this acyl group, expressed as molar percentage, can be determined from the area of this signal and that of the protons at sn-1 and sn-3 positions in the glycerol backbone in each spectrum of all samples at any time under storage conditions, as indicated in the experimental section. The evolution of the molar percentage of the linoleic acyl group in each sample is represented versus storage time expressed in days in Figures 1-4B.
It can be observed in these figures that the evolution of the molar percentage of linoleic acyl group versus time in all samples follows a pattern that could be considered as being made up of three linear stages. As Figures 1-4B show, these stages have different durations (Dd) in each sample (see Table 1). In each stage, molar percentage of linoleic acyl group (%L) and storage time (t, given in days) fit, with high correlation coefficients (R), to linear equations%L = m*t + b. In this equation b and m are characteristics of each stage and sample, m being the slope of the line, that is to say the rate of decrease of the molar percentage of linoleic acyl group (m = RL) in the corresponding stage and sample. Table 1 shows the rates of degradation of linoleic acyl group RL (given in % L day−1) in all stages and samples and the correlation coefficients R of the different equations. Table S2, Supporting Information gives the molar percentages of linoleic group at different storage times from which RL values were obtained.
| First Stage | Second Stage | Third Stage | |||||||
|---|---|---|---|---|---|---|---|---|---|
| Sample | Dd | RL | R | Dd | RL | R | Dd | RL | R |
| SF | 0-4 | −0.67 | 0.9844 | 5-8 | −12.03 | 0.9852 | 9-12 | −2.05 | 0.9446 |
| SF0.02 | 0-4 | −0.70 | 0.9810 | 5-8 | −11.91 | 0.9944 | 9-14 | −2.14 | 0.9675 |
| SF0.2 | 0-8 | −0.85 | 0.9882 | 8-11 | −10.75 | 0.9676 | 12-14 | −3.30 | 1.0000 |
| SF2 | 0-12 | −1.61 | 0.9831 | 14-18 | −5.53 | 0.9841 | 18-22 | −1.55 | 0.9972 |
- The rate of linoleic group decrease RL is the slope of these equations.
The comparison of RL values during the four first days evidences that in this first period, the higher the enrichment level, the higher the degradation rate of linoleic acyl group RL. In this regard, it could be said that the sunflower oil oxidative stability decrease as the concentration of γ-T in the oil increases, suggesting a prooxidant effect of this compound in this short period. This is a very partial view of the process because from day 4 onwards the opposite is true as RL values indicate. From this day onwards the highest linoleic group degradation rate RL occurs in the control sample (SF) and this slow down as the enrichment with γ-T increases. This is evidenced by the values of RL given in Table 1 and can also be observed in Figures 1–4B. This fact proves that from day 4 onwards, γ-T causes an antioxidant effect, which is higher the higher its concentration is. Globally, it may be said that the enrichment with γ-T causes an antioxidant effect on sunflower oil in line with its enrichment level, in the conditions tested here, except in a short first period.
These results explain why the oil which is richest in γ-T is the one that takes more time to reach total polymerization (12 days SF versus 22 days SF2).
The evolution of the concentration of linoleic group can be considered a very good marker to evaluate the effect of the γ-T enrichment on sunflower oil under these storage conditions because it gives direct information about the rate of degradation of the oil.
3.2 Evolution Throughout Storage of the Concentration of Hydroperoxides as Potential Marker
The concentration of hydroperoxides can be estimated in two different ways, either by determination of the concentration of the total hydroperoxides or by determination separately of (Z,E)- and of (E,E)-hydroperoxy-dienes.
3.2.1 Evolution of Total Hydroperoxide Concentration
In the 1H NMR spectra of the samples subject of study the proton of the hydroperoxide groups gives the spectral signal c between 8.3 and 8.9 ppm (see the enlarged spectral region in Figures 1-4A and Table S1, Supporting Information). The intensity of these signals increases with time under storage conditions, and after reaching a maximum this decreases until its almost total disappearance. From the area of these signals the concentration of total hydroperoxides can be determined. The values obtained are represented versus time in Figures 1-4C.
The concentration of hydroperoxides increases to a maximum concentration indicating than in the first period the rate of their formation is much higher than the rate of their degradation. The growth pattern of the hydroperoxide concentration could be considered as constituted by two linear stages. As Figures 1-4C show these two stages have different duration (Dd) in each sample (see Table 2). Within each stage, concentrations of hydroperoxide group [H], given in mmol/mol TG, and storage time (t), given in days, fit, with high correlation coefficients (R), to the linear equations [H] = m*t + b. In this equation b and m are characteristics of each stage and sample, m being the slope of the line, that is to say, the rate of growth of hydroperoxide group concentration (m = RH) in the corresponding stage and sample. Table 2 gives the rates of the hydroperoxide group concentration growth, RH, given in mmol/mol TG*day, in both stages in all samples, the correlation coefficients R of the different equations, together with the maximum concentration reached [Hm] and the time tmH at which this is reached. Table S3, Supporting Information, gives the hydroperoxide group concentrations at different storage times from which the above mentioned data were obtained.
| First Stage | Second Stage | |||||||
|---|---|---|---|---|---|---|---|---|
| Sample | Dd | RH | R | Dd | RH | R | [Hm] | tmH |
| SF | 1-4 | 14.62 | 0.9972 | 4-6 | 99.80 | 0.9835 | 246.60 | 6 |
| SF0.02 | 1-5 | 16.28 | 0.9958 | 5-7 | 91.80 | 0.9766 | 252.80 | 7 |
| SF0.2 | 1-7 | 21.30 | 0.9980 | 7-9 | 52.90 | 0.9944 | 237.20 | 9 |
| SF2 | 1-7 | 33.56 | 0.9981 | 7-10 | 11.24 | 0.9912 | 249.60 | 10 |
- The rate of hydroperoxide concentration increase RH is the slope of these equations. Furthermore, the hydroperoxide maximum concentration reached [Hm] throughout storage time is also given together with the time (in days) at which this is reached (tmH).
The comparison of RH values during the four first days evidences that in this first period of increasing concentration, the higher the enrichment level, the higher the rate of hydroperoxide concentration increase. This is in agreement with the observed in the evolution of the linoleic acyl group, and matches with the results provide by the first marker cited in this study. Actually, in this first period γ-T acts as prooxidant because the higher its concentration the higher the concentration of hydroperoxides. However, as it has above stated, this is only a partial view.
From day 4 onwards there is no simple relationship between enrichment degree and rate of hydroperoxide concentration increase or between enrichment degree and hydroperoxide concentration. Thus after five 5 days under storage conditions SF2 still has the highest concentration of hydroperoxides of all samples (137.2 mmol mol−1 TG), followed closely by SF sample (115.0 mmol mol−1 TG), and at a greater distance by SF0.2 (86.8 mmol mol−1TG), the smallest concentration being that of SF0.02 sample (69.2 mmol mol−1 TG). However, on day 6, SF reaches its maximum hydroperoxide concentration under storage conditions (246.6 mmol mol−1 TG), SF2 having a hydroperoxide concentration very close to that of SF0.02 and higher than that of SF0.2. On day 7, SF0.02 reaches its maximum hydroperoxide concentration (252.8 mmol mol−1 TG), followed by SF2. This latter sample, on day 7 shows higher hydroperoxide concentration than SF0.2. This latter sample reaches its maximum hydroperoxide concentration on day 9 (237.2 mmol mol−1 TG) and SF2 on day 10 (249.6 mmol mol−1 TG). It is noteworthy that the concentration of hydroperoxides in SF2, is always either the highest or the next to highest found among the other samples at each time. This can be observed in detail in Table S3, Supporting Information in which the concentration of hydroperoxides at each storage time is given for the different samples. These results show that except in the initial short period of time in which a direct relationship between enrichment level and hydroperoxide concentration exist, over the rest of this period of growing hydroperoxide concentration, this relation is complex.
These results evidence the difficulty for describing the behavior of γ-T as either antioxidant or prooxidant based exclusively on hydroperoxide concentration determined over a certain period of time. From these results it is evident that hydroperoxide concentrations, and by extension peroxide values, are not valid markers of the global effect of different enrichment degrees on the sunflower oil oxidation, except in the first period under accelerated storage conditions. To the best of our knowledge, this is the first time that this fact has been highlighted. This fact could also explain some of the discrepancies found in some studies previously published about the attribution either antioxidant or prooxidant ability to γ-T.
In spite of all the above mentioned, it can be observed in Figures 1-4C and Table 2 that the maximum concentration reached by hydroperoxides is of a similar order in all samples regardless of γ-T enrichment degree. Nevertheless, the higher the enrichment level the longer the time at which the maximum concentration of hydroperoxides tmH is reached. The relation between these two parameters, tmH, given in days, and enrichment level, [γ-T], given in percentage in weight, fits with a high correlation coefficient to the linear equation tmH = 0.651 Ln [γ-T] + 9.715, R = 0.9820, n = 3 (in this equation SF was excluded because its [γ-T] is null). To the best of our knowledge, this is the first time that an equation that relates these two parameters has been described. Taking into account all above mentioned, tmH, could be considered a suitable marker of the global effect of the enrichment with γ-T because it is associated with the rate of degradation of linoleic groups and of sunflower oil.
3.2.2 Evolution of the Concentration of (E,E)- and (Z,E)-Hydroperoxydienes
In the 1H NMR spectra of the samples subject of study, in addition to the signals of protons of the hydroperoxide groups before mentioned, signals of conjugated dienic protons of (Z,E)- and of (E,E)-hydroperoxydienes also appear. These are the multiplet signals a1 (and a2, among others) and b1 (and b2, among others) respectively, that are visible in the enlarged regions of the 1H NMR spectra shown in Figures 1-4A. Their assignments are indicated in Table S1, Supporting Information.
The intensity of these signals increases with storage time to reach a maximum, after which it decreases, as may be expected. The concentration of both kinds of hydroperoxides can be estimated, in all samples, throughout storage, from the area of signals a1 and b1, as before mentioned, and their values are represented versus time in Figures 1-4C.
The concentration of (Z,E)-hydroperoxydienes in the SF sample is, throughout storage, smaller than that of (E,E)-hydroperoxydienes, both kinds of compounds reaching their maximum concentration at the same time. However, as the enrichment grows, the formation of (Z,E)-hydroperoxydienes increases, whereas that of (E,E)-hydroperoxydienes is delayed and reduced, in such a way that in the SF2 sample the maximum concentration of the former is reached near day 8 whereas that of the latter is around day 14 under these storage conditions. These results show that the level of enrichment with γ-T decisively influences, not only either the acceleration or the slowdown of the oxidation of this oil, but also the mechanisms involved in the process, evidencing the complexity of its role. Furthermore, these results also suggest that the direct relationship found during the four first days between concentration in total hydroperoxides and enrichment degree could be mainly due to the preferential formation of (Z,E)-hydroperoxydienes in this period. The increase of the hydroperoxydienes (Z,E)/(E,E) ratio with the increase in the enrichment level has been explained by the inhibition of the isomerization of (Z,E)- to (E,E)-. This inhibition has been attributed to the ability of γ-T to donate a hydrogen atom to (Z,E)-peroxyl radicals before they have time to rearrange to the more thermodynamically stable (E,E)-hydroperoxydienes.3, 17 This fact has also been observed in soybean oil.7
3.3 Evolution of the Concentration of Secondary, or Further, Oxidation Compounds Such as Ketodienes, Aldehydes, Epoxides, and Hydroxyderivatives as Potential Markers
As is well known, hydroperoxides are intermediate compounds whose degradation generates a great number of secondary oxidation compounds. Although scarce, some studies have used the concentration of some secondary oxidation compounds such as either total hydroxides, and total ketodienes or hexanal as markers of the effect that the enrichment with γ-T produces on lipids oxidation.3, 6
3.3.1 Markers Associated With the Evolution of Ketodiene Concentration
These compounds are, as mentioned, secondary oxidation compounds directly derived from hydroperoxides. Both (E,E)- and (Z,E)-ketodienes are detected in the samples subject of study after certain periods of time under storage conditions. Their conjugated dienic protons give the signals j and k shown in Figures 1-4A.11, 18 Their concentrations, determined from the area of these signals, are represented versus time in Figures 1-4D. It can be observed that their formation, as expected, occurs after that of both kinds of hydroperoxides and follows a similar trend to theirs. The time at which the maximum concentration of total ketodienes is reached (tmK) is also related to the enrichment level, similarly to hydroperoxides, the equation in this case being tmK = 1.086 Ln [γ-T] + 13.081, R = 0.9934, n = 3 (in this equation SF was also excluded because its [γ-T] is null). This time tmK could also be considered a marker of the global effect of the enrichment with γ-T. The higher tmK value the slower the degradation of the oil. Similarly to hydroperoxides, in general, it could be said that the formation of (E,E)-ketodienes is delayed in relation to that of (Z,E)-ketodienes and decreases its maximum concentration as the enrichment with γ-T increases, this being very noticeable in SF2 (see Figures 4C and D). The fact that the concentration of both kinds of ketodienes reaches a maximum after which a decreasing concentration occurs until total disappearance suggest that these compounds are intermediate secondary oxidation compounds.
3.3.2 Markers Associated With the Evolution of Aldehydes Concentration
These secondary oxidation compounds and the assignment of their 1H NMR signals showed in Figures 1-4A (signals l, m, n, o, p, q) are well known.10, 19 The evolution of their concentrations is represented in Figures 1-4E and 1–4F. Among the aldehydes found, in addition to the well known n-alkanals, (E)-2-alkenals, and (E,E)-2,4-alkadienals, there are also oxygenated alpha,beta-unsaturated aldehydes which have been attributed toxic properties.20, 21 This latter group includes 4,5-epoxy-2-akenals, 4-hydroxy-(E)-2-alkenals and 4-hydroperoxy-(E)-2-alkenals.
However, with regard to the time at which they are detected for the first time two groups can be distinguished. The first group is constituted by 4-hydroperoxy-(E)-2-alkenals, (E)-2-alkenals and 4-hydroxy-(E)-2-alkenals. The evolution of their concentrations follows a very similar pattern. This pattern is delayed in time the greater the enrichment degree (see Figures 1-4E). These aldehydes are detected in all samples after 5 days under storage conditions and they remain in the sample up to total polymerization, which takes place later the higher the enrichment level is. The concentration of these three kinds of aldehydes reaches the maximum value at a similar time in SF and SF0.02 samples (4-hydroperoxy-(E)-2-alkenals at day 8, (E)-2-alkenals at days 9 and 10, respectively, and 4-hydroxy-(E)-2-alkenals at day 11), whereas in SF0.2 this occurs later (4-hydroperoxy-(E)-2-alkenals at day 11 and both (E)-2-alkenals and 4-hydroxy-(E)-2-alkenals at day 12) and much later in SF2 (4-hydroperoxy-(E)-2-alkenals at day 16, (E)-2-alkenals at day 18 and 4-hydroxy-(E)-2-alkenals at day 20) (see Table S4, Supporting Information). It is noteworthy that the concentration of these aldehydes in these two latter samples remains very low for a prolonged period of time, after their detection for the first time on day 5. This could suggest that these aldehydes are formed in the degradation of (E,E)-hydroperoxydienes and this could explain the delay in their formation, which is higher the higher the enrichment level.
From data represented in Figures 1-4E it is evident that the concentrations of these three kinds of aldehydes, are only valid markers of the global effect of the enrichment with γ-T on sunflower oil for certain periods of time. Thus, it could be said that the concentration of 4-hydroperoxy-(E)-2-alkenals is only a valid marker from day 5 to day 7, that of (E)-2-alkenals, from day 5 to day 10, and that of 4-hydroxy-(E)-2-alkenals, from day 5 to day 11, under storage conditions. Before and after these periods the use of the concentrations of these aldehydes in the different samples to compare the global effect of the enrichment level on sunflower oil can lead to erroneous conclusions. However, the time at which each one of these kinds of aldehydes reaches its maximum concentration (tmA) in each sample could be considered a valid marker of the global effect on sunflower oil. Very close linear relationships have also been found, for the three enriched samples, between tmA for each one of these kinds of aldehydes and either Ln [γ-T] in the case of 4-hydroperoxy-(E)-2-alkenals or [γ-T] in the case of (E)-2-alkenals and 4-hydroxy-(E)-2-alkenals.
The second group of aldehydes is also made up of by three kinds, namely, (E,E)-2,4-alkadienals, 4,5-epoxy-2-alkenals, and n-alkanals. These are found in smaller concentrations than those of the first group and perhaps for this reason they are detected later. The time at which they are detected for the first time (tdA) in each sample is closely related to the enrichment degree. Thus, in SF and SF0.02, they are detected from day 6 onwards, and in samples SF0.2 and SF2 from days 8, 9–10 onwards, respectively (see Table S5, Supporting Information). This fact also suggests that the formation of these aldehydes is even more closely dependent on the (E,E)-hydroperoxydiene concentration than those of the first mentioned group, because they are only formed when (E,E)-hydroperoxydiene concentration is over a certain value.
From data represented in Figures 1-4F, it is evident that the concentration of (E,E)-2,4-alkadienals is only a valid marker of the global effect on sunflower oil from day 6 to 8, the concentration of 4,5-epoxy-2-alkenals from day 6 to 9, and that of alkanals from day 6 to 11, under storage conditions. However, a valid maker is the time from which they are detected tdA. This is closely related to the enrichment level, as indicated by the equation tdA = 0.651 Ln [γ-T] + 8.715, R = 0.9820, n = 3).
If the analysis is made considering the sum of all aldehydes, the period of time in which the total concentration of aldehydes can be used correctly as a marker, is between days 6 and 8 under storage conditions.
One important consequence of the effect of the enrichment with γ-T is the slowdown in the formation of the toxic oxygenated alpha,beta-unsaturated aldehydes. This slowdown is greater as greater the enrichment level is.
3.3.3 Markers Associated With the Evolution of Epoxide Concentration
These are secondary, or further, oxidation compounds that are also found in the systems here studied. Figures 1-4A show some of the spectral regions, conveniently enlarged, in which signals of protons assignable to epoxides appear. Those considered here are signals d (d1,d2, and d3) e, f, and g (g1 and g2).
There are different kinds of epoxides whose protons give signals d1,d2 and d3 and e as Table S1, Supporting Information, shows. The evolution of their total concentration versus time is represented in Figures 1-4G. The concentration of these compounds, like that of others mentioned before, reaches a maximum value after which it diminishes. The maximum concentrations reached in the several samples are fairly similar, perhaps somewhat lower in those with more enriched with γ-T (from 170 to 160 mmol mol−1 TG). Both, the time at which they are detected for the first time (tdE), and the time at which each sample reaches the maximum concentration (tmE), increase with the enrichment level. As consequence, and similarly to that which occurred in the other secondary oxidation compounds, the concentration of these epoxides is only a valid marker of the global effect for a short period. In this case, this period goes from day 6 to 8. However, tmE is a valid marker because the higher the enrichment level, the higher tmE, and the slower the degradation of this oil.
Signal f in Figures 1-4A has been attributed to protons of epoxy groups of (E)- and (Z)-epoxyketoenes and signals g1 and g2 to protons of epoxy groups of (Z)-epoxyketoenes, which are able to be formed in sunflower oil degradation. The estimation of the concentrations of these epoxyketoenes throughout the storage time was made from the area of these signals and their values are represented in Figures 1-4H. It can be observed that in all samples, regardless of enrichment degree, the maximum concentration reached is of a similar order for both kinds of epoxyketoenes. The great difference between samples lies in the time at which these compounds are detected for the first time (tdEk) (from day 7 onwards in SF and SF0.02, from day 10 onwards in SF0.2 and from day 14 onwards in SF2). Again, tdEk can be considered as a valid marker. The greater the enrichment with γ-T, the higher the tdEk value, the later the formation of epoxyketoenes and the slower the degradation process, in agreement with the other markers before mentioned. In addition, the concentration of these compounds, from days 7 to 9, can also be used as marker of the global effect of the enrichment.
From the safety point of view, as above mentioned, one important consequence of the effect of the enrichment is the slowdown in the epoxide formation. This slowdown is greater the greater the enrichment level.
3.3.4 Markers Associated With the Evolution of the Concentration of Compounds Tentatively Considered Hydroxy-Derivatives
In the 1H NMR spectra of the samples subject of study (see Figures 1-4A), signals h (h1 and h2) and i appear that can be attributed to protons supported on carbon atoms bonded to hydroxy groups of dihydroxy- and hydroxy-octadecenoate derivatives, respectively. The evolution of the concentration of these tentative compounds throughout storage time in the different samples is represented versus time in Figures 1–4I. As in some of the previously mentioned secondary oxidation compounds the time at which their maximum concentrations is reached (tmT) and the time at which these compounds are detected for the first time (tdT) are valid markers. The greater the enrichment, the higher tmT and tdT, the slower the rate of these secondary oxidation compounds formation, and the slower the oil degradation. Furthermore, the concentration of these compounds, over a reduced range of time, can also be used as a marker of the effect of the enrichment with γ-T on the sunflower oil degradation in the conditions here used.
4 Conclusions
The enrichment of sunflower oil with γ-T neither avoids its degradation nor delays its beginning under accelerated storage conditions. In fact, in the first period of time under these conditions both the degradation of linoleic acyl groups and also the formation of hydroperoxides, mainly of (Z,E)-hydroperoxydienes are favored by the enrichment. For these reasons, the study of only this short period of time can lead to the conclusion that this enrichment causes a prooxidant effect. However, the effect of this enrichment is very complex. In the following period, the enrichment with γ-T causes a clear slowdown of the degradation of linoleic acyl groups and in turn of the sunflower oil degradation. Taking into account that this second period is larger and much more important than the first, the global effect could be described as antioxidant under the conditions of this study. Furthermore, and very importantly, this is the first time that it has been proved that hydroperoxide concentration and, by extension, peroxide value are not valid markers of the global effect of the enrichment with γ-T on sunflower oil, except in the short initial period before cited. The use of these parameters outside this short period of time can lead to erroneous conclusions. Likewise, it has also been proved, for the first time, that the concentrations of any of the secondary oxidation compounds are only valid markers, of the global effect that the enrichment with γ-T causes on sunflower, within certain very specifically established periods of time. Outside these periods, their use can also lead to erroneous conclusions. These facts could explain some of the discrepancies found in previous studies on the antioxidant or prooxidant effect caused by the enrichment with γ-T. In addition, it has also been proved for the first time, that the time at which the concentration of primary and of secondary oxidation compounds reaches is maximum value is a valid marker to elucidate the global effect that on sunflower oil causes the enrichment with γ-T. Furthermore, in some cases, the time at which some of the secondary oxidation compounds are detected for the first time is also a valid marker.
Abbreviations
1H NMR, proton nuclear magnetic resonance; A, area; HPLC, high performance liquid chromatography; HPSEC, high-performance size exclusion chromatography; OP, oxidation product; SF, sunflower oil; SF0.02, sunflower oil enriched with γ-T at a concentration of 0.02% by weight; SF0.2, sunflower oil enriched with γ-T at a concentration of 0.2% by weight; SF2, sunflower oil enriched with γ-T at a concentration of 2% by weight; TG, triglyceride.
Acknowledgements
This work has been supported by the Spanish Ministry of Economy and Competitiveness (MINECO AGL 2015-65450-R), the Basque Government (EJ-GV, IT-916-16), and the Agriculture Department of the Basque Government (PA19/02).
Conflict of Interest
The authors declare no conflict of interest.