Compositional Changes Among Triglycerides and Phospholipids During FATP4 Sensitization with Palmitate Lead to ER Stress in Cultured Cells
Abstract
FATP4 expression is upregulated in acquired obesity and polymorphisms in the FATP4 gene are associated with increased blood triglycerides (TG). Since non-alcoholic fatty liver disease (NAFLD) is a manifestation of obesity, it is of interest to understand how FATP4 upon fat overload mediates alterations of lipids that lead to pathogenesis of fatty liver. A model system with FATP4-overexpressed (FATP4) and control Huh-7 cell lines is used to determine FATP4 response to palmitate (Pal). By lipidomics methods, cellular phospholipids (PL), neutral lipids TG, free cholesterol (FC), and cholesterol esters (CE) as well as lipoprotein secretion are determined. Without Pal, FATP4 cells show a significant increase of TG, phosphatidylcholine (PC), and the release of TG-rich and cholesterol-rich low density lipoproteins. Pal-treated FATP4 cells show an increase of all PL subclasses except for phosphatidylserine (PS), TG, FC, and CE. By analyses of ratios among PL subclasses and between PL and neutral lipids, it is determined that FATP4 in response to Pal causes sequentially fatty-acid channeling with a shift from PC and phosphatidylinositol (PI) to neutral lipids and from neutral lipids to PS and phosphatidylethanolamine (PE). This response is concomitant with an activation of CAAT/enhancer binding homologous protein and MAP Kinase JNK. Thus, FATP4 overexpression in response to Pal leads to enhancement of neutral lipids which play a central role in fatty-acid distribution from PC and PI to PE and PS that led to an alteration of ER and mitochondrial membranes and subsequent stress signalling.
Practical Applications: Activation of fatty acids by fatty acid transport proteins (FATP) plays an important role in development of obesity and NAFLD. This work highlights functional role of FATP4 on fatty-acid distribution among neutral lipids and phospholipids upon fat overload. These changes may contribute to stress signalling in the pathogenesis of NAFLD.
Compositional shift among total PL subclasses and neutral lipids.
1 Introduction
Non-alcoholic fatty liver disease (NAFLD) and steatohepatitis and its frequent manifestations of metabolic syndrome including obesity, insulin resistance, and hypertriglyceridemia, is a rising concern in Western countries.1, 2 Triglycerides (TG) consisting of a glycerol backbone and three fatty acids (FA) are major storage molecules of metabolic energy in most living organisms. TG synthesis utilizes fatty acyl-CoA via glycerol phosphate3 and monoacylglycerol4 pathways in liver and intestine, respectively. Members of acyl-CoA synthetases (ACSL) and fatty acid transport proteins (FATP) mediate FA activation to form complex lipids including TG and phospholipids (PL).5 While PL are trafficked into membranes of cellular organelles, TGs are channelled into cytosolic lipid droplets or secreted as lipoproteins.6 FATP4 is one of the six FATP members which differ in their substrate specificity and tissue expression. FATP4 is widely expressed in a variety of tissues including adipose tissue, brain, skeletal muscle, intestine, and liver.7 FATP4 is not localized on plasma membrane8 but localized in multiple organelles including endoplasmic reticulum (ER),8, 9 peroxisomes,9, 10 and mitochondria.10, 11 As the ER12 and mitochondria13 are sites for lipid synthesis, FATP4 conceivably may activate FA into specific complex lipids in these organelles thus creating an FA gradient and allowing FA uptake.8, 14 Emerging evidence has indicated the role of FATP4 in TG processing such as TG lipolysis15 and TG accumulation in tissues of FATP4-deficient mice fed with high-fat-diet.16, 17 However, TG processing mediated by FATP4 has not been demonstrated regarding FA distribution among neutral lipid TG and polar PL.
The role of FATP4 in metabolic syndrome is based on epidemiological data showing FATP4 correlation with obesity, blood lipids, and insulin resistance.18-20 This is due to ACSL activities of FATP4 in key metabolic tissues such as adipose tissues and liver. FATP4 has a substrate specificity for very long-chain FA21 and long-chain FA, such as palmitate (Pal)11 which induces lipoapoptosis.11, 22 By using stably FATP4 overexpressing Huh-7 cell line, we have previously shown that FATP4 sensitizes Pal activation for increased generation of all lipid classes associated with increased apoptosis JNK activation.11 Because TG5, 6 and phosphatidylcholine (PC)23 are used for synthesis of lipoproteins and alterations among PL is associated with ER stress,24 we here provide a new evidence for the role of FATP4 on lipoprotein secretion and its response to Pal on ER stress. This FATP4 response to Pal was associated with compositional alterations among PL subclasses and among PL relative to TG. Our results using FATP4 overexpression system are in line with the reported FATP4 correlation with blood TG, hyperlipidemia, and obesity in humans.18-20
2 Experimental Section
2.1 Materials and Antibodies
Palmitate and BSA were obtained from Sigma (Taufkirchen, Germany). Primary antibodies against GAPDH (14C10) (cat.# 2118), phospho-GSK-3β (Ser9) (5B3) (cat.# 9323), phospho-MKK7 (cat.# 4171), phospho-SAPK/JNK (Thr183/Tyr185) (81E11) (cat.# 4668) were obtained from Cell Signaling (Frankfurt, Germany). Rabbit and mouse secondary HRP-coupled antibody were, respectively, obtained from Epitomics (Hamburg, Germany), and Santa Cruz (Heidelberg, Germany).
2.2 FATP4 Overexpressed Huh-7 Cell Line
Stable transfection of Huh-7 cells with GFP and FATP4 plasmids was performed as previously described whereby GFP as control and FATP4-overexpressed (FATP4) cells were generated.11
2.3 Palmitate Treatment
For apoptosis studies, GFP and FATP4 cells were cultured in DMEM with GlutaMAX™ (Life technologies, Darmstadt, Germany) containing high glucose, 10% FCS, penicillin, and streptomycin. Palmitate dissolved in ethanol was added to PBS containing 27% BSA and pH was adjusted to 7.4. For apoptosis induction, Pal in BSA solution was added to serum-free DMEM to obtain a final concentration of 300 µM Pal which was used to treat cells. Preparations containing BSA and ethanol were used to cells as without Pal controls.
2.4 Immunoblotting
After treatment, treated cells were lysed and centrifuged at 13,000g, 4 °C for 15 min. Proteins were separated by gel electrophoresis and transferred onto a PDVF membrane. Blots were probed with a primary antibody followed by a secondary antibody. Proteins were visualized using Luminata Forte ECL reagent (Millipore, Darmstadt, Germany), and quantification was performed by using Image J.
2.5 Gene Expression by Real-Time RT-PCR
Total RNA was isolated using RNA isolation kit from Fermentas, St. Leon Rot, Germany. cDNA synthesis from 1.5 µg RNA was performed using Fermentas Maxima First Strand cDNA synthesis kit. mRNA expression was analysed in quadruplets by real-time PCR using TaqMan® Universal PCR Master Mix and assay-on-Demand TaqMan® primers. PCR reactions were run on an applied Biosystems 7500 Fast real-time PCR machine. The expression level of targets was calculated using Δ-Ct transformation method, and determined as a ratio of target GAPDH. Following TaqMan® primers were used: CHOP (Hs01090850), FATP4 (Hs00192700), MLK3 (Hs00176759), and GAPDH (Hs02758991).
2.6 Transfection with siRNAs
Cells seeded at 8 × 10⁵ per well in a 12-well plate were transfected with small interfering RNA (siRNA) against FATP4 or with scrambled control siRNA (sicon) using ICAFectin™ 442 (Eurogentec, Seraing, Belgium) in serum-free DMEM for 15–16 h. Medium was replaced with DMEM containing 10% FCS, and cells were further cultured for 48 h. The FATP4 specific siRNA (siFATP4) (s21655) and siMLK3 (s8815 and s8814s) were obtained from Silencer Select validated siRNA from Ambion (Darmstadt, Germany).
2.7 Lipid Analyses
GFP and FATP4 cells with and without Pal treatment were lysed by freeze–thaw. Protein contents of cell lysates were determined. Cells were subjected to lipid extraction. TG contents in lipid extracts were determined using the LabASSY Triglyceride kit (Wako Chemicals GmbH, Neuss, Germany).
For PL profiling, lipid extracts were subjected to a direct flow injection of electrospray ionization tandem mass spectrometry (ESI-MS/MS) in positive ion mode by using a HTS PAL autosampler (Zwingen, Switzerland) and an Agilent 1100 binary pump (Waldbronn, Germany) with a solvent mixture containing 10 mM ammonium acetate in methanol/chloroform = 3:1 (v/v). A flow gradient was performed starting with a flow of 55 µl min−1 for 0.1 min followed by 30 µl min−1 for 1.0 min and an increase to 250 µl min−1 for 0.2 min. The triple quadrupole mass spectrometer (Quattro Ultima, Micromass, Manchester, UK) was equipped with a electrospray ion source operated in positive ion mode using the following settings: Capillary voltage 3.5 kV, cone voltage 110 V, collision energy 30 V with a collision gas pressure of 0.13 Pa argon. A precursor ion of m/z 184 was used for PC, sphingomyelin (SM),25 and LPC.26 Neutral loss fragments were used for the following lipid classes: 141 for phosphatidylethanolamine (PE) and lysoPE (LPE), 185 for phosphatidylserine (PS), and 277 for phosphatidylinositol (PI).26, 27 Sphingosine-based ceramides (Cer), hexosylceramide (HexCer) and sphingomyelin (SM) were analysed using a fragment ion of m/z 26428. Cholesteryl esters (CE) were quantified using a fragment ion of m/z 369 after selective derivatization of free cholesterol (FC).29 For each lipid class, two non-naturally occurring internal standards were added, and quantification was achieved via calibration lines that were generated by the addition of naturally occurring lipid species in samples. The following internal standards were used: PC 14:0/14:0, PC 22:0/22:0, PE 14:0/14:0, PE 20:0/20:0 (di-phytanoyl), PI 17:0/17:0, LPC 13:0, LPC 19:0, Cer d18:1/14:0, and Cer d18:1/17:0. Calibration lines were generated for the following naturally occurring species: PC 34:1, 36:2, 38:4, 40:0 and PC O-16:0/20:4; SM d18:1/16:0, d18:1/18:1, and d18:1/18:0; LPC 16:0, 18:1, and 18:0; PE 34:1, 36:2, 38:4, 40:6, and PE P-16:0/20:4; PI 36:2; and Cer d18:1/16:0, d18:1/18:0, d18:1/20:0, d18:1/24:1, and d18:1/24:0. The profile included specific PL, SM, Cer and CE species as listed in Table 1. Glycerophospholipid annotation is based on the assumption of even numbered carbon chains only. SM species annotation was based on the assumption that d18:1 (dihydroxy 18:1 sphingosine) is the main base of sample SM species. Lipid species were annotated according to the recently published proposal for shorthand notation of lipid structures that are derived from mass spectrometry.30
| Lipid | Lipid species (carbon numbers: Double bond numbers) | ||||||||||||
|---|---|---|---|---|---|---|---|---|---|---|---|---|---|
| LPC | LPC 15:0 LPC 22:4 | LPC 16:1 LPC 22:0 | LPC 16:0 | LPC 18:3 | LPC 18:2 | LPC 18:1 | LPC 18:0 | LPC 20:5 | LPC 20:4 | LPC 20:3 | LPC 20:0 | LPC 22:6 | LPC 22:5 |
| PS | PS 32:1 | PS 34:2 | PS 34:1 | PS 36:3 | PS 36:2 | PS 36:1 | PS 38:4 | PS 38:3 | PS 40:7 | PS 40:6 | |||
| PC | PC 30:1 PC 36:1 | PC 30:0 PC 38:5 | PC 32:2 PC 38:4 | PC 32:1 PC 38:3 | PC 32:0 PC 38:2 | PC 34:3 PC 40:6 | PC 34:2 PC 40:5 | PC 34:1 PC 40:4 | PC 34:0 | PC 36:5 | PC 36:4 | PC 36:3 | PC 36:2 |
| PE | PE 32:2 PE 38:5 | PE 32:1 PE 38:4 | PE 32:0 PE 38:3 | PE 34:3 PE 38:2 | PE 34:2 PE 38:1 | PE 34:1 PE 40:6 | PE 34:0 PE 40:5 | PE 36:5 PE 40:4 | PE 36:4 PE 40:3 | PE 36:3 PE 42:7 | PE 36:2 PE 42:6 | PE 36:1 PE 42:5 | PE 38:6 |
| PI | PI 34:3 PI 40:6 | PI 34:2 PI 40:5 | PI 34:1 PI 40:4 | PI 36:4 PI 40:3 | PI 36:3 | PI 36:2 | PI 36:1 | PI 36:0 | PI 38:6 | PI 38:5 | PI 38:4 | PI 38:3 | PI 38:2 |
| Cer | C16:0 | C18:0 | C20:0 | C22:0 | C23:0 | C24:1 | C24:0 | Glu C16:0 | Glu C24:1 | ||||
| SM | SM14:0 SM24:1 | SM15:0 SM24:0 | SM16:1 | SM16:0 | SM18:1 | SM18:0 | SM20:1 | SM20:0 | SM22:1 | SM22:0 | SM24:2 | ||
| CE | CE 14:0 CE 20:2 | CE 15:0 CE 20:1 | CE 16:1 CE 20:0 | CE 16:0 CE 22:6 | CE 18:3 CE 22:5 | CE 18:2 CE 22:4 | CE 18:1 CE 22:1 | CE 18:0 | CE 20:5 | CE 20:4 | CE 20:3 | ||
2.8 Lipoprotein Analysis
FATP and GFP cells were incubated in oleate-free medium containing fetal calf serum. After 24 h, supernatants from 3 wells were pooled from GFP and FATP4 cells. Lipoproteins in supernatants were analysed by using an on-line dual-enzymatic method with gel-permeation high-performance liquid chromatography at Liposearch Skylight Biotech, Akita, Japan. This method measures cholesterol and TG levels in chylomicrons (CM, >80 nm), very low density lipoproteins (VLDL, 30–80 nm), low density lipoproteins (LDL, 16–30 nm), and high-density lipoprotein (HDL, 8–16 nm). Particle size of lipoproteins in cholesterol and TG was calculated from the profile according to Liposearch procedure.31
2.9 Statistical Analysis
Results were expressed as mean ± SD. Statistical analysis was performed using GraphPad Prism Software version 5.
3 Results and Discussion
3.1 FATP4 and Pal-Induced Sensitization Causes an Alteration in Lipid Metabolism
FATP4-overexpressed and GFP transfected Huh-7 cells were generated and respectively named as FATP4 and GFP cells.11 GFP and FATP4 were treated with BSA control or Pal for 20 h and subjected to lipid analyses. Cellular TG contents were determined by enzymatic assays. By ESI/MS/MS, the contents of PC, PE, PI, PS, LPC, SM, Cer, and CE with specific species as listed in Table 1 were determined. These PL were grouped into PL containing saturated and unsaturated fatty acids. Saturated PL were those PL that contained no double bonds (e.g., 30:0, 32:0, 34:0, Table1). MUFA and PUFA PL were those contained one and ≥2 double bonds, respectively. Unsaturated PL were MUFA and PUFA PL combined.
Without Pal treatment, FATP4 cells contained a significant increase (#, p < 0.05) of unsaturated PC, PE, PI, PS, and LPC (Figure 1A), saturated SM and Cer (Figure 1B) as well as TG and FC (Figure 1C). The effects of FATP4 in response to Pal were studied by comparing GFP/Pal and FATP4/Pal groups. FATP4 in response to Pal caused a significant increase (§, p < 0.05) of saturated and unsaturated PC, unsaturated PI and LPC (Figure 1A), saturated SM, Cer (Figure 1B) as well as TG, FC and saturated CE (Figure 1C). Hence, FATP4 sensitization with Pal was associated with significant increases of some polar and neutral lipids.

To determine compositional shift or channeling among polar and neutral lipids, we calculated the ratios among them. PLs were grouped into saturated, MUFA, and PUFA according to Table 1. The ratios among saturated, MUFA and PUFA PL were calculated as shown in Figures 2A–C, respectively. To better observe FATP4 response, we calculated response to Pal by FATP4 based on GFP/con in% according to formula: [(meanFATP4/Pal − meanFATP4/con) − (meanGFP/Pal − meanGFP/con)] / meanGFP/con x 100%. When considering saturated PL, the response to Pal by FATP4 showed an increase of PC/PE and PC/PI indicating a shift from PE and PI to PC in this saturated pool. However when considering MUFA and PUFA PL, response to Pal by FATP4 showed a decrease of PC/PE and PC/PS indicating a shift from PC to PE and PS in these unsaturated pools. Thus, FATP4 in response to Pal caused a contrasting channeling with a shift to PC among saturated PL, and to PE and PS among unsaturated PL.32, 33 Similar to PC shift, response to Pal by FATP4 showed an increase of SM/Cer (Figure 2D) indicating a shift to SM synthesis from Cer.34

We further determined if there was a shift or channeling between polar and neutral lipids cholesterol esters (CE), free cholesterol (FC), and TG. The response to Pal by FATP4 showed a decrease of CE/PC and CE/PE among saturated CE and PL (Figure 2E) and CE/PE and CE/PS among unsaturated CE and PL (Figure 2F). This indicated that FATP4 caused a shift from CE to PC (saturated), PE and PS (unsaturated) in response to Pal. Similarly, a decrease of FC/PE and FC/PS (Figure 2G) as well as TG/PE and TG/PS (Figure 2H) was observed. This indicated that FATP4 in response to Pal caused a shift from FC and TG to PE and PS.
As for a shift between PC and PI and neutral lipids, an increase of CE/PC, CE/PI (Figures 2E and F), and FC/PC, FC/PI, and TG/PC, TG/PI (Figures 2G and H) was observed. This indicated that FATP4 in response to Pal caused a shift from PC and PI to CE, FC, and TG.
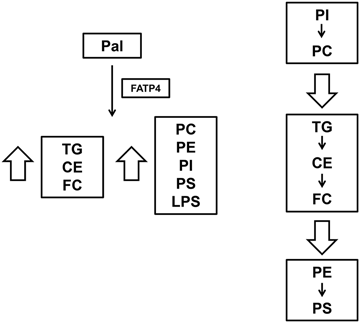
Taken together, FATP4 in response to Pal sequentially caused FA channeling with a shift from PC and PI to neutral lipids and from neutral lipids to PS and PE. Consistently, there was a shift from PC to PE and PS among unsaturated PL. Neutral lipids seemed to play the central role in FA trafficking from PC and PI to PE and PS. These events are now shown in Figure 5. The provision of FA readily for activation by FATP4 would require phospholipases and hydrolases for the hydrolysis of PC, PI and TG, CE, respectively. The preferential synthesis of PE and PS by FATP4 response to Pal would also indicate possible role of FATP4 in elongation and desaturation of FA.
FATP4 overexpression sensitized with Pal for synthesis of some polar and all neutral lipids (Figure 1). This is supported by in vivo data that FATP4 expression is increased in livers of mice fed with high-fat diet feeding,11, 35 likely due to FATP4 regulation by fatty acids which are PPAR agonists.36 FATP4 expression is consistently increased in adipose tissue of obese individuals.19 Although most lipids were increased by FATP4 sensitization with Pal supporting increased steatosis, our ratio analyses also revealed hepatocellular FA distribution among PL and neutral lipids. In the first step, FATP4 caused a shift from PC and PI to neutral lipids. This indicated a channeling of lipid metabolism from PC and PI syntheses into the synthesis of TG, FC and CE to form lipid droplets. Such an FA distribution has been previously described in yeast.37 While lipid droplets also contain hydrolases and lipases for TG and CE hydrolyses38 and these droplets are in contact with mitochondria13 and peroxisomes39 where FATP4 is localized,11 it is surmised that FA from TG hydrolysis by ATGL39 become substrates of FATP4 directed for the synthesis of PE and PS (Figure 5). Because PE and PS contain PUFA at higher levels than PC, the shift to PE and PS by FATP4 sensitization to Pal also indicated an increase of FA elongation and desaturation.40 Consistently, high fat feeding is shown to cause a hepatic shift from a pattern dominated by saturated and MUFA to one dominated by polyunsaturated C18:2 derived from dietary linoleic acid.41 This cellular shift may contribute to the progression of pathological changes from steatosis to inflammation.41 Consistently, pathological events such apoptosis are shown to be associated with an increase in PE42 and PS.43
3.2 FATP4 Enhances ER Stress and Induces Palmitate-Induced JNK Activation Signaling.
The composition among PL subclasses and TG has to be maintained during Pal-induced stress in order to achieve functional degree of fluidity and curvature in membranes of cellular organelles. It is conceivable that altered composition among PL and neutral lipids44 may lead to ER stress upon Pal treatment.45 We therefore determined ER stress transcription factor CHOP45 in our experimental system. Pal treatment in a time-dependent manner caused increases of CHOP mRNA expression to a greater extent in FATP4 than GFP cells (Figure 3A). Conversely, an effective FATP4 knockdown in FATP4 cells (Figure 3B, Inset) inhibited an increase of Pal-induced CHOP expression (Figure 3B).

We previously reported FATP4 sensitized with Pal for exaggerated JNK activation,11 we further analyzed upstream signaling of JNK. MLK346 is a mitogen-activated protein kinase kinase (MKK) member which is known to activate JNK and its downstream targets MKK4 and MKK7.47 We performed knockdown of MLK3 to investigate whether the enhanced Pal-induced JNK activation in FATP4 cells was MLK3 dependent. Accordingly, MLK3 knockdown in FATP4 cells inhibited Pal-induced JNK phosphorylation (Figure 3C, p < 0.05). Moreover we performed FATP4 knockdown in FATP4 cells with or without Pal, and measured MLK3 mRNA expression. Pal treatment increased MLK3 mRNA expression in control and sicon-transfected cells, and this increase was attenuated by FATP4 knockdown (Figure 3D). This indicated that FATP4 was required for Pal-induced activation of MLK3 which is a gene critical in development of diet-induced NAFLD.48 We further studied MLK3 target MKK7. MKK7 phosphorylation was constitutively increased in FATP4 cells when compared with GFP cells (Figure 3E). Pal treatment activated MKK7 phosphorylation at faster rates FATP4 cells at 2 and 4 h whereas at 4 and 8 h in GFP cells (Figure 3E). No difference was seen for MKK4 between FATP4 and GFP cells treated with Pal (data not shown). MKK7 functions is a specific activator of JNK,49 and FATP4 has selectivity towards MKK7 rather than MKK4.
Glycogen synthase kinase (GSK)-3β is as an upstream kinase responsible for activation of MLK350 which is involved in ER stress-induced apoptosis51 and lipoapoptosis.52 We therefore measured GSK-3β activation in GFP and FATP4 cells with and without Pal. Phosphorylation of GSK-3β converts N-terminus into pseudosubstrate inhibitor that competes for binding with the “priming phosphate” of substrates resulting in an inactivation of GSK-3β.53 Compared to GFP cells, FATP4 cells expressed decreased levels of GSK-3β phosphorylation indicating increased GSK-3β activation in FATP4 cells (Figure 3F, p < 0.05). Pal treatment further decreased GSK-3β phosphorylation in both cell. Thus, the observed sensitivity of FATP4 cells for GSK-3β activation was in line with observed Pal response in terms of an induction of MLK3 and MKK7 phosphorylation.
3.3 FATP4 Overexpression Increases TG-rich and Cholesterol-Rich Low Density Lipoproteins.
As FATP4 overexpression increased cellular TG and PC (Figure 1) two major lipids for synthesis of lipoproteins, we therefore measured lipoprotein release in supernatants of FATP4 cells. Compared to GFP cells, FATP4 cells secreted higher levels of TG- and cholesterol-rich low density lipoproteins (LDL) by ≈60% and ≈50%, respectively (Figure 4A, B). No difference was seen for chylomicron (CM), VLDL, and high density lipoproteins (HDL) (Figures 4A and B) as well as in the particle size of TG-rich lipoproteins (Figure 4C). While VLDL secretion could be observed in other cultured hepatocyte McA-RH7777 cell line54, the observed increase of only LDL in FATP4 cells suggested that VLDL may have undergone hydrolysis to LDL by lipoprotein lipase which is present in Huh-7 cells55. Compared with GFP cells, FATP4 cells showed greater particle size of cholesterol-rich VLDL (27.3 vs. 31.7 nm) but a decrease of LDL size (26.5 vs. 23.8 nm) (Figure 4D). As VLDL-cholesterol can be hydrolyzed to smaller particle size LDL-cholesterol by lipoprotein lipases, the observed decrease in LDL size may indicate that lipoprotein lipase activity may be lower in FATP4 than GFP cells. It has been shown that lipase activity of lipolytic enzymes can be inhibited by acyl-CoA,56 consistently, acyl-CoAs with FATP4 overexpression inhibit the hydrolysis of VLDL-cholesterol resulting in its accumulation. As FATP4 response with Pal was able to increase PL containing unsaturated fatty acids, these PL are likely to be secreted as lipoproteins as previously shown in lymph.57 Hence, the changes of fatty acyl-chain composition of PL may regulate VLDL secretion23 (Figure 5). In support of this, the deletion of hepatic LPCacyltransferase 3, which reacylates PUFA into PC, lowers the amount of PUFA-containing PC and impairs VLDL lipidation and secretion.58 These lipoproteins containing unsaturated PC may in turn provide FA for TG synthesis in hepatocytes.59 These findings support our results that FATP4 catalysis was able to increase TG and unsaturated FA-containing PL to regulate lipoprotein secretion. Not only PC, PI is also increased in FATP4 response to Pal, presumably PI in lipoproteins could lead to pathological outcome as reported in atherosclerotic plaques.60


4 Conclusion
In conclusion, our model system provided new insights on FATP4 functions in FA trafficking during Pal overload. This sensitization increased overall lipids which led to steatosis, lipotoxicity, and an activation of ER stress CHOP, GSK-3β, MLK3, and MKK7. Our ratio analysis also revealed that FATP4 in response to Pal supported synthesis of saturated PC but caused a sequential shift of unsaturated PC and PI to neutral lipid CE, TG, and FC, and finally to PE and PS. These compositional changes may also contribute to JNK activation and apoptosis.11
Abbreviations
ACSL, long chain acyl-CoA synthetase; Cer, ceramides; CHOP, C/EBP homologous protein; CM, chylomicrons; CoA, coenzyme A; ER, endoplasmic reticulum; ESI-MS/MS, electrospray ionization tandem mass spectrometry; FATP, fatty acid transport protein; FC, free cholesterol; GAPDH, glycerinaldehyd-3-phosphat-dehydrogenase; GFP, green fluorescence protein; GSK-3β, glycogen synthase kinase-3β; HDL, high-density lipoprotein; JNK, c-Jun N-terminal kinases; LDL, low-density lipoprotein; LPC, lysophosphatidylcholine; MKK, mitogen-activated protein kinase kinase; MLK3, mixed lineage kinase 3; NAFLD, non-alcoholic fatty liver disease; Pal, palmitate; PC, phosphatidylcholine; PE, phosphatidylethanolamine; PI, phosphatidylinositol; PL, phospholipids; PS, phosphatidylserine; siRNA, small interfering RNA; SM, sphingomyelin; TG, triglycerides; VLDL, very low-density lipoprotein.
Acknowledgements
J.S., G.S., W.S., and W.C. conceived and designed the experiments; J.S. and G.L. performed the experiments; J.S., G.L., and W.C. analyzed the data; J.S. and W.C. wrote the paper. J.S. was a recipient of Rahel Goitein Straus award from Medical Faculty University Heidelberg. We thank Simone Staffer, Sabine Tuma, Stephan Döring, Jolante Aiwanger, Simone Düchtel, and Doreen Müller for their technical assistance. The authors also thank Joachim Füllekrug in providing a possibility for generating FATP4-overexpressed Huh-7 cell line.
Conflict of Interests
The authors declare no conflict of interest.