Time course of Algerian Azeradj extra-virgin olive oil quality during olive ripening
Abstract
The aim of this work was the chemical characterization of Algerian Azeradj extra-virgin olive oil (EVOO) at different harvest dates in terms of oil yield, quality indices, fatty acids, pigments, polyphenols, and oxidative stability, in order to establish the best harvesting period for this variety. For this purpose, Azeradj EVOO samples were taken at three harvest dates corresponding to three ripening stages. Except for K270, the analysis of EVOOs showed a significant increase in the values of all quality parameters as olive ripening progresses (free fatty acids, peroxide index, and K232), while no significant variation was found for oil yield. Moreover, a significant decrease was observed for the monounsaturated fatty acid:polyunsaturated fatty acid (MUFA:PUFA) ratio, chlorophyll, carotenoids, total phenols, and oxidative stability in EVOOs produced at the advanced ripening stage. For better monitoring of the behavior of the phenolic fraction in EVOOs during ripening, for the first time in this work, individual phenolic compounds of Azeradj EVOOs was characterized using HPLC-ESI-TOF/MS. A total of 21 phenolic compounds belonging to different families were identified in Azeradj EVOOs. The highest concentrations of secoiridoids and phenolic alcohols were found at the beginning of November (D1); however, lignans and flavones concentrations were higher at the end of November (D2). EVOO obtained at the last harvest date (D3) showed the lowest content on all phenolic families. Finally, according to the results of the analyses performed in this work, early harvesting provides Azeradj EVOO with excellent chemical characteristics.
Practical applications: The Algerian olive oil sector is one of the least competitive in the Mediterranean region even if the Algerian olive oil displays some potential assets. Therefore, the chemical characterization of olive oil from one of the main varieties (Azeradj) cultivated in Algeria is of a great importance. The results will be available to all Algerian olive oil producers, and should be helpful in choosing the optimal harvest period to obtain Azeradj EVOO of high chemical quality.
Olive ripeness affects the chemical composition of Azeradj extra-virgin olive oil.
1 Introduction
Extra-virgin olive oil (EVOO) is the main source of fat in the Mediterranean region. The healthy proprieties of this oil were attributed firstly to its high content on monounsaturated fatty acids (MUFA), presented by oleic acid as the most abundant one 1. However, recent studies demonstrated that the minor fraction as polyphenols also make a major contribution to healthy EVOO properties 2, 3. Due to these characteristics, EVOO consumption, as a healthy food, is increasing considerably throughout the world. Nevertheless, an increasing demand for EVOO cannot be ascribed exclusively to its beneficial effects on health, but also to its unique aroma and taste that distinguish it from other edible vegetable oils 4. In addition to its health and organoleptic properties, the oxidative stability of EVOO is high, due to its high ratio of monounsaturated:polyunsaturated (MUFA:PUFA) fatty acids, and the presence of polyphenols, chlorophyll, and carotenoids 5, 6.
Algeria is a Mediterranean country where olive-oil production began under the Imperial Roman dominance. Olive orchards are mostly traditional (90%), located in the mountain areas and marginal lands, characterized by a rainfall average of 400 to 900 mm/year. The orchards are dominated by three main varieties: Chemlal, Bouchouk, and Azeradj. Although Algeria ranks seventh worldwide in olive-oil production, most of olive oil produced in the country is still considered unsuitable for human consumption, limiting its market share. Due to this low competitiveness of Algerian olive oils, the enhancement of its quality in order to guarantee its nutritional and organoleptic proprieties has become a priority of the country. For this, the study of the factors having a direct impact on olive-oil quality is fundamental 7, 8.
Olive-oil composition is well known to be affected by several factors related to its agronomic conditions of cultivation and its extraction process 9, 10. Among the agronomic factors, the degree of olive ripening is a key to take into consideration before the harvesting. During ripening, chemical changes occur inside the drupe in relation to the synthesis of triglycerides and other enzymatic activities. These changes are reflected in olive oil quality 11, 12. Previous studies have suggested that the majority of olive oil produced does not belong to the best commercial quality as the fruit is not picked at the optimal harvest time. This illustrates the need to determine an appropriate maturation stage of each olive variety before processing 13. Consequently, the objective of this work was the chemical characterization of Algerian Azeradj EVOO obtained at different harvest dates, in order to determine its optimal harvest period. Notably, a detailed characterization of individual phenolic compounds in EVOOs from this variety, using HPLC-ESI-TOF/MS, was carried out for the first time in this work.
2 Materials and methods
2.1 Chemicals and apparatus
All chemicals were of analytical reagent grade. Cyclohexan, potassium hydroxide, and acetic acid were purchased from Sigma–Aldrich (St. Louis, MO, USA). Sodium hydroxide, isopropanol, n-hexane, and methanol were purchased from Merck (Darmstadt, Germany). Double-deionized water with conductivity less than 18.2 MΩ cm was obtained with a Milli-Q system (Millipore, Bedford, MA, USA). Standards of hydroxytyrosol, tyrosol, luteolin, apigenin, p-coumaric acid, and quinic acid were purchased by Sigma–Aldrich (St. Louis, MO, USA), and (+)-pinoresinol was acquired from Arbo Nova (Turku, Finland). Oleuropein and dihydrocaffeic acid were purchased from Extrasynthese (Lyon, France).
2.2 Samples
Olive fruits from the Azeradj variety were manually collected on different dates (D1, 03 November 2013; D2, 27 November 2013; and D3, 21 December 2013) from trees cultivated in the same area (Haizar), in north-central Algeria. The trees were under the same agricultural practices and climatic conditions (temperature and precipitation). For the sampling, nine trees were randomly assigned to different groups. From each group, 1200 g of olives was collected for each harvest date, making three homogeneous samples per harvest, which were used for olive-oil extraction. In addition, the olive-maturity index (MI) was determined according to the method previously reported in the literature 14. This method was based on the assessment of the color of the olive skin and pulp. MI values ranged from 0 (very green skin 100%) to 7 (100% purple flesh and black skin).
Olive-oil samples were made at the laboratory scale using the Abencor system (S.I.O.L. 20240 GHISONACCIA, France) equipped with a hammer crusher, malaxer, and centrifuge. Prior to the crushing step, the olives were manually sorted and cleaned, removing damaged fruit, leaves, and other debris. The clean and healthy olives were crushed and were slowly mixed for 30 min at 25°C. Then, the resulting paste was subjected to centrifugal separation for 3 min at 3000 rpm. The liquid phase (oil and waste) was allowed to decant naturally into specimens. The top oil layer was removed, stored in glass bottles at room temperature, and kept away from light until its analysis.
2.3 Oil yield
The olive-oil content was determined according to the analytical method described in EEC Regulation 2568/91 applied to olive pomace and the following amendments 15. Olives dried at 80°C, were ground in a mortar. Afterwards, 10 g of the ground material was used for oil extraction in a Soxhlet apparatus for 8 h using n-hexane at 80°C. At the end of the extraction the solvent was separated by a rotary evaporator.
2.4 Analytical determination of the quality parameters
Free fatty acids (FFA) (%), peroxide value (PV), and spectrometric UV (K232 and K270 nm) were determined according to analytical methods described in EEC Regulations 2568/91 and the following amendments 15. All parameters were determined in triplicate for each sample. FFA was given as a percentage of oleic acid and PV expressed in milliequivalents of active oxygen per kilogram of oil (meq O2/kg). Spectrophotometric determinations were made using an UV mini-1800 instrument (Shimadzu Co., Kyoto, Japan). The K232 and K270 extinction coefficients were calculated from absorption at 232 and 270 nm, respectively.
2.5 Fatty acid composition
The fatty acid (FA) composition was determined according to the method described previously 8. Prior to chromatographic analysis, the fatty acids were converted to methyl esters using the following method: 0.2 g of olive oil was added to 3 mL of n-hexane and 0.4 mL of methanolic potassium hydroxide 2N, followed by stirring. A gas chromatograph (GC) Chrompack CP 9002 (Les Ulis, France) equipped with split/splitless injector, and flame-ionization detector (FID) was used for this determination. The analytes were separated on DB23 (50% cyanopropyl) capillary column (30 m × 0.32 mm i.d., 0.25 µm film thickness; Agilent Technologies, Palo Alto, CA, USA) and nitrogen as the carrier gas (Linear velocity, 0.5 cm/min; split ratio of 1:30, v/v). The injection volume into a split GC port was 0.8 µl. The temperature of the column was held constant throughout the entire separation at 200°C. The FID and the injector temperatures were 280, and 250°C, respectively. Three replicates were prepared and analyzed per sample.
2.6 Chlorophyll and carotenoids


2.7 Phenolic compounds
Phenolic compounds were isolated from Azeradj EVOOs using a liquid-liquid extraction system following the method reported previously 9, with some modifications. EVOO, with 50 µL of internal standard solution (25 mg L−1 dihydrocaffeic acid in methanol) added, was dissolved in n-hexane (2.5 g in 5 mL). Afterwards, 5 mL of methanol/water (60/40, v/v) was added, and the mixture was vortexed and then centrifuged at 3500 rpm for 10 min. The polar extract was evaporated to dryness in a rotary evaporator under reduced pressure at 35°C. The residue was dissolved in 0.25 mL of methanol/water (50/50 v/v) and finally filtered through a 0.2 µm filter before the HPLC analysis.
The analysis to characterize the phenolic profile of Azeradj EVOOs extracts was performed in an Agilent 1200-HPLC system (Agilent Technologies, Waldbronn, Germany) equipped with a vacuum degasser, autosampler, a binary pump, and a diode array detector (DAD). The chromatographic separation of these compounds was performed on a 150 mm × 4.6 mm i.d., 1.8 µm, Zorbax Eclipse Plus RP-C18 column (Agilent Technologies, Palo Alto, CA, USA). The mobile phases used were water with 0.25% acetic acid as eluent A and methanol as eluent B. The total run time was 27 min using a previously reported multistep linear gradient 17. The flow rate was 0.80 mL min−1 and, consequently, the use of a splitter was required for the coupling with the MS detector, as the flow which arrived to the TOF detector had to be 0.2 mL min−1 to ensure reproducible results and stable spray. HPLC was coupled to a time-of-flight mass spectrometer detector micrOTOF (Bruker Daltonik, Bremen, Germany), which was equipped with a model G1607A ESI interface (Agilent Technologies) operating in negative ion mode.
External mass-spectrometer calibration was performed with sodium acetate clusters (5 mM sodium hydroxide in water/isopropanol 1/1 (v/v), with 0.2% of acetic acid) in quadratic high-precision calibration (HPC) regression mode. The optimum values of the source and transfer parameters were established according to the method published previously 17. The widely accepted accuracy threshold for confirmation of elemental compositions was set at 10 ppm for most of the compounds. The phenolic compounds were identified by comparing both retention times and MS data from samples and standards. The remaining compounds for which no commercial standards were available were identified by the interpretation of the information generated by the TOF analyzer, and the information reported in the literature 9, 17, 18. Quantification was made by HPLC-ESI-TOF/MS. Eight standard calibration curves of the main compounds found in the samples were prepared using eight commercial standards. Stock solutions at a concentration of 1000 mg L−1 for each phenolic compound were first prepared by dissolving the appropriate amount of the compound in methanol. Afterwards, the stock solutions were serially diluted to working concentrations. All calibration curves showed good linearity over the study range (r2 = 0.996). The individual concentrations were determined using the area of each individual compound (three replicates) and by interpolation of the corresponding calibration curve. Results were given in milligram of analyte per kilogram of EVOO.
2.8 Oxidative stability
The olive-oil oxidative stability was measured using rancimat (Metrohm Applications) following the method proposed previously 19. The oil sample was subjected to an air stream at 10 L/h and temperature of 102°C ± 1.6°C. The results were expressed as oxidative induction time (hours). The oxidative stability was tested three times per sample.
2.9 Statistical analysis
The data were analyzed using Origin (version Origin Pro 8 SR0, Northampton, MA, USA) to perform a one-way analysis of variance (ANOVA) with p ≤ 0.05 to identify significant differences among all parameters analyzed in Azeradj EVOOs from different harvest dates.
3 Results and discussion
3.1 Oil content
Fruit color serves as a common marker for maturation level, expressed as maturity index (MI). As shown in Table 1, the temporal progression of the harvest season was accompanied by a significant increase in MI. Indeed, the lowest value (2.5) was found in olives harvested early corresponding to the harvest date D1. However, the highest value (5.0) corresponded to olives harvested later (D3). As previously reported, the increase in the maturity index changed the olive-oil content expressed as a percentage of dry matter 20. Analyzing the results in this study, we found that olive-oil yield values firstly tended to increase from 37% to 40% for harvest dates D1 and D2, respectively. Later, olive-oil yield tended to decrease to 37% at the last harvest date (D3). Nevertheless, no significant variation in olive-oil yield was found during the maturity process. These results corroborate those of previous studies 8, 21.
| Parametersa | D1b | D2 | D3 | Legal limits |
|---|---|---|---|---|
| Maturity index | 2.5c ± 0.2 | 3.3b ± 0.3 | 5.0a ± 0.1 | |
| Oil yield (% dry matter) | 37a ± 3 | 40a ± 2 | 37a ± 3 | |
| Free fatty acids (% oleic acid) | 0.32b ± 0.01 | 0.34b ± 0.02 | 0.44a ± 0.01 | ≤0.8 |
| Peroxid value (meq g O2/kg) | 4.5b ± 0.3 | 5.3b ± 0.3 | 6.5a ± 0.2 | ≤20 |
| K232 | 2.17b ± 0.02 | 2.2b ± 0.2 | 2.5a ± 0.21 | ≤2.5 |
| K270 | 0.15a ± 0.01 | 0.11a ± 0.01 | 0.11a ± 0.01 | ≤0.22 |
| Chlorophyll (mg/kg) | 3.3a ± 0.1 | 0.79b ± 0.04 | 0.62b ± 0.04 | |
| Carotenoids (mg/kg) | 1.8a ± 0.1 | 0.74b ± 0.02 | 0.71b ± 0.03 |
| Fatty acids Composition | D1 | D2 | D3 | |
|---|---|---|---|---|
| Palmitic acid | 13a ± 1 | 12.3a,b ± 0.3 | 11.5b ± 0.2 | 7.5–20 |
| Palmitoleic acid | 0.96a ± 0.02 | 0.76b ± 0.01 | 0.92a,b ± 0.04 | 0.3–3.5 |
| Stearic acid | 4.0a ± 0.4 | 3.50a,b ± 0.03 | 3.44b ± 0.03 | 0.5–5 |
| Oleic acid | 75a ± 1 | 75a ± 1 | 72a ± 3 | 55–83 |
| Linoleic acid | 8.1b ± 0.1 | 9.1b ± 0.3 | 12a ± 1 | 3.5–21 |
| Linolenic acid | NQ | 0.61a ± 0.04 | 0.66a ± 0.01 | ≤1 |
| MUFA/PUFA | 9.3a ± 0.3 | 7.8b ± 0.2 | 6c ± 1 |
- a MUFA/PUFA: monounsaturated fatty acids/polyunsaturated fatty acids.
- b D1, D2, D3: harvest dates.
- Values with the same letter in a line are not significantly different at a 95% confidence level (p ≤ 0.05).
3.2 Quality parameters
According to the results obtained for FFA, PV, and specific extinctions, K232 and K270, all the samples analyzed can be categorized as extra-virgin olive oil. FFA designates the degree of hydrolytic deterioration, reflecting the health status of the olive fruit. Its values varied slightly in EVOO for harvest dates (D1) and (D2). However, a significant increase was found in EVOO belonging to the last harvest date (D3). This tendency in FFA during ripening could be explained by the enzymatic activity, especially lipolytic ones 22. PV is the most method commonly used to measure the total hydroperoxides as the primary oxidation products. Although the values for these parameters found in this work were much lower than the limit fixed for the EVOO category, PV tended to increase during ripening. Nevertheless, this increase proved significant only in EVOO produced from olives harvested in December (D3). The increase of PV during ripening was found in previous studies, and was attributed to the high lipoxygenase activity 4, 23. K232 also considered an indicator of olive-oil primary oxidation. The same tendency of K232 as PV was found during ripening. Indeed, its highest value was found for the last harvest date (D3). Finally, the analysis of K270 gives information on secondary oxidation of olive oil. The results for this parameter did not significantly differ among harvest dates. With respect to the results for PV, K232, and K270, the EVOOs made at the advanced maturity stage corresponding to the harvest date D3 were slightly oxidized. However, secondary oxidation did not occur.
3.3 Fatty acids
The change in fatty acid composition of Azeradj EVOO during ripening is given in Table 1. As the olive ripening progressed, palmitic acid, the main saturated fatty acid in EVOO, significantly declined in content at the last harvest date (D3) together with stearic acid. A slight decrease in oleic acid content was observed in EVOO produced from olives harvested later (D3). However, it did not significantly vary among the harvest dates under study. Linoleic acid content tended to increase during ripening, and its increase was significant only in EVOO belonging to the last harvest date. The behavior of linoleic acid during ripening has been attributed in previous studies to the activity of the enzyme oleate desaturase, which transforms oleic acid into linoleic acid during triacylglycerol biosynthesis 24, 25. However, analyzing our results, we found that between the first and second harvest dates linoleic acid content tended to increase while oleic acid content remained constant. These results could be explained by the equilibrium between oleic acid synthesis and its transformation to linoleic acid. Concerning linolenic acid, it was identified in Azeradj EVOO obtained only on the second (D2) and third (D3) harvest dates, its content did not vary significantly between the two dates. Due to the great importance of fatty acid composition on EVOO oxidative stability 6, the ratio of MUFA:PUFA was calculated for different harvest dates (Table 1). This ratio decreased significantly during olive ripening. Indeed, the highest value (9.3) was found in EVOO belonging to the first harvest date (D1). Nevertheless, its lowest value (6) resulted in EVOO from olives harvested later (D3). This tendency for fatty acid composition during ripening could involve a rise in EVOO oxidative susceptibility at more advanced ripening stages, corresponding to the last harvest date.
3.4 Pigments (chlorophylls and carotenoids)
Chlorophyll and carotenoid play an important role in olive-oil sensory properties, by determining its color, which is one of the factors that influence consumer selection. These pigments were considered responsible mainly for the variation on olive-oil color from yellowish green to greenish gold. Furthermore, pigments are also involved in olive-oil oxidative stability 5, 16. The degree of olives ripening is crucial for pigment (chlorophyll and carotenoid) concentrations in olive oil. The highest concentration value of chlorophyll in EVOOs under study was found in the early olive-harvesting period (D1, 3.3 mg kg−1). After 24 days, the chlorophyll content significantly declined (D2, 0.79 mg kg−1), resulting in a reduction of 78% from the initial content recorded on the first harvest date. Finally, the decrease in this content was lower, and no significant variation was found between EVOO from D2 and D3, respectively. A similar trend was found for the carotenoid content during the ripening process (Table 1). These results agree with those reported previously in the literature for other cultivars 8, 13, 22.
3.5 Characterization of phenolic and other polar compounds in Azeradj EVOOs
3.5.1 Qualitative characterization
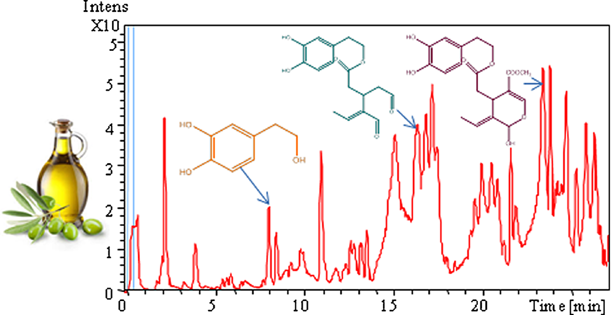
The base-peak chromatogram (BPC) of Azeradj EVOO phenolic extract, determined using HPLC-ESI-TOF/MS in negative ionization mode, is shown in Fig. 1. The tentatively identified compounds are summarized in Table 2, including retention times, calculated and experimental mass m/z, molecular formula, error, and msigma values. A total of 21 phenolic compounds and another polar compound (quinic acid) were characterized in the samples. The phenolic compounds identified are classified into five groups: phenolic alcohols, phenolic acids, secoiridoids, lignans, and flavones. The results provided by HPLC-ESI-TOF/MS showed no qualitative differences in phenolic profile among Azeradj EVOOs from different harvest dates under study.

| Peak number | Compoundsa | Retention time (min) | Molecular formula | m/z calcdb | m/z exptlc | Error (ppm) | msigma |
|---|---|---|---|---|---|---|---|
| 1 | Quinic acid | 2.19 | C7H12O6 | 191.0561 | 191.0563 | −0.9 | 2.7 |
| 2 | H- HYTY | 3.92 | C8H8O3 | 151.0401 | 151.0395 | 3.5 | 1.8 |
| 3 | HYTY | 8.00 | C8H10O3 | 153.0557 | 153.0554 | 2.2 | 3.9 |
| 4 | TY | 9.83 | C8H10O2 | 137.0608 | 137.0596 | 8.5 | 4.7 |
| 5 | DEA | 10.90 | C9H12O4 | 183.0663 | 183.0655 | 4.3 | 3.1 |
| 6 | H-D-Ol Agl or isomer | 11.74 | C17H20O7 | 335.1136 | 335.1116 | 5.9 | 14.0 |
| 7 | p-coumaric acid | 13.45 | C9H8O3 | 163.0401 | 163.0395 | 3.7 | 12.1 |
| 8 | EA | 15.00 | C11H14O6 | 241.0718 | 241.0713 | 1.8 | 4.6 |
| 9 | H-EA | 15.62 | C11H14O7 | 257.0667 | 257.0656 | 4.3 | 1.5 |
| 10 | DOA | 16.29 | C17H20O6 | 319.1187 | 319.1182 | 1.6 | 3.5 |
| 11 | H-D-Ol Agl or isomer | 16.62 | C17H20O7 | 335.1136 | 335.1122 | 4.1 | 17.0 |
| 12 | Syringaresinol | 18.21 | C22H26O8 | 417.1555 | 417.1525 | 7.2 | 9.4 |
| 13 | Pin | 18.92 | C20H22O6 | 357.1344 | 357.1322 | 6.0 | 4.1 |
| 14 | D-Lig Agl | 19.27 | C17H20O5 | 303.1238 | 303.1235 | 0.80 | 4.2 |
| 15 | AcPin | 19.42 | C22H24O8 | 415.1398 | 415.1380 | 4.4 | 3.2 |
| 16 | H-D-Lig Agl | 19.84 | C17H20O6 | 319.1187 | 319.1177 | 3.1 | 18.8 |
| 17 | Dehydro Ol Agl | 21.61 | C19H20O8 | 375.1085 | 375.1057 | 2.8 | 14.3 |
| 18 | Ol Agl | 23.26 | C19H22O8 | 377.1242 | 377.1208 | 8.9 | 7.4 |
| 19 | Lut | 23.65 | C15H10O6 | 285.0405 | 285.0382 | 8.0 | 2.5 |
| 20 | Lig Agl | 25.65 | C19H22O7 | 361.1293 | 361.1272 | 5.9 | 2.5 |
| 21 | Apig | 25.90 | C15H10O5 | 269.0455 | 269.0445 | 3.8 | 4.6 |
- a H-HYTY, oxidized hydroxytyrosol; HYTY, hydroxytyrosol; TY, tyrosol; DEA, decarboxymethylated form of elenolic acid; H-D-Ol Agl, hydroxy decarboxymethyl oleuropein aglycone or isomer; EA, elenolic acid; H-EA, hydroxy elenolic acid; DOA, decarboxymethyl oleuropein aglycone; H-D-Ol Agl, hydroxy decarboxymethyl oleuropein aglycone or isomer; Pin, pinoresinol; D-Lig Agl, decarboxymethyl ligstroside aglycone; AcPin, acetoxypinoresinol; H-D-Lig Agl, hydroxy decarboxymethyl ligstroside aglycone; Dehydro Ol Agl, dehydro-oleuropein aglycone; Ol Agl, oleuropein aglycone; Lut, luteolin; Lig Agl, ligstroside aglycone; Apig, apigenin.
- b m/z calcd: calculated mass.
- c m/z exptl: experimental mass.
3.5.2 Quantitative characterization
Differences in phenolic content were detected among Azeradj EVOOs from different harvest dates. As shown in Table 3, phenolic alcohols decreased in EVOO as ripening progressed. Indeed, the highest concentration in EVOO corresponded to the first harvest date (29 mg kg−1, D1). A sharp decrease (71%) was registered on the phenolic alcohols content between EVOOs from the first (D1) and second (D2) harvest dates, respectively. The lowest content on this group of compounds was found in EVOOs from the last harvest date (D3), corresponding to the most advanced maturity index. Secoiridoids was the most abundant phenolic group quantified in the samples under study, a similar trend as phenolic alcohols was observed in its concentration during olive ripening. Although their decline was not high among the harvest dates studied, secoiridoids content varied between 186 mg kg−1 and 168 mg kg−1.
| Parametersa | D1b | D2 | D3 |
|---|---|---|---|
| H-HYTY | 2.06a ± 0.01 | 0.70b ± 0.01 | 0.48c ± 0.01 |
| HYTY | 5.9a ± 0.1 | 2.5b ± 0.2 | 0.76c ± 0.05 |
| TY | 21a ± 1 | 5.2b ± 0.1 | 1.8c ± 0.1 |
| Phenolic alcohols | 29a ± 2 | 8.5b ± 0.3 | 3.0c ± 0.2 |
| P-coumaric acid | 1.9a ± 0.1 | 1.3b ± 0.1 | 0.21c ± 0.01 |
| DEA | 0.60a ± 0.01 | 0.70a ± 0.01 | 0.20b ± 0.02 |
| EA | 53a ± 1 | 30b ± 2 | 25c ± 1 |
| DOA | 52a ± 5 | 46b ± 3 | 37.1c ± 0.3 |
| H-D-Ol Agl or Isomer | 8.51b ± 0.02 | 21a ± 1 | 27a ± 2 |
| D-Lig Agl | 18.0a ± 0.1 | 7.0b ± 0.2 | 7.2b ± 0.3 |
| H-D-Lig Agl | 20b ± 2 | 25a ± 2 | 23a ± 1 |
| Dehydro-Ol Agl | 10.4b ± 0.4 | 24a ± 1 | 25a ± 1 |
| Ol Agl | 15.6a ± 0.3 | 17a ± 1 | 17.58a ± 0.02 |
| Lig Agl | 8.0a ± 0.4 | 7.8a ± 0.4 | 7.3a ± 0.1 |
| Secoiridoids | 186a ± 1 | 178b ± 14 | 168c ± 9 |
| Syringaresinol | 0.46b ± 0.03 | 0.49a ± 0.04 | NQ |
| Pin | 3.7b ± 0.1 | 4.2a ± 0.1 | 3.3b ± 0.3 |
| Lignans | 4.15b ± 0.04 | 4.7a ± 0.1 | 3.3c ± 0.3 |
| Lut | 1.5b ± 0.1 | 2.7a ± 0.2 | 1.04b ± 0.01 |
| Apig | 0.16b ± 0.01 | 0.33a ± 0.01 | 0.25a,b ± 0.02 |
| Flavones | 1.7b ± 0.1 | 3.0a ± 0.3 | 1.3b ± 0.1 |
| Quinic acid | 2.11a ± 0.03 | 0.66b ± 0.01 | 0.97b ± 0.04 |
| Total phenols | 222a ± 1 | 196b ± 6 | 176c ± 9 |
| Oxidative stability | 32a ± 3 | 31a ± 3 | 15.26b ± 0.03 |
- a H-HYTY, oxidized hydroxytyrosol; HYTY, hydroxytyrosol; TY, tyrosol; DEA, decarboxymethylated form of elenolic acid; EA, elenolic acid; DOA, decarboxymethyl oleuropein aglycone; H-D-Ol Agl, hydroxy decarboxymethyl oleuropein aglycone or isomer; D-Lig Agl, decarboxymethyl ligstroside aglycone; H-D-Lig Agl, hydroxy decarboxymethyl ligstroside aglycone; Dehydro Ol Agl, dehydro-oleuropein aglycone; Ol Agl, oleuropein aglycone; Lig Agl, ligstroside aglycone; Pin, pinoresinol; Lut, luteolin; Apig, apigenin.
- b D1, D2, and D3: harvest dates.
- Values with the same letter in a line are not significantly different at a 95% confidence level (p ≤ 0.05).
As opposed to phenolic alcohols and secoiridoids, lignans increased significantly in concentration, and its highest value was found in EVOO from the second harvest date (4.7 mg kg−1, D2). Afterwards, lignans concentration declined significantly to reach 3.3 mg kg−1 at the last harvest date (D3). The same trend as lignans was detected in the flavone content during ripening.
For a clearer understanding of the trends of phenolic compounds during ripening and for a fuller analysis of the results, the monitoring of individual concentrations provided by HPLC-ESI-TOF/MS is of great importance. Table 3 lists the phenolic compounds quantified and the individual concentration of each one at different harvest dates. Tyrosol seemed to be the most abundant phenolic alcohol in Azeradj EVOO, followed by hydroxytyrosol and its oxidized form. The concentration of these three compounds was higher in early harvested samples (D1). However, the hydroxytyrosol concentration declined by 87% from the first harvest date (D1) to the last one (D3). This data is important due to the reported role of hydroxytyrosol as antioxidant 26. The loss on its content during ripening could affect the oxidative stability of olive oil. A sharp reduction on tyrosol content was also found (91%) between D1 and D3 harvest dates. The trend of the content of these compounds during ripening has been reported in olive oils from other olive cultivars 8, 27, 28. The behavior of phenolic alcohols content during ripening could be attributed to the decrease on their synthesis. Previous study 11 showed that the active phenol synthesis takes place at the first ripening stages in fruit, and once the massive phase of polyphenol synthesis is complete, the biosynthetic capacity is reduced and there is a sudden decrease on polyphenols levels.
Concerning phenolic acids, the only compound which was identified and quantified in this group was p-coumaric acid. Its concentration tended to decrease during ripening, resulting on a reduction of 89% between the first (D1) and the last (D3) harvest dates.
Regarding secoiridoids, oleuropein aglycone, ligstroside aglycone, and their derivatives were the main secoiridoids quantified in Azeradj EVOOs. The trend of these compounds and their derivatives is linked to their precursors (phenolic alcohols and elenolic acid derivatives) as well as the activity of some enzymes over the ripening and extraction step in the olive oil production process. Analyzing the results for EVOOs at different harvest dates, we found that the decrease in decarboxymethyl oleuropein aglycone and decarboxymethyl ligstroside aglycone content during ripening was accompanied by an increase on their hydroxylated forms. These results could be explained by the rise in the activity of polyphenol oxidase at more advanced ripening stages, previously reported in the literature 29. It should be taken into account that these compounds could also be produced during the olive-oil extraction process (crushing and malaxation steps), which may change their concentration in the final product (olive oil) 30. Oleuropein aglycone and ligstroside aglycone are the results of oleuropein and ligstroside hydrolysis produced by the enzyme β-glucosidase in the olive fruits during ripening. No significant variation in their content was found among the harvest dates under study, results that could be explained by the equilibrium between the anabolic and catabolic pathways of oleuropein and ligstroside synthesis according to the cycle proposed in a previous study 11. Elenolic acid and its decarboxymethylated form also declined during ripening. Indeed, their lowest concentration was found in EVOOs belonging to the last harvest date (D3). The decline in elenolic acid content could be attributed to the depressed hydrolytic reaction of oleoside-11-methyl ester catalyzed by the enzyme β-glucosidase 11. Finally, the trend observed in decarboxymethylated form of elenolic acid in EVOO from the last harvest date (D3) may be explained by the decrease in its precursors such as decarboxymethyl oleuropein aglycone and elenolic acid during ripening.
In terms of lignan concentrations, pinoresinol and syringaresinol increased significantly during the early harvest dates. Indeed, the highest concentration of both compounds was recorded in EVOOs from the second harvest date (D2). Nevertheless, the concentration decreased significantly at more advanced ripening stages. It should be taken into consideration that syringaresinol was not quantified in EVOOs from the last harvest date (D3), because its concentration was between the detection and quantification limits 17. Finally, flavones presented by luteolin and apigenin showed the same trend as pinoresinol and syringaresinol during ripening. These results are consistent with the changes found previously in lignans and flavones during ripening 8.
3.6 Total phenols
In this study, the total phenols shown in Table 3 were determined by adding together the individual concentrations of each phenolic compound from different phenolic families in Azeradj EVOOs samples identified using HPLC-ESI-TOF/MS. During ripening, the total phenol content decreased from 222 mg kg−1 in EVOO from the first harvest date (D1), to reach 196 mg kg−1 and 176 mg kg−1 in EVOOs from the second (D2) and the last (D3) harvest dates, respectively. This trend in total phenol content during ripening agrees with previously reported data 8. As a result of the decreasing on total phenols in EVOO from olives harvested later (D2 and D3), nutritional and sensorial quality of the oil could be affected.
3.7 Oxidative stability
Although it is not considered a standard parameter of quality, oxidative stability provides useful information on olive-oil shelf life. It reveals the beginning of the oxidation process characterized by free-radical reactions. Several authors have reported a clear correlation among oxidative stability and fatty acid composition, phenolic compounds, and pigments 24, 31. Analyzing the results for this parameter, we found that oxidative stability reached its highest value in EVOOs belonging to the first harvest date (32, D1). Despite the significant decrease on MUFA:PUFA ratio, total phenols and pigment content found between the first and the second harvest dates (D1 and D2), the oxidative stability value did not significantly change and even remained constant (Table 3). This trend in oxidative stability could be explained by the behavior of some individual phenolic compounds during ripening. As shown in Table 3, the decrease in hydroxytyrosol in EVOO corresponding to the second harvest date was accompanied by a greater lignan and flavone content such as syringaresinol, pinoresinol, apeginin, and luteolin. This later showed antioxidant activity similar to that of hydoroxytyrosol previously reported in the literature 32, which may compensate for the loss in hydroxytyrosol. In addition, oleuropein aglycone is known to be a strong antioxidant in olive oil 33, and its content did not vary significantly between EVOOs from the first and second harvest dates. Finally, a sharp decrease (51%) in oxidative stability was found between the second and the last harvest dates (D2 and D3). This behavior could be explained by a general decline in all phenolic groups together with pigments, and MUFA:PUFA ratio, responsible for maintaining of olive-oil oxidative stability.
4 Conclusions
Changes in the chemical composition of Azeradj EVOOs were found during olive ripening. The increase in the maturity index was accompanied by an increase in some quality parameters such as free fatty acids, peroxide values, and K232. However, these values were well within the legal limits for the EVOO category. In addition, the decrease on the MUFA:PUFA ratio, pigments and polyphenols, diminished the oxidative stability of Azeradj EVOOs at advanced ripening stages corresponding to the last harvest date (D3). The current data can be considered useful for determining the ideal harvest period for olives used to produce oil. From the analytical results of this work, early harvesting produces Azeradj EVOO with excellent chemical characteristics. Moreover, HPLC-ESI-TOF/MS was successfully employed for the first time in the characterization of Azeradj phenolic profile, which will be available to all those researchers involved in EVOO chemical characterization.
We are grateful to the Spanish Ministry of Education and Science (AGL2011-29857-C03-02), the Andalusia Regional Government Council of Innovation and Science (P07-AGR-02619, P09-CTS-4564, and FQM-6563), to the University of Granada, Functional Food Research and Development Center, Department of Agronomy, University of Tizi-Ouzou (Algeria) and to the International Olive Council (IOC).
The authors have declared no conflict of interest.