A simple method for the separation and quantification of neutral lipid species using GC-MS
Abstract
A simple gas chromatography-mass spectrometry (GC-MS) method has been developed for the determination of neutral lipids in yeast. This method was compared to the conventional thin-layer chromatography (TLC) method used in our laboratory. The new method enabled the measurement of molecular species of diacylglycerols, triacylglycerols, and sterol esters (SE). With a classic lipid extraction, samples can be injected directly into the GC-MS without any previous derivatization procedure. However, the main characteristic of this new method is its versatility because GC parameters can be modified based on the biological samples analyzed: volume and injection modes, derivatization of samples, etc. In order to validate the method, yeast lipid extracts from two distinct culture growth conditions were compared, the first in presence of oxygen and the second in its absence. Although the lipid profile of both yeast samples is qualitatively similar, the use of the GC-MS method rather than the TLC method enables the identification of a sterol, neoergosterol, in yeast cells grown in absence of oxygen. Moreover, this method enables phospholipid detection in samples but their identification is difficult.
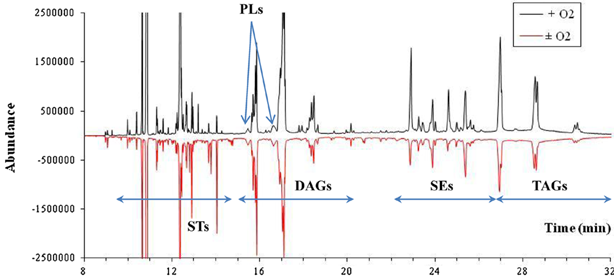
GC-MS total ion chromatogram of full chromatogram of yeast lipid extracts (positive values represent cells grown in the presence of oxygen while negative values represent cells grown without oxygen). STs: sterols; PLs: phospholipids; DAGs: diglycerides; SEs: sterol esters; TAGs: triglycerides.
Abbreviations
-
- DAG
-
- diacylglycerols
-
- ERG
-
- ergosterol
-
- GC-MS
-
- gas chromatography-mass spectrometry
-
- HPLC
-
- high pressure liquid chromatography
-
- LST
-
- lanosterol
-
- MTBE
-
- methyl tert butyl ether
-
- PA
-
- phosphatidic acid
-
- PC
-
- phosphatidylcholine
-
- PE
-
- phosphatidylethanolamine
-
- PG
-
- phosphatidylglycerol
-
- SE
-
- sterol esters
-
- SQ
-
- squalene
-
- TAG
-
- triacylglycerols
-
- TLC
-
- thin-layer chromatography
1 Introduction
Nowadays, the fields of study belonging to the group known as ‘omics’, such as transcriptomics, proteomics, metabolomics, and lipidomics, play a key role in improving the background knowledge of prokaryotic and eukaryotic cells. These tools often require sophisticated devices with qualified operators. The recent rapid growth of lipidomics can mainly be attributed to technological advances in mass spectrometry. The development of soft ionization techniques, in combination with computational tools, has spurred the subsequent development of various methods for lipid analysis 1. For small laboratories, suitable techniques for the separation and determination of neutral lipids include thin-layer chromatography (TLC), high pressure liquid chromatography (HPLC), and gas chromatography (GC) with a flame ionization detector (FID) or mass spectrometry detector (MSD).
For the separation and detection of neutral lipids, TLC is a suitable technique because the equipment used is very simple 2. However, the procedure is generally time-consuming and does not determine molecular species of diacylglycerols (DAG), triacylglycerols (TAG), and intermediates of sterol biosynthesis. HPLC with UV/fluorescence 3, 4 or evaporative light scattering (ELS) detection 5, with or without suitable derivatization beforehand, has been also used to quantify neutral lipids. Similarly to TLC methods, separation and resolution of molecular species by HPLC are very difficult to accomplish. Furthermore, HPLC techniques consume high levels of solvents which generate certain solvent recycling problems in small laboratories. Meanwhile, GC with FID or preferably MSD is a very suitable technique for the separation, identification, and determination of different molecules from biological samples. In addition, GC does not involve the same drawbacks as TLC and HPLC techniques 6.
For all of the above reasons, a new method for GC-MS was developed in the present work. Although a few methods exist for profiling yeast lipid content, the devices for these analyses, such as ESI-MS, MALDI-MS, APCI-MS, and so on 7-10, are generally inaccessible in normal laboratories for routine research due to their cost and complexity.
However, lipidomic profiling of yeast covers lipid species which constitute cell membranes and others which store metabolic energy and act as bioactive molecules. Although the genome, transcriptome, and proteome of several eukaryotic model organisms have been described, lipidomes remain relatively uncharacterized 10. Lipids are of huge importance due to the role they play. For instance, the phospholipid bilayer is the first barrier that yeast has in order to protect itself from environmental changes. In addition, some lipids have other vital signalling functions for yeast cells 11, 12.
Saccharomyces cerevisiae is a powerful model for studying lipidomics in eukaryotic cells as it has a relatively simple network of lipid metabolic pathways. The ease with which deletion mutants can be made in S. cerevisiae has facilitated studies of the function of specific lipids and lipid metabolites 13. Unfortunately, results of these studies can sometimes be difficult to interpret. The lipid composition of yeast cells is modulated by experimental growth conditions. For instance, S. cerevisiae synthesizes more sterol and unsaturated fatty acids in the presence of oxygen than in its absence 14. Moreover, in hypoxic conditions, this yeast produces medium-chain fatty acids (C6–C12) 15, that are toxic to itself 16, and long-chain saturated fatty acids, as well as accumulating squalene and lanosterol.
The aim of this work was to optimize a GC-MS method to cover major yeast lipids in a single run by using a very simple lipid extract protocol. In order to validate the method, yeast grown under two different conditions (in the presence or absence of oxygen) were evaluated.
2 Material and methods
2.1 Reagents
The following lipid standards were purchased from Sigma-Aldrich (ref, USA): squalene (SQ), α-cholestane (IS), cholesterol (CHL), dihydrocholesterol (DiCHL), ergosterol (ERG), stigmasterol (STIG), β-sitosterol (SITO), lanosterol (LST), cholesterol palmitate (ChlC16), cholesterol margarate (ChlC17), cholesterol oleate (ChlC18:1), 1-monooleyl-rac-glycerol (C18:1 MAG), 1,3-dioleyl-rac-glycerol (C18:1 DAG), glyceryl trioctanoate (C8 TAG), glyceryl tridecanoate (C10 TAG), glyceryl tridodecanoate (C12 TAG), glyceryl tritetradecanoate (C14 TAG), glyceryl trihexadecanoate (C16 TAG), glyceryl trioleate (C18:1 TAG), glyceryl trilinoleate (C18:2 TAG), stearyl stearate (C18-C18), phosphatidic acid (PA), phosphatidylcholine (PC), phosphatidylethanolamine (PE), and phosphatidylglycerol (PG). All lipid standards were of a purity >95% and were dissolved in chloroform-methanol (2:1, v/v). All solvents (chloroform, methanol, hexane, methyl tert butyl ether (MTBE), glacial acetic acid) were Chromasolv grade and purchased from Panreac (Barcelona, Spain).
2.2 Strains and culture medium
The strain used in the present paper is a commercial wine strain (S. cerevisiae 1118, Lallemand S.A., Canada). The yeast was presented as ADY (active dry yeast) which was rehydrated for 30 min in deionized water at 37 °C in line with the manufacturer's instructions. The culture growth medium was YEPD w/v, (1% Yeast Extract, 2% Peptone, 2% Dextrose, Cultimed, Barcelona, Spain). Yeast cultures were carried out in the presence of oxygen (+O2) with an agitation of 150 rpm or without oxygen (-O2) in a static heater overnight, both at 28 °C.
2.3 Lipids extraction from yeast cells
Yeast cells were harvested in early stationary growth phase to obtain around 2 × 10⁸ cells/mL (10–15 mg of Dry Weight). Lipid extraction was performed following the protocol described by Redón et al. 17. To summarize, 20 µL of EDTA, 100 µL of cold methanol, and 1 g of glass beads (0.5 mm, Biospec Products, Qiagen) were added to the cell pellet in an Eppendorf tube and then mixed for 5 min with an interval in ice of 1 min in a mini-bead-beater-8 (Biospec Products). Four successive extractions were then carried out with chloroform-methanol v/v, (2:1), (2:1), (1:1), and (1:2), respectively. All fractions were collected and then washed twice with KCl (0.88% w/v) in deionized water. The volume used to clarify the sample had to be a quarter of the organic solvent volume. After the recuperation of the organic phase, extracts were evaporated under nitrogen. Extract samples were suspended with chloroform-methanol (2:1, v/v) and collected in a glass insert, which was put into a vial to be analyzed by either TLC or GC-MS.
2.4 Thin-layer chromatography (TLC) procedure
Yeast neutral lipids (NL) were separated and quantified by one-dimensional TLC on silica gel 60F254 plates (10 × 20 cm, 250 μm) (Merck, Germany), as described by Redón et al. 17. The plate application of samples and lipid standards was carried out with a semi-automatic injector (Linomat 5, Camag, Switzerland). Three successive migrations were conducted with an automatic developing chamber (ADC2, Camag): (i) the first step with hexane (5 mL), MTBE (5 mL), and glacial acetic acid (0.2 mL); (ii) the second with hexane (8 mL), MTBE (2 mL), and glacial acetic acid (0.1 mL); and (iii) the third with hexane (10 mL). The timing of the three steps was 35 min, 60 min, and 80 min, respectively. The plate was dried for 15 min between each migration step. Visualization was achieved by spraying with 10% w/v copper sulphate in 3% v/v of phosphoric acid and heating for 15 min at 150 °C on a TLC Plate Heater (Camag). The neutral lipids were identified by comparison with a lipid standard solution spotted at different concentrations on the plate. The plate with identified spots was acquired with an Image Scanner (Amersham Biosciences). Each spot of the image was quantified in terms of integrated optical densities (IOD) with ImageJ software (a public domain, Java-based image processing program developed at the National Institute of Health). Calibration curves were constructed by plotting the IOD of the lipid standard against the amount of lipid loaded.
2.5 Gas chromatography mass spectrometry (GC-MS) procedure
GC was performed on a DB-5HT fused silica capillary column (30 m × 0.32 mm i.d., 0.1 μm film thickness) using a 6890N Agilent (Agilent Technologies, Germany) instrument fitted with a mass spectrometry detector (5975 Agilent). Using an autosampler (7683 Agilent), samples or standards (from 1 to 3 μL) were injected in pulsed split mode (80 psi, 0.20 min) at the split ratio of 2:1. The injector temperature was 320 °C. The column oven temperature was initially held at 150 °C for 1 min and then increased firstly to 320 °C at the rate of 15 °C/min and subsequently to 380 °C at the rate of 4 °C/min, where it was held for 8 min. Helium was used at the carrier gas at a constant flow of 1.0 mL/min (average velocity of 38 cm/s). The MSD transfer temperature was 350 °C. The MS quadrupole and source temperature were maintained at 150 °C and 280 °C, respectively. The MS acquired data in the electronic ionization (EI) scan mode at 70 eV for the range of 60–900 amu after a solvent delay of 3 min. Post-run analysis was performed with the Agilent MSD Chemstation.
3 Results and discussion
3.1 TLC analysis
Figure 1 shows a traditional TLC development used in our laboratory. From the bottom to the top of the plate, the correct separation of all neutral lipid classes from external standards and yeast samples were observed as follows: ergosterol (ERG, 1), diacylglycerides (DAG, 2), lanosterol (LST, 3) free fatty acids (4), triacylglycerides (TAG, 5), fatty acid ethyl esters (6), sterol esters (SE, 7), and squalene (SQ, 8). The phospholipids (0 in Fig. 1) did not migrate in the solvent system used. To calculate the lipid content of samples, applications on the plate of different concentrations of neutral lipids were performed. After scanning the sprayed plate with copper sulphate, standard curves were carried out to determine the lipid content of samples. Although all steps were optimized with semi-automated application of samples, a semi-automatic developing chamber, spraying, heating, and scanning of plates, the method was not suitable for the identification of molecular species of some neutral lipids. However, it should be noted that the quantification of each lipid class is generally accurate and reproducible as observed in Table 1 by the correlation coefficient (R2) calculated from the average of five independent plates. The major drawback of this TLC method was the lack of information regarding some neutral lipid molecular species. Nevertheless, our TLC method gave a detection limit of ca 0.5 µg on plate for almost all of the neutral lipids studied in our experimental conditions. However, this detection limit could be decreased by the use of a fluorochrome reagent.

With respect to the yeast samples, as expected, cells grown in the presence of oxygen had more ergosterol, SE, and TAG than cells grown in its absence 18. In the latter case, more squalene and lanosterol was accumulated. While most neutral lipids could easily be detected on plate using the copper sulphate reagent, this was not, however, the case of some metabolites which had a certain degree of unsaturation, such as unsaturated fatty acids, DAG or TAG. It should be noted that the accurate quantification of these molecules by TLC was good but not optimal. For this reason, the use of TLC remained limited with respect to the absolute quantification of these molecules.
3.2 GC-MS analysis
With respect to the GC-MS method, Figure 2A shows a global chromatogram of the neutral lipid separation. Although it was decided only to point out the separation of major neutral lipids, such as sterols, DAG, SE, and TAG, during the first 8 min of the analysis, it was also possible to detect free and esterified fatty acids and monoacylglycerides (MAG). The initial time of analysis was determined to ensure the possible detection of medium-chain fatty acids which were produced under hypoxic conditions by the yeast.

By examining some parts of the GC analysis, neutral lipid classes had specific zones in which elution took place. In Figure 2B (time 8–14 min, zone x in Fig. 2A), SQ, CHL, ERG, STIG, SITO, and LST were detected. Although some of these sterols were not present in yeast cells, the ability to separate other sterols that are present in human or plant cells was useful for showing the versatility of the method. Between 14 and 32 min, fatty acids that had esterified between each other, DAG and phospholipids (zone y in Fig. 2A), and SE and TAG (zone z in Fig. 2A) could be detected (Fig. 2C). This part of chromatogram was very complex and basically depended on the nature of the fatty acid which esterified the lipid. With the column used that is characteristic of this method, unsaturated fatty acid eluted before the saturated version with the same number of carbon atoms. Similarly, longer fatty acids eluted after shorter ones.
Interestingly enough, it was possible to detect phospholipids on the chromatogram, specifically in zone y (see Fig. 2A and Fig. 3). Separated injections of phospholipid standards such as PA, PC, PE, and PG, all containing oleic acid as the esterified fatty acid in its moiety, indicated that not only could they be detected but also retention times were different according to their polar head. Thus it would be conceivable to quantify the phospholipid content of lipid extracts on the same chromatogram as neutral lipids without any derivatization procedure. With the same fatty acid composition, anionic phospholipids (PA and PG) eluted before zwitterionic phospholipids (PC and PE). It was also interesting to note that PC and PE eluted just before C18:1 DAG. The presence of a phosphate group and a simple organic molecule, such as choline or ethanolamine, with respect to the native DAG did not substantially modify the retention times but it was surprising to observe that both phospholipids had two peaks. This was also true for PG and, to a lesser extent, for PA.

The GC responses shown in Fig. 2 were for column loadings of approximately 0.5–0.7 μg each lipid. The GC-MSD detection limits calculated for the main neutral lipids used in the TLC method (SQ, ERG, LST, DAG, SE, and TAG) were in the range of 0.1–0.2 μg for 1 or 2 μL injections (nine determinations). Although this detection limit was low, the precision of measurement (RSD) was low for each compound. For instance, the precision was 49% for squalene at 0.1 μg loaded on the column and in the range of 20–50% for 0.2 μg loaded (results not shown). Only at 0.3 μg did the RSD improve, registering in the range of 5–13% for each neutral lipid used as a reference (SQ, ERG, LST, DAG, SE, and TAG). As observed in Table 1, the regression coefficients obtained for each standard were good and the GC-MSD responses were linear for a range of 0.1–3 μg.
| Neutral lipid | TLC | GS-MS | Slopeb |
|---|---|---|---|
| Power regressiona | Linear regressionb | ||
| Squalene | 0.978 | 0.973 | 2.56 108 |
| Ergosterol | 0.959 | 0.973 | 6.43 107 |
| Lanosterol | 0.965 | 0.985 | 1.60 108 |
| C18:1 DAG | 0.982 | 0.969 | 1.71 108 |
| Cholesteryl oleate | 0.969 | 0.958 | 2.22 107 |
| C18:1 TAG | 0.982 | 0.978 | 4.38 107 |
- a Average of 5 independent TLC plates based on application volumes in the range of 0.5-5 μg.
- b Calculated from 43 column loadings in the range of 0.1-3 μg.
3.3 Comparison of TLC and GC-MS methods with yeast samples
From a conventional lipid extraction, TLC methods were successfully used for lipidome profiling for age. As with most existing methods, TLC does not permit the evaluation of the lipid content (neutral lipids and phospholipids) of biological samples in a single run (i.e., on the same migration plate). Nevertheless, under our laboratory conditions, TLC is now considered to be a good method for the rapid determination of lipid contents of yeast. As observed in Table 2, the lipid composition of yeast cells that had been grown under two different sets of conditions was determined from the use of external standards in the same migration run. The results observed were as expected in terms of the lower content in ERG, SE, and TAG in cells growing in the absence of oxygen, while SQ and LST were accumulated in these cells 17, 18.
Meanwhile, the same lipid yeast extracts (3 μL loaded on the column) were analyzed by GC-MS (Fig. 4). The positive abundance shown on the graph refer to the sample obtained from cells grown in the presence of oxygen while the negative values of abundance represent the lipid extract of cells grown in the absence of oxygen. Three differentiated zones can be described (fatty acid elution on the column was not shown) as follows: (i) the first zone (x) corresponded to detection of SQ and sterol intermediates (see also Fig. 4B); (ii) the second zone (y), where fatty acids esterified between each other, DAG and phospholipids were found (see also Fig. 4C); and (iii) the last zone (z), where SE and TAG were detected (see Fig. 4D).

According to the results shown in Table 2 for both cell lipid extracts, lower contents of SQ and LST were found, while ERG, SE, and TAG levels obtained by GC-MS were higher than those obtained by TLC. This outcome highlighted two features: (i) the levels of SQ and LST found by GC-MS were always lower than those obtained by TLC and (ii) those in ERG, SE, and TAG were increased. For SQ, ERG, and LST contents, one explanation may be due to better sensitivity in the detection of these molecules by GC-MS, which led to a more accurate quantification. However, the higher levels detected for LST by TLC could surely be due to a common migration of structurally neighboring molecules, such as intermediates of sterol biosynthesis. Meanwhile, in terms of SE and TAG contents, it should be noted that SE levels obtained by GC-MS for cells grown with or without oxygen respectively, were two- and three-fold higher than those determined by TLC. These results may be explained by (i) higher accuracy in the detection of these molecules by GC-MS and (ii) a lack of information for cells grown in the absence of oxygen. Indeed, yeast produces more saturated than unsaturated fatty acids under these conditions that are likely not to be detected by TLC analysis, or only slightly so. Further work was needed to clarify whether the spots detected by TLC corresponded to peaks identified as SE by GC-MS. The same was true in the case of TAG.
As regards the detection and identification of intermediates in the sterol biosynthesis, the GC-MS method was undoubtedly a remarkable advance (Table 3). While with TLC, only ERG and LST were detected, more than ten intermediates of sterol biosynthesis were identified by GC-MS. Observing the results in Table 3, intermediates were present in both yeast cell extracts. Interestingly enough, the identification of two intermediates, neoergosterol 19, 20, and ergosta-5, 8-dien-3-ol, only occurred in cells grown in the absence of oxygen. Although the matching of sample peaks with the reference peak (NIST05 library) were 99 and 95% respectively, it would be useful to confirm the mass patterns of these molecules using mutant strains of wine yeast. Indeed, according to the literature 21, some of intermediates were found and there was ERG, ergosta-7-en-3-ol, LST, and cholesta-8, 14-dien-3-ol-4, 4-dimethyl. Comparison between our results with those mentioned above proved to be extremely difficult because of the differences between yeasts, with a laboratory strain as opposed to a wine yeast strain. For instance, confirmation of these results may be performed using derivatization by the way of TMS-derivative formation and/or combining with NMR techniques to analyze spectra.
| RT | Identification | Purity (%) | Mass fragmentation patterns |
|---|---|---|---|
| 12.179 | Arthroergosta-5, 7, 9, 22-tetraen-3-ol | 84 | 251, 341, 361, 376, 394, 429 |
| 12.225 | Ergosta-5, 8, 22-trien-3-ol | 83 | 363, 396, 253, 271, 337 |
| 12.346 | Ergosterol | 96 | 363, 396, 253, 337, 271 |
| 12.410 | 5, 6-dihydroergosterol | 90 | 271, 255, 383 = 398, 213, 300 |
| 12.420 | Ergosta-7, 22-dien-3-ol | 97 | 271, 255, 398, 229, 246, 383 |
| 12.447 | Neoergosterola | 99 | 237, 380, 213, 183, 195, 253 |
| 12.503 | Cholesta-8, 24-dien-3-ol-4-methyl | 90 | 383, 398, 227, 285, 247 |
| 12.605 | Ergosta-5, 8-dien-3-ola | 83 | 365, 398, 339, 380, 271, 255 |
| 12.642 | Cholesta-5, 24-dien-3-ol | 52 | 271, 365, 314, 383, 398, 300 |
| 12.669 | Ergosta-7-en-3-ol | 95 | 255, 400, 229, 213, 392, 271 |
| 12.901 | Lanosterol | 86 | 411, 426, 393, 259 |
| 12.956 | Cholesta-8, 14-dien-3-ol-4, 4-dimethyl | 90 | 412, 379, 397, 299, 285 = 351 |
- a Only found in cells grown in absence of oxygen.
4 Conclusions
The proposed method for the separation and quantification of neutral lipids in yeast using GC-MS is very simple and suitable for small laboratories. It is designed to be used routinely for any kind of extracts, such as human, plant, or microbial cells, from conventional lipid extraction. It is also a flexible method which enables researchers to change gas chromatographic parameters when necessary. In other words, the injection mode can be changed and oven temperature conditions can be modified depending on the purpose of lipid class studied. Furthermore, one internal standard (α-cholestane, cholesterol margarate, for example) or more can be added before or after the lipid extraction to improve the quantification. With respect to TLC analysis, the GC-MS method is suitable for simple separation and identification of molecular species of MAG, DAG, TAG, intermediates of sterol pathway, and SE in a single injection. Although this method seems to have potential, additional work is necessary, especially for identifying the intermediates of sterol biosynthesis and all of the molecular species produced by S. cerevisiae. In addition, it is also clear that the method must be validated with more precision, particularly in terms of the metabolites for which there are no standards.
This work was financially supported by the grants from the Spanish Government project AGL2010-22001-C02-02 awarded to NR. In addition, AB wants to thank Rovira i Virgili University for her doctoral fellowship 2009BRDI/12/13.
The authors have declared no conflict of interest.