The two- and three-dimensional response spectra: Orientation-independent intensity measures more suitable for seismic structural design
Abstract
This paper presents two physics-based, orientation-independent intensity measures that truly captures the three-dimensional motion of an orthogonal array of accelerometers and are more appropriate for seismic structural design. This is achieved by processing all three components of the record simultaneously, rather than simply combining the results of processing each component in isolation. Compared to other commonly accepted orientation-independent intensity measures, it was found that horizontal seismic demand may be systematically underestimated by as much as 29% in the worst-case scenario. In addition, these new measures are much more computationally efficient than the current ones, as they reduce the number of response spectra calculations per seismic record to just 2 or 3, depending on the measure. Thus, the orientation-independent intensity measures introduced here optimize the processing of seismic records and may help to reduce the uncertainty of the estimation of the seismic acceleration for structural design.
1 INTRODUCTION
Currently, the design seismic acceleration for a structure is derived from a probabilistic seismic hazard analysis (PSHA), fed from the seismic records. These records are used to determine the so-called ground motion prediction models (GMPM), which are equations that statistically relate the spectral acceleration, or some other intensity measure (IM), to the distance from the seismogenic source to the site and the characteristics of the earthquake, such as its magnitude and type of fault, just to name a few.
Although seismic hazard analyses can be performed using more than one IM,1 almost all use only one. Thus, since seismic motion is inherently three-dimensional, the way the three components of the record are reduced to a single-valued IM has remained subjective, often obfuscated by pure statistics. On top of this, the complexity of this task is increased as many of the possible combinations change value with reference frame.
In this regard, the determination of orientation-independent intensity measures (OI-IM) is a problem that has received much attention in the past. For example, Penzien and Watabe2 found that, for each earthquake, there are three main directions associated with the eigenvalues and eigenvectors of the motion covariance matrix. Although some authors have tried to develop GMPMs with this idea,1, 3, 4 it is evident that these directions depend on time, as well as on the proximity and orientation to the seismogenic source. Therefore, they are seldom used to predict seismic motion.5
Rather, during the development of single-valued GMPMs, it is common during record processing to first discard the vertical component, then compute separately the maximum response of each horizontal component, and finally combine this pair by: (1) using the largest response for each period; (2) by neglecting the component with the smallest response and considering only the one with the maximum response; or (3) by using the geometric mean of both components.
Although there are more ways to combine the horizontal responses,3, 6 the geometric mean has predominated because it reduces variability in the determination of GMPMs.7 The latter is, in fact, an expected behavior of this type of mean, since the geometric mean of a data set is the antilogarithm of the arithmetic mean of the logarithm of the data. Thus, since the large variability associated with seismic motion is reduced in logarithmic space, the geometric mean will always be the least variable of all possible means.
However, as the magnitude of each horizontal component of the motion varies with reference frame, then so does the geometric mean and every other conceivable statistical combination. To address this, Boore et al.7 suggested repeating the procedure of calculating and combining responses in all possible directions, and then taking a certain percentile of the response associated with each period. That is, they propose to consider the most likely mean response (depending on the selected percentile) for an arbitrary reference frame. They named this measure GMRotDpp because: (1) it uses the geometric mean (GM) to combine the maximum horizontal responses; (2) it is rotation independent (Rot), but period dependent (D); and (3) it corresponds to a certain percentile (pp).
Because GMRotDpp has built-in limitations, for example, that it always predicts less motion than the recorded in each component, several authors have proposed alternative measures. For example, Boore8 suggests calculating the motion response in each possible direction (azimuth) and then taking the one associated with a certain percentile of the responses associated with each period. This IM is similar to GMRotDpp and is known as RotDpp, as it omits the use of geometric means. By definition, RotDpp represents the most likely response (according to the selected pp) in an arbitrary (or random) direction of analysis.
More recently, Pinzon et al.9 and then Poulos and Miranda10 also noted that any GMPM developed using the GMRotDpp as the baseline IM will always yield an average response, even if the 100th percentile is taken. Therefore, to avoid cases where motion prediction produces unsafe designs, these authors suggest modifying the GMRotDpp algorithm to take the maximum of the two components instead of the geometric mean. The former authors call this measure LRotDpp, while the latter call it MaxRotDpp. Here it is designated L/MaxRotDpp to credit all authors.
Like the above, there are more proposals for OI-IMs,5, 11, 12 but they all suffer from the fact that: on the one hand, they take as true the premise of GMRotDpp, in which the average response in an arbitrary direction is adequate for the design of a structure; and, on the other hand, that they are computationally demanding because they repeat the response spectra calculations for all possible directions.
Therefore, this paper reviews the generation of OI-IMs for the development of GMPMs, without losing sight of the physical phenomenon and the ultimate goal of PSHA, which is to determine an adequate acceleration for the design of a structure.
1.1 Objective of the study
This paper aims to improve the estimation of the seismic demand of structures by establishing a theoretically rigorous OI-IM that is compatible with the usual workflow of structural design.
1.2 Scope of the study
In this study, two OI-IMs called the two- and three-dimensional response spectrum, 2D Resp and 3D Resp, are established based on the determination of the maximum response of a single-degree-of-freedom system subjected to a two- and three-dimensional excitation, respectively.
2 THE ONE-DIMENSIONAL RESPONSE SPECTRUM (1D RESP)
While the definition of the response spectrum is unbounded in terms of excitation dimensions, both Housner's13 original proposal and current practice have limited this idea to a single dimension. Therefore, in this paper it will be referred to as the one-dimensional response spectrum (1D Resp) to differentiate it from its generalization to three dimensions (see Section 5).
3 CURRENT ORIENTATION-INDEPENDENT INTENSITY MEASURES (OI-IMS)
- 1.
Calculate the response of the SDOFS for the horizontal orthogonal components of the measured signal and .
- 2.
Determine the response and in a reference frame rotated an angle with the positive direction of the -axis (see Figure 1):
()() - 3.
Find the absolute maximum response in each component of the rotated reference frame and .
- 4.
Combine the absolute maximum responses into a single , using the geometric mean:
() - 5.
Repeat steps 2 to 4 until the range 0° ≤ ≤ 90° is covered with enough points.
- 6.
Order the maximum mean responses from lowest to highest and select that value corresponding to the selected percentile pp.
- 7.
Repeat steps 2 to 6 for the next SDOFS until the desired range of periods is covered.
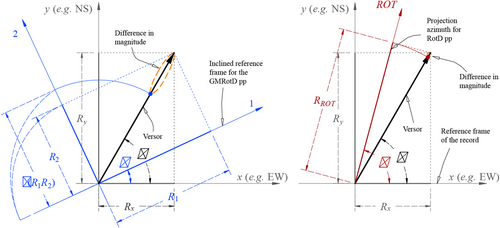
Observe that, in step 4 the geometric mean may be exchanged by: (1) the maximum of the two components to calculate the IM called LRotDpp or MaxRotDpp, depending on the author9, 10; (2) the root of the sum of squares12; or (3) by any other imaginable statistical combination. Also note that despite selecting the 100% percentile, that is, the maximum, an average response is still obtained due to the combination of responses in step 4.
- 1.
Calculate the response of the SDOFS for the horizontal orthogonal components of the measured signal and .
- 2.
Determine the projection of the response at an azimuth inclined an angle with the positive direction of the -axis (see Figure 1):
() - 3.
Find the absolute maximum response at the inclined azimuth:
() - 4.
Repeat steps 2 to 3 until the range 0° ≤ ≤ 180° is covered with sufficient points.
- 5.
Order from lowest to highest the maximum responses for each and select the value corresponding to the selected percentile pp.
- 6.
Repeat steps 2 to 5 for the next SDOFS until the desired range of periods is covered.
Note that, by definition: (1) the GMRotD100 and RotD50 are equal because = and the maximum (pp = 100) of is equal to the median (pp = 5) of ; and (2) that the L/MaxRotD100 and RotD100 are also equal.10 This relationship between the projections used during the calculation of both GMRotDpp and RotDpp is shown in Figure 1. Observe again that even if the 100% percentile is selected, the largest maximum response in one direction will be obtained, but the response in the perpendicular direction will be totally disregarded.
4 LIMITATIONS OF CURRENT ONE-DIMENSIONAL OI-IM
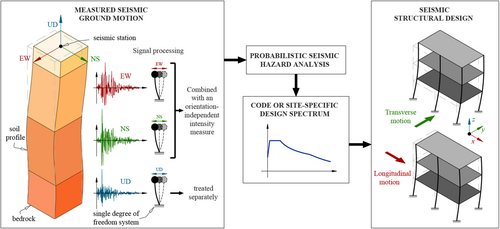
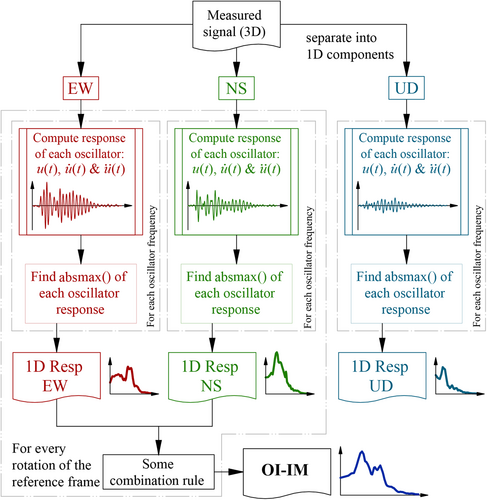
In contrast to the premise underlying the development of the above OI-IMs, this paper states that an OI-IM suitable for use in the current seismic design workflow, outlined in Figure 2, must capture the true magnitude of the recorded ground motion. Otherwise, even using GMPMs with perfect predictive ability and developing a very accurate PSHA would still result in an erroneous estimate of ground motion at the site. In other words, GMPMs and PSHA only transport the OI-IM from source to site, with all its limitations.
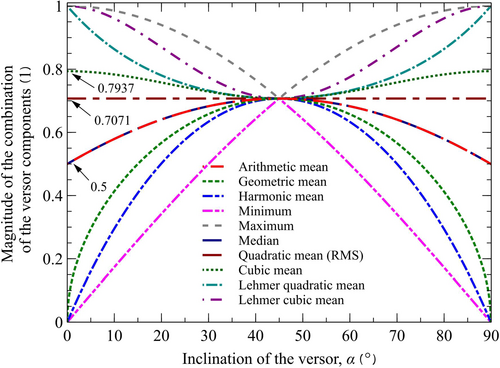
Under this rationale, the above OI-IMs are incapable of capturing the magnitude of the seismic ground motion. This is simply because any statistical combination (e.g., maxima, minima, all types of means, etc.) can only generate values within the range of magnitudes studied, which obviously will be less than the true value in the direction of motion. To demonstrate this, consider a versor (unit vector) rotating an angle from the -axis ( = 0°) to coincide with the -axis ( = 90°) (see left-hand side of Figure 1). The magnitude of the versor is conserved during rotation, but its projections on the coordinate axes (1 − cos and 1 − sin ) change with rotation and, consequently, any statistical combination of the components also changes value.
Figure 3 shows the variation of some statistical combinations with the inclination angle of the versor . In this figure, it is found that: (1) none of the means considered returns the real magnitude of the versor and that its value is always smaller; (2) that the quadratic mean is the only one invariant with rotation; (3) that the geometric mean, the harmonic and the minimum are the worst combinations, since they cancel out when the versor rotation coincides with one of the coordinate axes; and (4) that the maximum and the Lehmer means are only exact when is 0 and 90°.
In addition, using the algorithms for the calculation of GMRotDpp, L/MaxRotDpp, and RotDpp in the same rotating versor also proves the ineffectiveness of these measures to capture the true magnitude of the vector. Figure 4 shows the evolution of the normalized value of the , and the with the rotation of the reference frame, as well as the median of each value over the range of inclinations . The latter makes it possible to estimate the mean value of the IM at any inclination and thus to infer, at least qualitatively, its effectiveness in reproducing the real magnitude of the seismic motion. In this figure, it is remarkable that: (1) the GMRotDpp is unable to yield the correct vector value regardless of inclination, as it only reaches a maximum of 1/ (about 70.7%) of the true value when = + π⁄4 and = + 3π⁄4; (2) that the RotDpp only yields the correct vector magnitude for polarized signals (i.e., with motion concentrated in a single direction), in which = ; and (3), that, of the three OI-IMs, the L/MaxRotDpp is the least constrained, returning values closest to the true values (between 70.7% and 100%), in addition to the fact that in this measurement the correct vector value is also recorded when = + π⁄2. It is important to note that the variation of the inclination of the unit vector only produces an offset in the behavior shown in Figure 3.
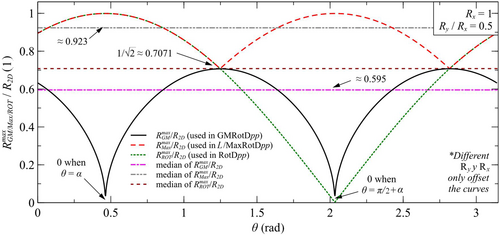
With all the above, it is clear that all the previously described OI-IMs are limited, to a greater or lesser extent, by the way in which they combine the response in each direction. Because of this, they are incapable of describing the complete ground motion, which is three-dimensional in nature. More specifically: GMRotDpp is limited by both combining the responses and by doing so using the geometric mean; while L/MaxRotDpp and RotDpp are limited because the maximum response in just one component of the motion is different from the maximum in three dimensions.
5 THE THREE-DIMENSIONAL RESPONSE SPECTRUM
Closer inspection of Equation (7) shows that the response in one direction (e.g., , or ) depends only on the load in that direction (i.e., , or ). In fact, this independence of the motion in each orthogonal direction is statistically verified by analyzing real seismic records.2 Therefore, each component of the response can be calculated independently using the common methods for calculating the one-dimensional response of an SDOFS.
Equations (8) and (9) also show that since the square root of the sum of the squares of two or three numbers always exceeds the largest of them all, all statistical combinations of the components will yield erroneous values. Equation (9) evidence that: (1) for bi-dimensional motion ( = 0), the actual magnitude of the response can be as large as 1.41 () times that recorded in one of the components (if = ); and (2) that the response is only equal to that of one of the components for polarized signals (where = 0).
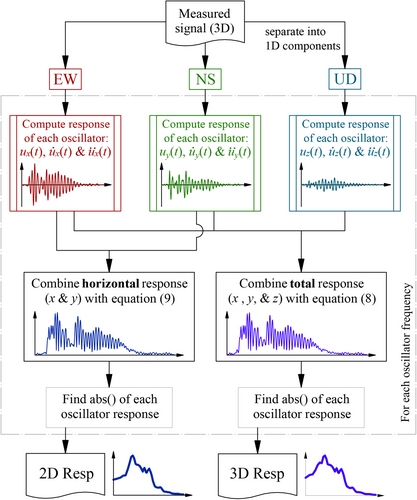
Figure 5 shows the flowchart for the calculation of both 2D Resp and 3D Resp, while Figure 6 shows the flowchart for the process commonly followed in practice to calculate OI-IMs. Note that for 2D Resp and 3D Resp the three signal components are processed simultaneously, the magnitude of the two- or three-dimensional response is obtained from the vector sum of the components, and finally the absolute maximum of this two- or three-dimensional response is determined. Therefore, the difference with the usual process is that the combination of the components is performed before obtaining the absolute maximum for each oscillator period, instead of afterwards. In other words, it is the process of Figure 6 itself that makes the analysis physically meaningless, as it fails to capture maximum ground motion, and that also generates the need to combine the isolated results of each component.
It is worth mentioning that (13) is another type of combination of the maximum responses in each direction, different in nature from the statistical ones, which has been proposed previously.6
Lastly, it should be stated that Huang et al.11 computed a two-dimensional response in an analogous manner to that shown here but introduced an IM independent of both orientation and frequency equal to the maximum response of the SDOFS subject to the two-dimensional acceleration. Incidentally, this measure, referred to as MD for maximum demand, has been incorporated into the NEHRP15 seismic provisions and, according to Stewart et al.,16 it overestimates the seismic demand by 10% to 30%, depending on the period. From the above, it is clear that, since the MD is equal to the peak value of the Resp 2D, then taking this maximum overestimate the response in the other periods.
5.1 Application of 3D/2D Resp to real ground motions
To bring the theoretical comparison between 2D/3D Resp and current OI-IMs to real strong ground motion records, the handful of three-dimensional signals collected in Table 1 were processed. It is worth mentioning that only three ground motion records were processed here, as this section is a proof of concept rather than a comprehensive statistical analysis of the difference between the IMs introduced here and the existing ones.
| Earthquake | Date | Magnitude | Seismic type | Station name/location/site type | Epicentral distance (km) | Peak ground acceleration (g) | Signal duration (s) |
|---|---|---|---|---|---|---|---|
| Michoacán, Mexico | 09/19/1985 | 8.1 Mw | Interplate, Subduction | SCT/Mexico City/Soft clay | 425 | 0.165 EW | 184 |
| 0.096 NS | |||||||
| Puebla-Mexico, Mexico | 09/19/2017 | 7.1 Mw | Intraplate | SCT/Mexico City/Soft clay | 127 | 0.093 EW | 317 |
| 0.092 NS | |||||||
| Loma Prieta, United States | 17/10/1989 | 6.9 Mw | Interplate, Fault | Corralitos/California Soft rock | 7.1 | 0.48 EW | 40 |
| 0.63 NS |
The first two signals, measured at the SCT station during the September 19, 1985, and 2017 earthquakes,17 are widely known in Mexican seismic engineering and were chosen because they allow evaluating the 3D/2D Resp results for interplate and intraplate earthquakes, respectively. The third signal, recorded during the 1989 Loma Prieta earthquake at the Corralitos station,18 also corresponds to a widely recognized earthquake and was chosen because it contains marked directivity effects.
Using a specifically developed code, based on the algorithms stated throughout this paper: (1) the three-dimensional response spectrum 3D Resp; (2) the more useful two-dimensional 2D Resp, both rigorously and approximated; and (3) the GMRotDpp, L/MaxRotDpp and RotDpp for the 50th and 100th percentiles, were computed for each signal. The results are shown in Figures 7-9. It is worth mentioning that the GMRotD100 and L/MaxRotD100 were omitted in these figures as they have the same value as RotD50 and RotD100, respectively.
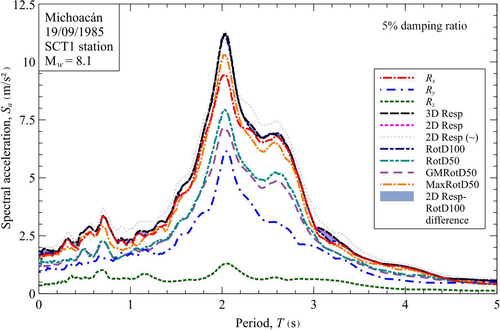
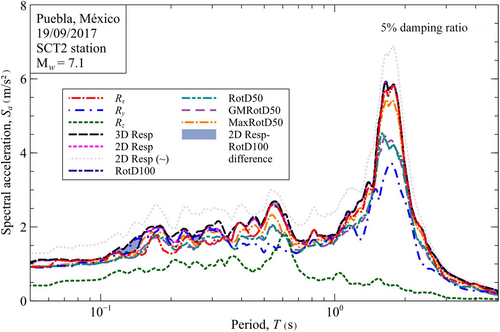
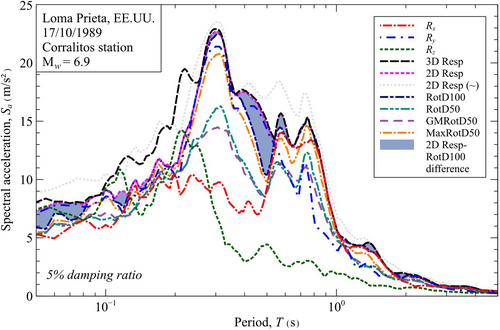
For the signals measured in Mexico City (Figures 7 and 8), the variation between RotD100 and 2D Resp is minimal, only noticeable in the periods away from the maximum. However, for the Loma Prieta earthquake record (Figure 9) there is a marked difference between RotD100 and 2D Resp in a range of periods between 0.35 and 0.70 s (1.43–2.86 Hz). This is because directivity effects result in a quite different response in each direction of analysis ( and ) that GMRotDpp, L/MaxRotDpp and RotDpp are unable to capture using either a single analysis direction or the statistical combination of the two directions. Additionally, it is noted that the two-dimensional response approximated with Equation (12) is only valid for signals with similar frequency contents, where the peak responses occur almost simultaneously.
5.2 Application of 2D Resp to a polarized ground motion
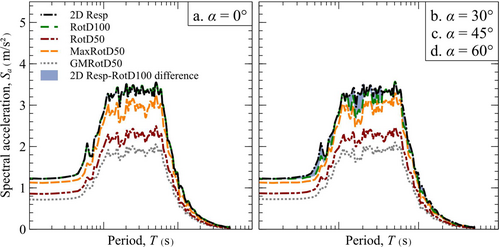
Likewise, to illustrate the differences between 2D Resp and GMRotDpp, L/MaxRotDpp and RotDpp for a polarized seismic motion, an arbitrary synthetic accelerogram was generated and four recording scenarios were simulated by rotating the signal an angle of 0°, 30°, 45°, and 60° with respect to the positive direction of the -axis and projecting the polarized motion on the - and -axis. Subsequently, for each scenario: (1) the 2D Resp; (2) the GMRotD50; the (3) L/MaxRotD50; and (4) the RotDpp for the 50th and 100th percentiles were computed.
The results of this theoretical exercise are shown in Figure 10. In this figure, it is verified that: (1) all measurements are invariant with signal orientation; and (2) that, as predicted earlier (see Figure 4), the RotD100 is only equal to 2D Resp for polarized signals, where the signal orientation coincides with one of the measurement components (). However, the latter should be seen as a singularity of the RotD100, rather than a variation of behavior with orientation. Also, it is again observed that the RotD100 and 2D Resp have comparable results.
6 DISCUSSION
The main advantage of 2D Resp over current OI-IMs is that, by being equal to the two-dimensional spectral acceleration of measured ground motions, it can be used to design structures by developing GMPMs and then performing PSHAs without loss of information. The latter is because the predictive capability of GMPMs and PSHAs is independent of the IM they use. Therefore, even if both had perfect accuracy, the predicted IM would have the same shortcomings as the reference IM.
For the current OI-IMs, these limitations are that they either represent: an average spectral acceleration, that is lower than the real one (e.g. GMRotDpp and L/MaxRotDpp); or the largest acceleration in a single direction, but neglecting the one occurring in the complementary, transverse direction (e.g. RotDpp). These shortcomings persist regardless of the percentile (pp) selected for their computation because they solely arise from the combination of isolated responses.
The above reasoning contrasts with that of Stewart et al.,16 who argues in favor of the use of RotD100 that, since the direction in which the largest horizontal seismic response occurs will almost certainly never coincide with one of the principal axes of a structure, then it is appropriate to design it with the maximum response found in an arbitrary (random) direction. However, while the first part of this argument is true, the second part neglects that the response in one direction is always accompanied by the response in the perpendicular direction and that together they establish the total response. In other words, that any structure subjected to seismic motion other than polarized (i.e., in just one direction) will undergo all three components of motion, rather than just the one in which the response is maximum. This total response is what 2D Resp and 3D Resp represent for two- and three-dimensional movement, respectively.
It should be added that, irrespective of the IM used for seismic design (whether the current OI-IMs or the 2D Resp), the horizontal direction of the predicted response is always uncertain, because for sites more than a dozen kilometers away from seismogenic sources, ground movement is essentially random (i.e., without a predominant direction).19, 20 Therefore, since tracking the exact most unfavorable seismic direction for a structure is a computationally exhaustive task, it is standard practice to align it with the principal axes of the structure and then analyze its effect in each direction (see right-hand side of Figure 2). It is up to this point in the seismic design procedure that the SDOFS motion becomes that of the structure by involving its periods in each direction.
Another advantage of 3D/2D Resp over any OI-IM that scans every possible direction of the reference frame (e.g., GMRotDpp, L/MaxRotDpp, and RotDpp) is that the SDOFS response only has be computed once for each of the signal components. That is, only two response spectra computations are needed for 2D Resp and three for 3D Resp, instead of 180 for GMRotDpp or L/MaxRotDpp and 360 for RotDpp (if one-degree increments of are used). Although this difference seems small for a single signal, is a significant saving considering the time it currently takes to process thousands of records using current OI-IM.5 In addition, since the 2D Resp produces comparable results to RotD100 for most signals (without polarization or directivity effects), a less computationally demanding alternative for computing RotD100 is provided in this paper.
One of the drawbacks of 3D/2D Resp, which incidentally is also shared by GMRotDpp, L/MaxRotDpp and RotDpp, is that they are functions of frequency (or period). This complicates the development of GMPMs, since frequency must be included as another variable, or the PSHA must be repeated for each period considered to compute the so-called uniform hazard spectrum (UHS). Nonetheless, Boore et al.7 and Boore8 circumvent this problem by considering only the orientation of the reference frame (or azimuth, depending on whether GMRotDpp or RotDpp is used) in which the IM most closely resembles the mean value of the response obtained over the entire frequency range considered. In other words, they propose to use a doubly average IM, both in orientation and in frequency.
The latter, in addition to increasing the computational effort, means that, regardless of the effectiveness in predicting the baseline IM, there will always be over- and under-designed structures depending on the difference between their fundamental period and the average predominant frequency of the seismic records included in the PSHA. The same is true for MD, introduced by Huang et al.,11 which only produces the correct seismic demand for structures whose period coincides with the predominant period of the signal. In the author's opinion, this problem is already solved with the widespread use of the UHS and, although this is a computationally demanding task, is clear that the work will be less (and also more representative of the site ground motion) by using 2D Resp instead of the current OI-IMs.
7 CONCLUSIONS
In this paper, a pair of orientation-independent but frequency-dependent IMs, called the three-dimensional response spectrum, 3D Resp, and the two-dimensional response spectrum, 2D Resp, were introduced. Both IMs establish the maximum response of an SDOFS subjected to seismic excitation in three or two dimensions, depending on the measure, and are thus capable of capturing the ground motion measured by an orthogonal array of accelerometers. Since the vertical component of seismic motion is often negligible or treated separately in PSHAs, it appears that the ideal IM for the development of GMPMs and the performance of PSHAs is 2D Resp.
Comparing 2D Resp with commonly accepted OI-IMs it was found that, theoretically, the horizontal seismic response could be underestimated by up to 29% in the worst-case scenario, depending on the percentile (pp) chosen in the calculation of GMRotDpp, L/MaxRotDpp and RotDpp. The physics-based derivation of 2D Resp makes it clear that such underestimation persists even taking the 100th percentile, which is equal to the maximum.
Furthermore, it was found that, of all the current OI-IMs, only RotD100 has a similar value to, but always lower than, 2D Resp. Thus, considering that RotD100 is the basis for many current seismic design codes, it appears that developing GMPMs, performing PSHAs, and basing future seismic provisions on 2D Resp represents an advance in the physical rigor of seismic demand estimation and a reduction in its uncertainty, without drastic changes in current seismic design outputs. This change in baseline IM also has the advantage that it greatly reduces the large computational cost of analyzing (unnecessarily) all possible orientations of the reference frame of the measured signals.
Also, the comparison between IMs showed that the greatest variability between RotD100 and 2D Resp is associated with polarized signals, with strong directivity effects. This is particularly important at sites relatively close to seismogenic sources, where any PSHA based on RotD100 is very likely to underestimate the design acceleration for a range of periods corresponding to medium and low height structures.
Finally, it is important to note that the same ideas on which 3D/2D Resp is based can be employed to compute the two- or three-dimensional peak ground acceleration (2D/3D PGA), peak ground velocity (2D/3D PGV), and peak ground displacement (2D/3D PGD) to develop GMPMs based on this new seismic intensity measures where needed.
ACKNOWLEDGMENTS
Thanks are due to all the anonymous reviewers of this article for their comments and suggestions that improved the quality of this work.
CONFLICTS OF INTEREST
The author declares no conflict of interest.
Open Research
DATA AVAILABILITY STATEMENT
All data, models, or code that support the findings of this study are available from the corresponding author upon reasonable request.


