Seismic Reliability Evaluation of Interdependent Water and Power Supply Networks
ABSTRACT
Seismic reliability assessments of water and power supply networks are typically conducted under the assumption of system independence. This article introduces a novel framework for evaluating the seismic reliability of interdependent water and power supply networks, grounded in a comprehensive analysis of their interdependence mechanisms. The proposed framework integrates network flow theory and the Monte Carlo simulation method, leveraging network flow theory to determine the functional status of various system nodes and employing Monte Carlo simulations to account for random factors such as earthquake intensity. The practicality of the framework is validated through a case study in Shangcheng District. The numerical results reveal that: (1) the proposed method effectively evaluates the seismic reliability of interdependent water and power supply networks, and (2) the interdependent mechanisms and network topology significantly impact the seismic reliability of these networks.
1 Introduction
As global interest in developing resilient cities increases, a trend has emerged to re-evaluate urban disaster research from a systematic perspective. Resilience is widely recognized to include four characteristics: robustness, redundancy, resourcefulness, and rapidity. Furthermore, it is defined by four dimensions: technology, organization, society, and economy [1]. In contrast to traditional disaster prevention perspectives, the concept of resilience incorporates systemic characteristics that address disaster prevention across both temporal and spatial dimensions. Within the temporal dimension, resilience encompasses not only the consequences of disaster damage but also the processes of post-disaster recovery, pre-disaster reinforcement strategies, and sustainable life-cycle disaster reconstruction [2]. A common definition of resilience focuses on the terms “recovery” or “recover” [3]. In the spatial dimension, resilience highlights the characteristics of multiple systems and various disasters. For example, the software In-CORE (Interdependent Networked Community Resilience Modeling Environment), developed according to resilience principles, exemplifies these characteristics [4]. The focus of disaster impact has progressively shifted from the physical destruction of infrastructure to broader effects on human society, including population displacement and the impacts on vulnerable groups. These characteristics provide intuitive foundations for disaster analysis and decision-making [5]. An integrated analysis of “natural disasters, residential environments, and social groups” has been accomplished. Consequently, some scholars have introduced a new discipline termed “resilience engineering” [6-8].
Seismic reliability serves as the foundation of seismic resilience. The former primarily addresses the extent of a system's functionality decline following an earthquake, while the latter also considers the recovery of system functionality post-decline. It is important to note that maintaining a certain level of system functionality (i.e., system reliability) and enhancing recovery speed are not equally prioritized. Improving recovery speed often depends more on management factors, which involve greater uncertainty. Therefore, this article focuses primarily on evaluating the system's seismic reliability.
Water and power supply networks (WPSNs) are critical infrastructures essential to daily urban operations. In the aftermath of destructive earthquakes, these networks play a pivotal role in emergency rescue, healthcare, and post-disaster recovery. Water supply networks (WSNs) support the survival needs of victims, healthcare for the injured, and firefighting efforts, while power supply networks (PSNs), as a fundamental energy source, underpin communication, transportation, government operations, firefighting, and medical systems. For example, during the Tangshan earthquake of 1976, the damage rate for water sources, including water plants and wells, averaged 87.6%, while pipeline damage averaged 67.4%. As a result, the WSN was incapacitated for over a week and required an additional 2 months to restore basic functionality. In August 1976, bacterial tests of drinking water in Fengnan County, Tangshan City, found that 22 of 23 samples were substandard, leading to widespread enteritis and dysentery. The incidence rate reached 10%–30% across Tangshan, with some areas reporting as much as 90% of households affected [9]. Simultaneously, the PSN suffered severe impacts, with over 2000 power sector employees losing their lives, and power was not restored until 16 h after the earthquake. This lack of electricity directly hindered relief operations. As documented in the literature [10], the swift repair of severely damaged transportation, communication, water, and PSNs was crucial for effective disaster response.
Water and power, as a primary necessity, is essential for sustaining life after earthquakes, especially in densely populated urban areas where timely access post-disaster is critical [9]. The essential nature of WPSNs has been underscored in recent major earthquakes, including the 2008 Wenchuan earthquake [11], 2010 Haiti earthquake [12], 2011 Great East Japan earthquake [13], New Zealand's Christchurch earthquake [14], 2013 Lushan earthquake [15], 2015 Nepal earthquake [16], 2018 Indonesia Sulawesi earthquake [17], and the 2023 Turkey–Syria earthquake. Particularly notable is the ongoing global concern about environmental pollution due to the nuclear plant leak during the 2011 Great East Japan Earthquake, which continued even 12 years later. Therefore, scientifically evaluating the seismic reliability of WPSNs holds both significant scientific relevance and high social value.
Traditionally, research on seismic reliability evaluations of WPSNs has been conducted with the assumption that water and power systems operate independently [18], implying no functional interdependence between them. While this assumption simplifies analysis, it risks overestimating the seismic performance of systems, especially under strong earthquakes. Increasingly, in the context of resilient cities, researchers are exploring the functional interdependencies of urban infrastructures, recognizing that they are inherently linked [19, 20]. WPSNs exemplify these lifeline systems with interdependent characteristics. Therefore, this article uses functionally interdependent WPSNs as a case study to propose a novel framework for evaluating the seismic reliability of interdependent urban infrastructures.
The organization of this paper is as follows: Section 2 reviews various methods addressing this issue, highlighting the advantages and disadvantages of each approach while identifying the limitations of current research. Section 3 introduces the fundamental components of WPSNs and provides a detailed analysis of their interdependent mechanisms. Section 4 presents the seismic reliability evaluation framework for interdependent WPSNs. Section 5 applies this framework to WPSNs in the Shangcheng District of Hangzhou City to verify the proposed method's effectiveness and practicality. Finally, conclusions are discussed in Section 6.
2 Literature Review
From a physical systems modeling perspective, Adachi and Ellingwood first investigated the impact of PSNs on the seismic reliability of WSNs [21]. Research in this field has continued to expand over the past decade. For interdependent WPSNs affected by various disasters, research methods typically fall into seven categories: Monte Carlo simulation (MCS) method [22, 23], complex network indices [24-27], system dynamics models [28], input-output models related to economic and social systems [29], agent-based models [30], optimization models [31-35], and related methods. A brief introduction to these models is summarized below.
(1) The MCS method is fundamental in reliability engineering. It simulates the physical states of numerous samples under random conditions based on fragility curves for WPSN components, then calculates nodal function frequencies in different states via network connectivity or functional analysis, accounting for network interdependencies. The method's essence lies in approximate frequency calculations rather than precise probability analysis [22, 23]. The main advantages of this approach are its simplicity, ease of understanding and implementation, as well as its open framework, which can integrate with different models to enhance computational efficiency or accuracy. (2) Methods based on complex network indexes are extensions of graph theory, abstracting infrastructure networks as graphs of nodes and edges. Metrics such as betweenness centrality, edge density, average node degree, and network radius are commonly used to evaluate system performance [36]. This approach is computationally efficient and well-suited for large networks, though it may not fully capture the unique physical attributes of specific networks. (3) The system dynamics method involves creating mathematical equations to model interactions within or between systems. Solving these dynamic equations reveals the functional states of system components. This approach is widely used in critical infrastructure modeling tools such as CIPDSS-DM and CIPMA, with straightforward principles conducive to simulation. (4) Economic models, especially input-output models, are frequently employed for assessing disaster impacts on interdependent infrastructures. Santos & Haimes developed such a model to analyze disaster risks [37], and Chang et al. used it to evaluate the impact of the 1998 Canadian snowstorm on power and other infrastructures [38]. While effective for static assessments, these models cannot represent the dynamic nonlinear interdependencies that emerge during recovery processes. (4) Agent-based models analyze system interactions, such as in disaster evacuations [5] or post-earthquake rumors [39]. Widely used in tools like the “Critical Infrastructure Modeling System” from the US Idaho National Laboratory [40] and the “Cascading Effect Simulation” by Germany's Fraunhofer EMI [41], agent-based models offer flexible modeling and programming, facilitating interaction with facility managers and other stakeholders. (5) Optimization models typically involve defining an objective function and constraints for interdependent WPSNs, seeking an optimal solution for reliability assessment or system design. Barker's group at the University of Oklahoma has notably advanced this field using mixed-integer programming to assess WPSN resilience [31-35]. While effective, optimization models can be computationally intensive, particularly for large networks, sometimes requiring extended processing times. (6) Other methods include indicator frameworks for urban resilience assessments, such as “ReCOVER” [42], “PEOPLES” [43], and the “CITY RESILIENCE INDEX” [44]. Probabilistic graphical models (e.g., Bayesian and Markov networks) [45] and empirical methods based on historical data or expert opinions [46, 47] are also frequently applied in WPSN reliability assessments.
However, existing studies have two primary limitations. First, the mechanisms of interdependence between WPSNs are insufficiently defined. The relationship between these systems is often simplified, with limited scenarios illustrating their interdependence. Second, current models exhibit poor scalability and are not readily compatible with other lifeline systems. To address these gaps, this paper proposes a framework for evaluating the seismic reliability of interdependent WPSNs using a network flow model. Urban infrastructure is inherently complex, with many interdependent systems. Under normal conditions, these interdependencies are less pronounced; however, during disasters, they frequently lead to cascading failures. WPSNs are particularly typical lifeline systems that interdepend by exchanging resources at certain network nodes. This paper focuses specifically on WPSNs rather than attempting to model all interdependent infrastructures. The numerical case study demonstrates the effectiveness of this model.
3 Interdependent Mechanisms Between WSNs and PSNs
Understanding the fundamental structures of WPSNs is essential to analyze the mechanisms of functional interdependence between these networks. Figure 1 provides a schematic representation of the WPSN composition. WSNs are composed of various nodes and pipelines. These nodes include water sources, treatment plants, booster pumping stations, and consumers, such as factories, commercial establishments, hospitals, and households. Pipelines—including straight pipelines, elbows, and tees—distribute water from treatment plants to these nodes. Similarly, PSNs are composed of nodes and power lines. Key nodes include power plants, substations with various voltage levels, and diverse consumer types. Power lines consist of buried cables and overhead lines, each with distinct structural requirements: buried cables are typically paired with manholes, whereas overhead lines are supported by transmission towers or electrical poles.
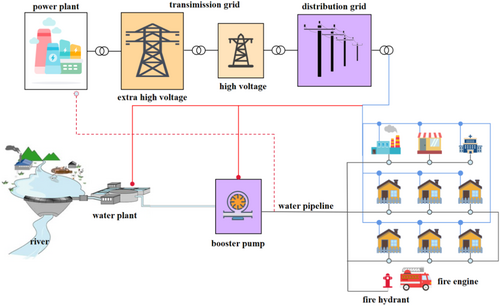
In real-world WPSNs, source nodes encompass diverse types of physical infrastructure. For example, power plants may include thermal, wind, geothermal, tidal, and nuclear facilities, while water pipelines are often constructed from materials such as gray cast iron, ductile iron, polyvinyl chloride (PVC), and polyethylene. This infrastructural diversity leads to complex WPSN configurations, which require simplification and abstraction to develop representative physical models.
- 1.
Direct power supply interruptions resulting in water plant shutdowns: Following the Wenchuan earthquake on May 12, 2008, at 14:28, Chengdu's No. 6 water plant experienced a half-hour power interruption, disrupting critical water coagulation and disinfection processes. In Mianyang, a power outage suspended WSN operations for 12 h. In Deyang, power was restored to the water plant on May 14 at 8:00 a.m., allowing overhauls and water quality testing to commence. The Dujiangyan water plant lost power for 2 days and resumed operations on May 14 in the afternoon, with water production restarting that night and full water supply restoration achieved by 9:45 a.m. on May 15 [50].
- 2.
Damage to transformers or power distribution facilities resulting in water plant shutdowns: During the Wenchuan earthquake, the Majiao water plant in Jiangyou experienced a water supply interruption due to the destruction of its power distribution facilities [50].
- 3.
Even if the PSN is energized, interruptions in power supply may still occur due to poor power quality. For instance, following the Wenchuan earthquake, Mianyang's No. 2 water plant, responsible for 30% of the total water supply, ceased operations around 17:00 due to an imbalance in the three-phase power supply [50].
The effects of WSNs on PSNs are less frequently documented in earthquake impact reports. However, as large water consumers (particularly thermal power plants), the operational functionality of power plants is inherently dependent on WSN performance. Researchers have differing views on this dependency. For example, Wu and Dueñas-Osorio suggested that substations in PSNs require cooling water provided by WSNs [51], while Wang et al. argued that substations and main distribution stations do not require such cooling water [52]. Jin et al. believe that thermal power plants in China cannot get water through WSNs [52].
Thermal power plants rely heavily on water for cooling, ash removal, and fire protection. According to China's Norm of Water Intake—Part 1: Electric Power Production (GB/T 18916.1-2002), the water quota for circulating and once-through cooling in plants with generator capacities under 300 MW should be less than 4.8 kg/(kW·h) and 1.2 kg/(kW·h), respectively. For generator capacities over 300 MW, these quotas drop to 3.84 kg/(kW·h) and 0.72 kg/(kW·h) [53]. In practice, the basic water quota for thermal power plants in China ranges between 2.3 and 2.57 kg/(kW·h) [54].
- 1.
Domestic Water: Used by workers and families living in the plant's staff dormitories [55]. While its absence won't halt production, it may impact employee morale and productivity.
- 2.
Industrial Water: Essential for plant operations; a shortage could reduce production or even cause a shutdown. For example, the Yantai Ximou water plant supplies roughly 10,000 m³ of water daily to a local power plant. If the main pipeline is damaged, alternative sources are needed [56].
In exceptional cases, power plants may also supply water to WSNs [57, 58]. Given their large water intake facilities, thermal power plants may have surplus domestic water, which can be supplied to local WSNs for resident use.
Additionally, firefighting water for substations depends on WSNs. Large substations with maintenance staff require a consistent supply of domestic water, and the outdoor firefighting water demand should not fall below 15 L/s [55].
To clarify these interdependencies, Table 1 presents a summary of relationships between WSNs and PSNs, based on real records that have not been systematically covered in the literature before.
| Relationship | Interdependent mechanisms between WSNs and PSNs |
|---|---|
| Impact of a PSN on a WSN |
|
| Impact of a WSN on a PSN |
|
4 Seismic Reliability Evaluation Framework of Interdependent WPSNs
4.1 Overview of the Framework
In the above, Ri is the seismic reliability of node i, Pr is the probability of the event, and Si and Di are the quantities of the commodity supplied and demanded at node i, respectively. Zi is the functional state of node i. When Zi is larger than zero, the functional state of node i is normal. When Zi is equal to zero, the functional state of node i is in a critical state. When Zi is less than zero, the functional state of node i fails.
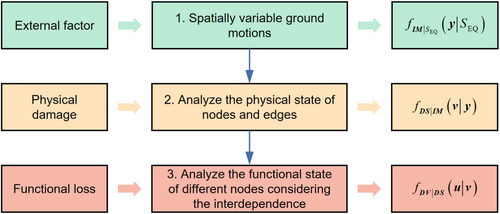
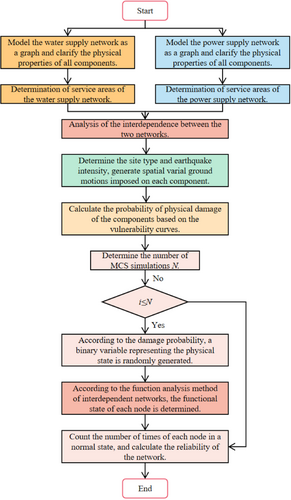
Therefore, according to Equation (4), we should (1) build a model to present the spatially variable ground motions, and then, based on the spatial distribution of the WPSNs, generate ground motion samples; (2) analyze the physical states of the nodes and edges based on empirical models or physical models; and (3) analyze the functional states of different nodes while considering the interdependence among networks, and count the number of nodes in the normal state among all samples. The framework is illustrated in Figure 2.
4.2 Spatially Variable Ground Motions
Here, Y (g) is the geometric average of the peak ground acceleration (PGA) in two horizontal directions or spectral acceleration (SA) with a 5% damping ratio. Mw is the the moment magnitude of earthquakes. rrup (km) is the closest distance to the fault, where r1 = 70 km, and r2 = 130 km.
- 1.
Determine the moment magnitude and source location of the earthquake at the simulated site.
- 2.
Determine the shortest distances between different points of the ground motion field and the seismic source.
- 3.
Calculate Y according to Equation (5).
- 4.
If the site type is A, Y is the mean of the PGA or SA1 with a 5% damping ratio, and if the site type is not A (A is the site type. In ALA seismic guidelines, the site is divided into six types, from Class A to Class F), PGA and PGV should be transferred to other sites according to [61].
- 5.
When considering the randomness of earthquakes, the standard deviation of lnY needs to be calculated using Equation (10). Here, lnY is assumed to be normally distributed. Then, random earthquake field samples can be obtained.
4.3 Physical State of Components of WPSNs
In the above, is the CDF of the standard normal distribution. x (g) is the acceleration. mR is the median, and βR is the logarithmic standard deviation (also called the dispersion coefficient).
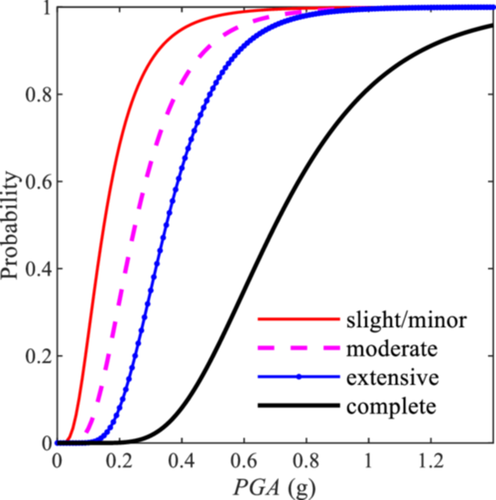
Herein, a substation with seismic reinforcement measures is shown as an example. Accordingly, the parameters (mR and βR) used to calculate the probability of the substation in the slight/minor, moderate, extensive, and complete damaged states are 0.15/0.6, 0.25/0.5, 0.35/0.40, and 0.70/0.40, respectively. The corresponding fragility curves are shown in Figure 3. For substations, according to, slight damage is defined as the failure of 5% of the disconnect switches (i.e., misalignment), or the failure of 5% of the circuit breakers (i.e., circuit breaker phase sliding off its pad, circuit breaker tipping over, or interrupter-head falling to the ground), or by the building being in minor damage state.
Here, RR (/km) is the pipeline repair rate, and the PGV is in cm/s. This equation is suitable for rigid pipelines, whereas for segmented pipelines, such as steel pipelines, ductile iron pipelines, and PVC pipelines, the result should be adjusted by a parameter of 0.3. In addition, for steel pipelines, different welding styles may have different effects. If a pipeline joint is arc-welded, the pipeline is rigid, whereas if the pipeline joint is gas-welded, the pipeline is ductile.
4.4 Functional Analysis Method of Interdependent WPSNs
- 1.
The node is directly damaged by a disaster.
- 2.
The demand for the node has not been met.
- 3.
The parent node fails.
- 1.
The cost of transmitting substances at each edge.
- 2.
The cost of each node if the substances are in surplus or insufficient.
- 3.
The cost of a node if its function fails.
- 1.
The cost of per unit of substances l transmitted at edge (i, j) × the quantity of substances l transmitted at edge (i, j).
- 2.
The per-unit cost of the substances l for node i when the substances are in surplus × the surplus quantity at node + the per unit cost of the substances l for node i when the substances are inefficient × the inefficient quantity at the node.
- 3.
The node failure cost × node functional state.
Meanwhile, the model also needs to meet a series of restrictions.
This restriction guarantees the flow balance at each node.
In the proposed model, the variables di and fi are different. The variable di is used to represent the physical state of node i, which describes the structural damage of different facilities in node i subjected to seismic hazards. For example, if the supports of pump stations in the WSN or the supports of transformers in the PSN collapse during an earthquake, the variable di should be 1. However, the variable fi is used to represent the functional state of node i. For example, if the demand of a node has not been met even though there is no physical damage to node i, di should be 0 while fi should be 1 at this time.
This guarantees that if the demand is insufficient (), then the function of this node is failed, and the state variable of the node is set to 1.
The function of M is to determine the logical relationship between the node state variable and slack variable at the same node. If the demand is met, the right side of the equation is zero, and the left side of the equation can be met because M × 0 should be larger than or equal to 0. In addition, the right side of the equation should be larger than 0. At this time, must be 1. This guarantees that if the node demand is not met, the state variable on the left side of the equation must be 1. M represents a large number.
In the above, is the parent node in the parent network of child node i in the child network k. () is a logic parameter for connecting the parent and child networks. When is 1, the function of the child node is normal if the function of the parent node is normal. Of course, for real networks, the interdependent relationship can be complex. Sometimes one child node probably needs many parent nodes simultaneously, or one child node is normal as long as one of its parent nodes is normal. At this time, the value of must be adjusted. For node i, should be 1/Np for the former case, whereas should be 1 for the latter case.
Here, S0 is the sum of the flows supplied by the source nodes.
Because the optimization method is utilized and Equation (16) is the objective function, we need to find a solution to minimize Equation (16). In this paper, the software Gurobi is used to solve the model. The initial values of parameters , , are randomly generated. The capacity limitations of node i and edge (i, j), and should be determined according to the properties of nodes or edges. The cascading failure model is built to assess the functional state of every node in interdependent networks. Through the cascading failure model, we can get the functional state of every node. When combined with the MCS method, the reliability of WPSNs can be estimated.
4.5 Basic Steps of the Method
- 1.
Simplify the real WPSNs as two different graphs. Each graph consists of a node set and an edge set, and then number the nodes and edges. Meanwhile, the physical properties of every node and every edge should be clarified, including the node types, pipeline length, and pipeline diameter. In addition, the parent nodes and corresponding child nodes must be determined. Different nodes are linked to different serviceability areas in the urban map.
- 2.
Based on the site type and preset earthquake intensity, generate spatially variable ground motions for the different nodes and edges in the two networks.
- 3.
Determine the fragility curves according to the physical properties of each node and edge. Then, compute the damage probability based on the seismic intensity and fragility curve of each component.
- 4.
Determine the number of MCSs. For each simulation, according to the failure probabilities of the nodes and edges, randomly generate a 0 or 1 to represent the physical state of each component.
- 5.
Analyze the node function considering the interdependence between WSNs and PSNs according to the method described in Section 3.4.
- 6.
Count the number of times that each node is in a normal state in all simulations, and then calculate the functional reliability of each node in the network. In addition, the reliability of each node should be fed back to the corresponding serviceability areas.
The above-mentioned basic analysis process is illustrated in Figure 4.
5 Numerical Case
5.1 Overview
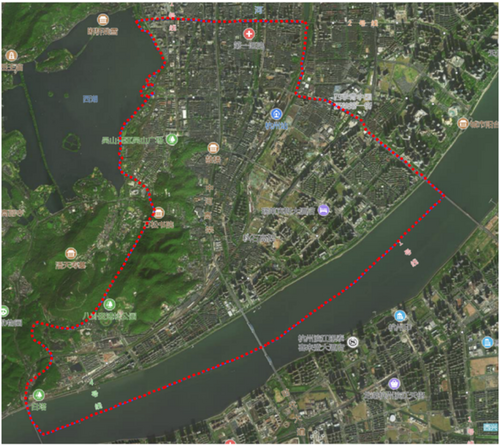
The numerical case is based on the WPSNs in Shangcheng District, Hangzhou. Shangcheng District is located next to West Lake in Hangzhou City, Zhejiang Province. It is one of the central areas of Hangzhou and is also a very old town. Currently, there are six streets and 54 communities in Shangcheng District, with a total population of approximately 350,000. A satellite remote sensing map of Shangcheng District is shown in Figure 5.
A distribution diagram of the WPSNs is shown in Figure 6. Different types of nodes, including source nodes, consumer nodes, and their properties are labeled in Figure 6. Also, the flow direction in a normal operating state is illustrated in Figure 6. However, it should be noted that the flow direction, especially the water flow in the network, is not always constant. For example, the flow direction will change when some pipelines or nodes are damaged after earthquakes.
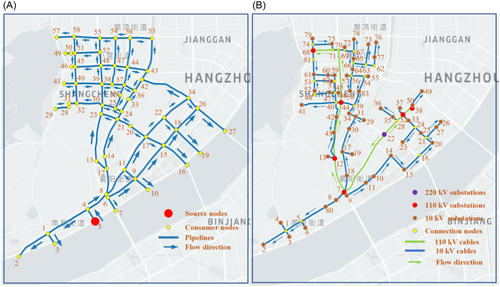
After proper merging and simplification, the WSN contains 58 nodes and 77 pipelines. Among them, Node 5 is the source node and represents the Nanxing water plant. The other nodes in the WSN are consumer nodes. 58 nodes divide Shangcheng District into 58 service areas. The PSN contains 81 nodes and 89 edges. Among them, 61 nodes represent substations, including one 220 kV substation, six 110 kV substations, and 54 substations with 10 kV grade. Every 10 kV substation is responsible for a community. For the 54 communities with a specific geographical boundary, 54 substations with 10 kV are arranged to supply power for the 54 communities. One substation node corresponds to a community as the service area.
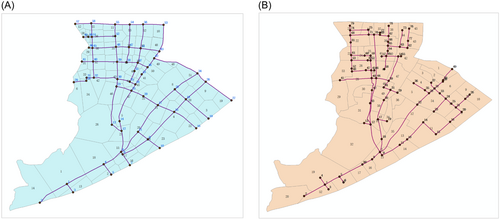
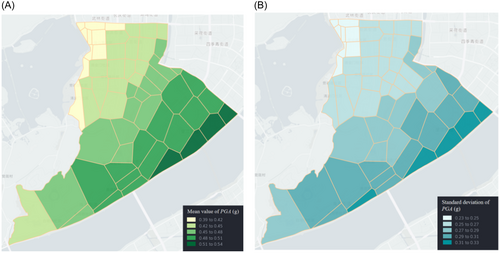
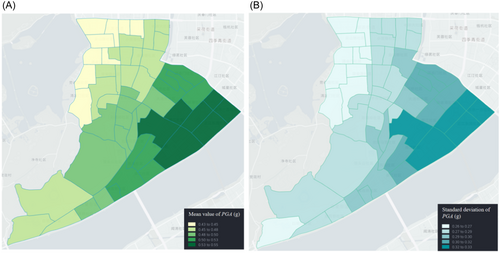
The interdependent relationship between the two networks is that the PSN supplies power to the water plant to realize the normal operation of the pump station in the water plant, which transmits water to various service areas. Therefore, Node 8 of the PSN is the parent node, and Node 5 of the WSN is the child node. The relationships between the node numbers and corresponding service area numbers are shown in Figure 7. In this case, it was assumed that the moment magnitude scale of the earthquake is 8 and that the seismic source is 30 km southeast of Shangcheng District. The site type is type II. For the MCS analysis, the mean and standard deviation of the PGA of 1000 samples in different service areas are generated based on the nodes of the WPSNs shown in Figures 8 and 9, respectively. There is a slight difference in the distribution of PGA between the service areas of the WSN and those of the PSN. The reason lies in that the PGA is obtained by a specific node in the service areas to calculate the PGA of WPSNs. The WSN uses the geographic information of nodes in the WSN, while the power network uses the geographic information of 10 kV substation nodes. The coordinates of the nodes in the two networks are different.
5.2 Results and Discussion
5.2.1 Whether to Consider the Functional Interdependence
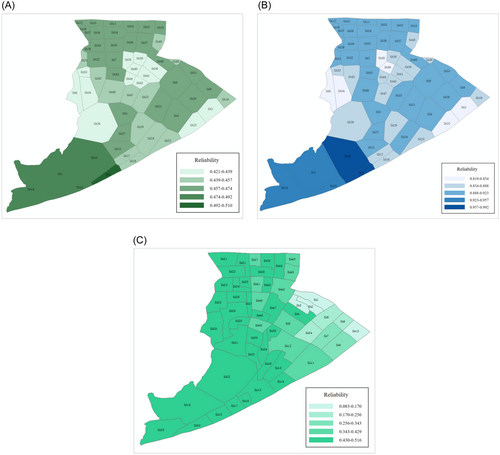
Herein, two cases are studied to analyze the influences of the functional interdependence. The first considers the interdependence between the two networks, whereas the second neglects the interdependence. The reliability of each node in the WPSNs in the two cases is shown in Figure 10. The reliability of each service area corresponding to the different nodes of the two networks is shown in Figure 11.
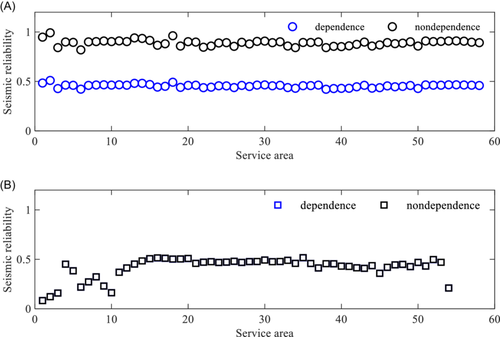
According to Figure 10, the following conclusions can be drawn.
- 1.
The dependence of the WSN on the PSN has a significant influence on the seismic reliability of the WSN. When the dependence is considered, the mean value of the service areas of the WSN is 0.455, and the standard deviation is 0.017. The service area with the maximum reliability is SA2 (Node 5, which represents the water plant in the WSN), and the maximum reliability is 0.510. The service area with the minimum reliability is SA38 (Node 38), and the minimum reliability is 0.421. When the dependence is neglected, the mean value for the service areas of the WSN is 0.890, and the standard deviation is 0.031. The service area with the maximum reliability is also SA2, and the maximum reliability is 0.992, whereas the service area with the minimum reliability is SA6 (Node 29), and the minimum reliability is 0.819. Therefore, the seismic reliability of the WSN will be significantly overestimated without considering the dependence of the WSN on the PSN. The error can be up to 95.7%. This highlights the importance of this work.
- 2.
For the PSN, the dependence of the WSN on the PSN does not have an evident effect on the reliability of the PSN. The seismic reliability of each node of the PSN in the two cases is the same. The mean and standard deviation are 0.415 and 0.108, respectively. The service area with the maximum reliability is SA35 (Node 18 in the PSN), and the reliability is 0.516. The service area with the minimum reliability is SA1 (Node 49), and the reliability is only 0.083. This suggests that the type of interdependence between networks affects the seismic reliability of the networks. Like this one-way associated network, the PSN has a significant impact on the reliability of the WSN, but the WSN does not have any effect on the reliability of the PSN. Once the two-way correlation between the two networks is considered, the reliability of the PSN must also be affected.
According to Figure 11, the following conclusions can be drawn.
- 1.
Dependence can also affect the spatial distribution characteristics of the seismic reliability of a WSN. For example, service areas SAs 1, 2, 13, 14, and 18 in the southwest in the two cases all have high seismic reliability. However, when considering the dependence, there are four service areas at the same reliability level (0.421–0.439), that is, SAs 6, 26, 33, and 34. When neglecting dependence, SA6 and SA34 are at one reliability level (0.819–0.854) while SA26 and SA33 are at the other reliability level (0.854–0.888). Thus, the relationship between the two networks can affect the spatial distribution of the node reliability.
- 2.
For the areas of the PSN with high reliability, the reliability of the WSN is relatively high. For Shangcheng District, the reliability of the WPSNs generally shows a trend of high reliability in the southwest and low reliability in the northeast. However, considering the difference in the operating mechanisms of the two networks, there is no necessary relationship between the reliability of the two networks. However, within each network, the closer to the source point, the higher the reliability of the node. Taking the WSN as an example, the reliability of service area SA2 corresponding to the source node is the largest with a value of 0.510, whereas the reliability of service area SA12 corresponding to Node 57, that is, the farthest from the source node, is the smallest, with a value of 0.462. Similarly, in the PSN, service areas SA16 and SA33 (corresponding to 110 kV substation Nodes 8 and 12) have relatively larger reliabilities of 0.514 and 0.490, respectively. However, the reliability of service area SA10, corresponding to Node 26, is only 0.162. It should be pointed out that this general trend is not inevitable, and there are variations in the three-dimensional space.
5.2.2 Influence of the Number of Parent Nodes
To study the influence of the number of parent nodes in the PSN, four cases were analyzed, as follows.
Case 1: Node 5 of the WSN (the water plant) is dependent on Node 8 of the PSN.
Case 2: Node 5 of the WSN (the water plant) can obtain power from Node 8 or Node 9 of the PSN; that is, Nodes 8 and 9 of the PSN are the parent nodes of the water plant node 5. Therefore, if the function of any parent node is normal, the water plant can obtain the required electricity. Herein, we should note that, first, the direction of the power supply distribution is not constant even in a normal state. The flow's direction may change if the demand of some nodes changes in the network. If some nodes and edges are damaged, the flow direction can also change. Second, Case 2 is very different from Case 1. In Case 1, the water plant can only obtain power from Node 8. That means once Node 8 suffers functional failure, the water plant has to be shut down. However, in Case 2, the water plant can obtain power from Nodes 8 and 9 indicating that the water plant has two parent nodes in the PSN. Therefore, if Node 8 suffers functional failure, the water plant can still obtain power from Node 9. Otherwise, if Node 9 fails, the electric current can flow from Node 7 to Node 8, and the water plant can still obtain power so that it still can supply water to the network. In addition, it should be noted that a major difference between WSNs and PSNs is that the nodes and edges in PSNs have voltage grades. Therefore, Node 7 can supply power to Nodes 8 and 9, but Node 8 cannot supply power to Nodes 7 and 9. However, for the WSN, water can flow from pipelines with large diameters to pipelines with small diameters or flow from pipelines with small diameters to pipelines with large diameters.
Case 3: Node 5 of the WSN can obtain water from nodes 8, 9, or 6 of the PSN.
Case 4: Node 5 of the WSN can obtain water from the 10 kV substation nodes 8, 9, or 6 of the PSN, or from 110 kV substation Node 7.
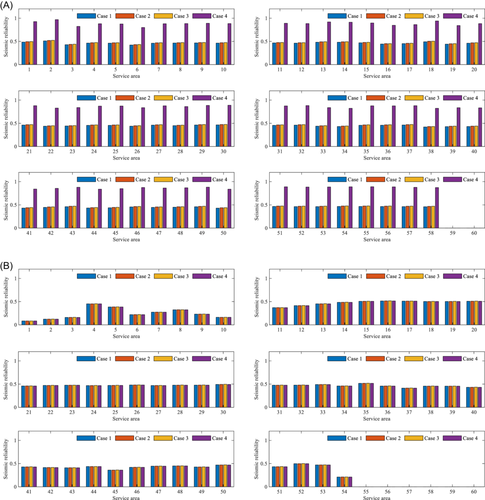
The reliability of the different service areas corresponding to the different nodes of the WPSNs is shown in Figure 12. In the four cases, only the dependence of the WSN on the PSN is considered. Therefore, the reliability of the PSN does not change significantly. However, for the WSN, the change in reliability in the four cases is significant, and the main findings are as follows.
- 1.
An increase in the number of parent nodes in the parent network helps to improve the seismic reliability of the child network. Taking service area SA2 of the WSN (corresponding to Node 5) as an example, the seismic reliabilities of the areas in Cases 1–4 are 0.511, 0.521, 0.523, and 0.969, respectively. Compared with Case 1, the reliability increases by 0.010, 0.012, and 0.458, respectively. From the average value of the seismic reliability of all service areas, the average values of the seismic reliability of all areas in Cases 1–4 are 0.455, 0.463, 0.466, and 0.871, respectively. Compared with Case 1, the reliability increases by 0.008, 0.011, and 0.416, respectively. As the number of parent nodes increases, the seismic reliability of the child network increases.
- 2.
The reliability of the parent node in the parent network significantly affects the seismic reliability of the child network. Compared with Cases 2 and 3, Case 4 shows the greatest improvement in the reliability of the child network. In terms of the average reliability of all service areas, it increases by 91.34%, whereas in Case 2 and Case 3, it only increases by 1.97% and 2.40%, respectively. After analysis, the reliability values of Nodes 8, 9, 6, and 7 are 0.5145, 0.5065, 0.5025, and 0.9970 respectively.
- 3.
For the WSN, the overall reliability for the four cases is 0.455, 0.464, 0.466, and 0.871, respectively, while for the PSN, the overall reliability in four cases remains 0.415. Obviously, the increase of parent nodes in the PSN is in favor of the overall reliability of the WSN. However, compared with Case 1, the overall reliability of Cases 2 and 3 only increases by 0.009 (1.97%) and 0.011 (2.40%), respectively, while the overall reliability of Case 4 increases by 0.416 (91.42%). These observations indicate that parent Node 7 of the PSN has a significant impact on improving the reliability of the WSN. The reason is that the parent Node 7 is a 110 kV substation in the PSN while parent Nodes 8, 9, and 6 are all 10 kV substations. The reliability of the 110 kV substations is much larger than the reliability of the 10 kV substations when they are subjected to the same seismic intensity. Therefore, when considering the dependence to design a child network, a node with higher reliability in the parent network should be chosen as the parent node.
5.2.3 Impact of Interdependence Between WSNs and PSNs
In addition to the dependence of the WSN on the PSN, in some special cases, some nodes of the PSN can also be dependent on the WSN, such as fire protection after earthquakes. Therefore, we assume that Node 8 of the PSN supplies power to Node 5 of the WSN (the water plant). At the same time, Nodes 25, 55, 76, and 79 of the PSN must obtain water for fire protection from Nodes 18, 37, 53, and 57 of the WSN, respectively. Therefore, the relationship between the two networks is two-way dependence in this case.
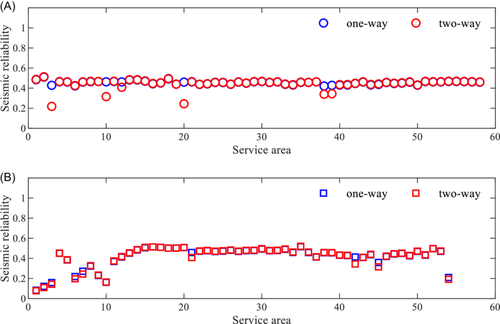
The MCS method is also used, and 1000 samples are calculated. Then, the reliability of the two networks is compared with the reliability of the two networks when only considering the dependence of the WSN on the PSN. The comparison is shown in Figure 13, and the following conclusions can be drawn.
- 1.
When the relationship between the two networks changes from a one-way to two-way dependence, the reliability of some nodes of the PSN will further decrease. For example, in this example, the reliability values of service areas SAs 3, 10, 12, 20, 38, and 39 of the WSN (the corresponding Nodes are 19, 53, 57, 18, 38, and 37, respectively) decrease from 0.428, 0.463, 0.462, 0.460, 0.421, and 0.428 to 0.219, 0.316, 0.406, 0.244, 0.339, and 0.344, respectively. The decrease rates reach 48.93%, 31.83%, 11.56%, 46.93%, 19.45%, and 19.57%, respectively. The largest decrease is service area SA3 (Node 19). Similarly, the seismic reliability of some service areas of the PSN also decreased significantly. Among them, the reliability values of the service areas SAs 1, 2, 3, 6, 7, 21, 42, 45, and 54 (corresponding to Nodes 49, 50, 37, 33, 25, 79, 55, 76, 23) decrease from 0.083, 0.122, 0.159, 0.219, 0.272, 0.459, 0.414, 0.359, and 0.210 to 0.078, 0.109, 0.143, 0.197, 0.244, 0.409, 0.344, 0.316, and 0.192, respectively. The decrease rates are 6.47%, 10.41%, 10.06%, 9.98%, 10.25%, 10.98%, 16.85%, 12.08%, and 8.56%, respectively. The largest decrease is service area SA42 (Node 55).
- 2.
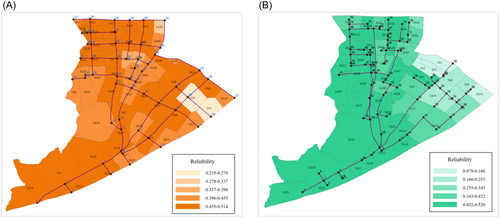
The spatial distribution of the network reliability changes significantly. Considering the WSN as an example, in the case of the one-way relationship, service areas SA3 and SA20 of the WSN are at two different levels (level 0.421–0.439 and level 0.439–0.457 in Figure 11A), whereas in the case of the two-way relationship, service areas SA3 and SA20 are at the same level (level 0.219–0.278 in Figure 14A).
- 3.
The characteristics of the network topology can also affect the change of the network reliability. Generally, changes in the reliability of the end nodes of the tree network do not affect the reliability of nearby nodes, whereas changes in the reliability of nodes in the ring network can affect the reliability of several nearby nodes. Taking the PSN as an example, the reliability values of service areas SAs 1, 2, 3, 6, 7, 21, 42, 45, and 54 (corresponding to Nodes 49, 50, 37, 33, 25, 79, 55, 76, 23) all change. Among them, Nodes 55, 76, and 79 are all located at the end of the tree network (Figure 14B). Therefore, their changes in reliability are localized. However, Node 25 is in the ring network (Figure 14B), and directly leads to a change in the reliability of Nodes 49, 50, 37, 33, and 23. In a ring network, the reliability change propagates along with the network.
- 4.
The overall reliability of the WSN is 0.455 and 0.444 for two cases, respectively, while the reliability of the PSN is 0.415 and 0.412 for two cases, respectively. The former decreases by 0.011 (2.42%) while the latter by 0.003 (0.72%). Obviously, when the relationship between the two networks changes from dependence to interdependence, the reliability of both networks decreases. However, the reliability of the WSN decreases more than that of the PSN. The reason probably lies that the WSN constantly needs power to maintain its functionality, while the PSN does not need water all the time in this case study. Compared with the PSN, the WSN is more vulnerable with full consideration of the interdependent relationship. This result also indicates that with the consideration of the interdependent relationships between the power and water networks, both infrastructure networks are more susceptible to seismic hazards, and thus lead to lower reliability of the two networks.
6 Conclusions
- 1.
WPSNs can exhibit one-way or two-way interdependencies. Typically, WSNs rely on PSNs for electricity; however, certain cases exist where WSNs can supply water to power plants, or power plants supply water to WSNs.
- 2.
The proposed method effectively evaluates the seismic reliability of WPSNs under interdependent conditions. Numerical results indicate that neglecting the interdependence can lead to a 95.7% overestimation of the reliability of WSNs. Interdependence also influences the spatial distribution of network reliability. If interdependence is ignored, some service areas within the WSN may exhibit slightly higher reliability than surrounding areas, potentially impacting disaster relief prioritization.
- 3.
Increasing the number of parent nodes in the parent network can enhance the seismic reliability of the child network. Also, the reliability of parent nodes has a substantial impact on the seismic reliability of the child network. When designing the child network with interdependencies, selecting higher-reliability nodes in the parent network as parent nodes is advisable.
- 4.
Two-way interdependence further reduces the reliability of both networks and significantly alters their spatial reliability distribution. Network topology can also influence network reliability. For end nodes in a tree topology, changes in reliability generally do not impact nearby nodes, while in a ring topology, changes in one node's reliability can affect several adjacent nodes.
Specifically, the study has two main limitations. First, the physical model is relatively simplified, relying solely on a flow balance approach and does not fully account for differences in water flow and electrical current within their respective systems. Second, the MCS method applied here requires a substantial number of samples, impacting computational efficiency. Future research could consider employing more accurate physical models for both the water and power supply systems. Additionally, quasi-MCS methods or probability density evolution methods could enhance computational efficiency.
Acknowledgments
This work was supported by the National Natural Science Foundation of China (Grant Nos. 52108427, 52478481) and the Beijing Natural Science Foundation (Grant No. 8222008).
Conflicts of Interest
The authors declare no conflicts of interest.


