Dynamic and Uncertainty Analysis of RC Frame–Wall Structures Against Progressive Collapse Under Various Column Removal Scenarios
ABSTRACT
Although reinforced concrete (RC) frame–wall structures have been frequently used in engineering practice, the effect of shear walls on the structural resistance against progressive collapse remains unclear. To address this gap, macroscopic numerical models of RC frame–wall structures are constructed using fiber-based beam elements for beams and columns, and multilayered shell elements for shear walls and slabs, then validated against available experimental results. Thereafter, a typical nine-story RC frame–wall structure is designed in accordance with Chinese codes and adopted to investigate the dynamic responses under various scenarios involving single or double-column removal through incremental dynamic analysis (IDA). The IDA results suggest that under design load either removing single or double columns will not trigger progressive collapse of the RC frame–wall structure, and the shear walls enhance progressive collapse resistance primarily by strengthening the boundary conditions for the remaining structure and reducing the deformable region of the directly affected region. Finally, sensitivity analyses are conducted to explore the effects of the uncertainty parameters of load, geometry, and material properties on the progressive collapse performance of the RC frame–wall structure. The uncertainty analysis results indicate that dead load, live load, yield strength of reinforcement, compressive strength of concrete, reinforcement area in beams, and ultimate strength of reinforcement are the most influential parameters in sequence affecting the performance of RC frame–wall structures in resisting progressive collapse.
1 Introduction
Progressive collapse is defined as the propagation of initial local damage from one member to another, ultimately resulting in the collapse of the entire structure or a significant portion of it [1]. The methodology to design against progressive collapse can be grouped into two types [2]: (1) threat-independent approach and (2) threat-dependent approach. The former focuses on the ability of the remaining structure to span local failures following an assumed initial failure of columns or bearing walls. The latter is more concerned with the process of the damage evolution over a structure under accidental loading. Using the threat-dependent approach, responses and damage of elements under an accidental load and the ensuing global response of the remaining structure under gravity load should be analyzed, which is quite computationally demanding. Since accidents are typically unforeseeable events and difficult to define precisely, the prevailing building codes and design guidelines adopt alternate load path (ALP), one of the threat-independent approaches, to explicitly evaluate the capability of the remaining structure against progressive collapse.
Over the decades, the structural behavior of reinforced concrete (RC) frame structures and substructures following a column loss has been extensively investigated by the principle of the ALP method. The extensive experimental studies are conducted at different levels, including single-story beam–column assemblies [3-5], single-story planar frames [6-8], single-story beam–slab assemblies [9-12], multistory bare frames [13], three-dimensional frames with slabs [14], and large scaled structures [15]. The experimental results indicate that RC frames can resist progressive collapse via various load-carrying mechanisms: the flexural action and the compressive arch action of beams, the compressive membrane action of slabs at small deformations, as well as the catenary action of beams and tensile membrane action of slabs at large deformations. Meanwhile, due to the dynamic nature of the progressive collapse, when the static analysis of progressive collapse is conducted, the structural dynamic amplification factor should be taken into account [16-21].
Since experiments on the performance of prototype structures against progressive collapse are too expensive, numerical simulations are commonly used as an alternative way. Bao et al. [22] simulated the structural behavior of RC beam–column assemblies under a middle-column removal scenario using both high-fidelity numerical models with solid elements and macro-based numerical models with fiber-based beam elements and found that both methods can capture the load transfer mechanisms of the assemblies from small to large deformation. Shan et al. [23] investigated the effect of floor height on the robustness of RC frame buildings, and Petrone et al. [24] proposed a critical failure index to compare the relative robustness of RC frame buildings in accordance with the numerical results using fiber-based beam elements for beams and columns and multilayer shell elements for slabs.
Besides the deterministic analysis of framed structures, the probabilistic analysis, which considers the uncertainties for RC frame structures, also attracted a lot of effort. For example, Li et al. [25] carried out the incremental dynamic analysis (IDA) for a regular RC frame, defined the probability of collapse by checking all available column removal scenarios, and finally built up fragility curves for assessing collapse at a certain given gravity load. Lin et al. [26] and Yu et al. [27] carried out uncertainty analysis on the progressive collapse of RC frame structures under column removal scenarios using macro-based numerical models, in which the gravity load, geometrical, and material property parameters are sampled according to their individual probability distributions. The results suggest that the magnitude of gravity load, the strengths of reinforcement, and the reinforcement area in beams are the top three parameters, which significantly affect the progressive collapse performance of RC frame structures.
The aforementioned researches are all for frame structures. However, RC frame–wall structures are also frequently used in engineering practice, and the impact of shear walls on the behavior of these structures in resisting progressive collapse remains unclear. Previous experimental research regarding shear walls is more concerned with their hysteretic behavior, the degradation of strength and stiffness as well as the deformation capacity under cyclic loading [28, 29]. As for RC frame–wall structures against progressive collapse, numerical analysis is preferred. Shear walls can be simulated with high-fidelity numerical models [30, 31] or macro-based numerical models [32-36], with the shear walls represented using multilayered shell elements. The former can demonstrate the failure modes and mechanical behavior of the shear walls in detail but requires a tremendous computational time, and the latter can capture the main mechanical behavior of the shear walls with high computational efficiency. Recently, Yin et al. [37] experimentally and numerically studied the collapse behavior of 1/5 scaled RC frame–wall structures, revealing that components on the first floor of a frame-wall structure are more critical than those on the upper floors.
In summary, the resistance against progressive collapse and the load transfer mechanisms for RC frame structures under column removal scenarios have been clearly illustrated. In comparison, a few attentions were given to RC frame–wall structures. In this study, a multistory RC frame–wall structure is initially designed according to Chinese codes. Then the numerical model of the RC frame–wall structure is built with macro-elements and the modeling method is validated through available experimental results from the literature. Thereafter, the dynamic behavior of the global structure against progressive collapse under various column removal scenarios is investigated using IDA, and the impact of shear walls on the progressive collapse resistance is illustrated. Finally, the uncertainty analyses of the RC frame–wall structure are conducted, in which random variables include load, geometrical, and material parameters.
2 Validation of the Macro-Element Model
2.1 Brief Introduction to Collapse Test
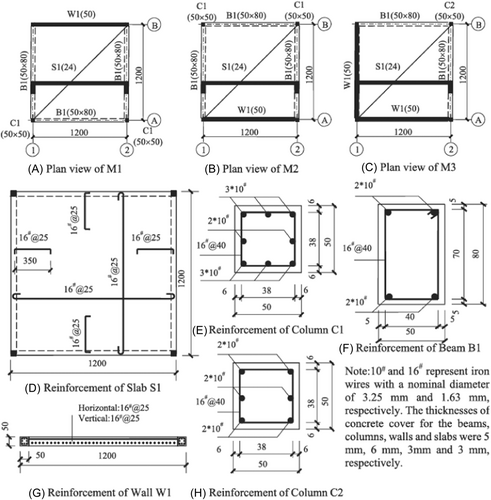
The collapse test of a frame-wall structure conducted by Yin et al. [37] is adopted to validate the numerical model using macro-elements. Figures 1 and 2 show the test setup and the geometric properties as well as reinforcement detailing of the RC members in the specimens, respectively. Three 1/5 scaled three-story RC frame–wall structures were tested under three collapse scenarios (M1–M3). The M1 scenario was used to assess the dynamic response resulting from column failure, while the M2 and M3 scenarios were employed to investigate the dynamic response under shear wall failure. The material properties for concrete and reinforcement are shown in Table 1. Additional mass blocks of 80 and 320 kg were applied to M1 and M3 specimens on each floor, corresponding to a surface load of 0.544 and 2.178 kN/m2.

| Concrete parameters | ||||||||
|---|---|---|---|---|---|---|---|---|
| Case | Elastic modulus Ec (×104 MPa) | Compressive strength fc (MPa) | ||||||
| M1 | ||||||||
| First floor | 2.9 | 46.2 | ||||||
| Third floor | 2.8 | 42.2 | ||||||
| Fifth floor | 2.7 | 37.5 | ||||||
| M2 | ||||||||
| First floor | 3.0 | 46.8 | ||||||
| Third floor | 2.9 | 44.3 | ||||||
| Fifth floor | 3.0 | 45.5 | ||||||
| M3 | ||||||||
| First floor | 2.8 | 43.1 | ||||||
| Third floor | 3.0 | 42.1 | ||||||
| Fifth floor | 2.7 | 43.0 | ||||||
| Steel reinforcement parameters | |||||
|---|---|---|---|---|---|
| Types | Diameter (mm) | Yield strength fy (MPa) | Ultimate strength fu (MPa) | Ratio of elongation (%) | Elastic modulus Es (×105 MPa) |
| 10# | 3.25 | 308.5 | 344.4 | 11.0 | 1.8 |
| 16# | 1.63 | 309.4 | 379.2 | 17.4 | 2.0 |
2.2 Finite element (FE) Model of the Frame-Wall Structure
As illustrated in Figure 2, the FE model is developed using LS-DYNA. All steel reinforcement in the columns and beams is modeled with an elastic–plastic–hardening model. For the concrete material in beams and columns, the keyword *MAT_PLASTICITY_COMPRESSION_TENSION is employed to represent the elastic–plastic behavior via yield stress versus plastic strain curves in compression and tension. In this material type, an isotropic elastic–plastic material where unique yield stress versus plastic strain curves can be defined for compression and tension with the variables LCIDC and LCIDT. The uniaxial stress–strain relationship for unconfined concrete follows the Chinese Standard (GB 50010-2010) [38] while the confined concrete core is described by Mander et al.'s model [39]. The *MAT_CONCRETE_EC2 model is adopted to model the slabs and shear walls. The corresponding uniaxial stress–strain curve of concrete is defined in accordance with Eurocode 2 [40]. The EC2 model can describe the plain concrete with a fraction of reinforcement (FRACR) = 0, reinforcement with FRACR = 1, or smeared RC with FRACR between 0 and 1. Response for plain concrete can be obtained by inputting variables RO, FC, and FT, while for reinforcement in shell elements, additional stress–strain relationships for steel reinforcement shall be defined. Detailed information on both two material types can refer to the LS-DYNA manual [41].
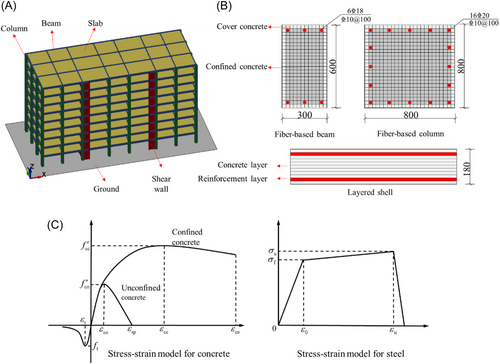
In the FE model, beams and columns are modeled with Hughes–Liu beam elements, of which the beam section consists of 36 integration points in the cover region and 64 points in the concrete core. The slabs and walls are represented by multilayered shell elements, of which the cross-section is composed of 12 layers, including 10 concrete layers, and 2 reinforcement layers. On the basis of the sensitivity analysis of mesh sizes, the mesh size for the fiber beam elements is set to 50 mm, while the one for the multilayered shell elements is 50 mm × 50 mm.
The ground is assumed as rigid using the keyword *MAT_RIGID, and the columns and walls at the ground are fixed via the keyword *CONTACT AUTOMATIC NODES TO SURFACE. The nonlinear dynamic analysis of the structure is conducted in two steps: (1) apply the gravity to the system with the keyword *LOAD_BODY_Z and (2) delete the specified columns or a shear wall at the ground story at a given time (1500 ms) with the keyword *MAT_ADD_EROSION to introduce initial failure.
2.3 Comparison Between Numerical and Experimental Results
As illustrated in Figure 2, the corner of the top story of each specimen was selected as a critical point to record the time–history of the displacement in the collapse test. Figure 3 shows the numerical and the experimental dynamic displacement curves of those points, and the comparison indicates that the numerical results for three different collapse scenarios exhibit good consistency with experimental results. As shown in Table 2, the average deviations for the M1, M2, and M3 scenarios between the numerical and experimental results during the dynamic collapse process are 13.6%, 12.5%, and 17.7%, respectively.

| M1 | M2 | M3 | |||||||
|---|---|---|---|---|---|---|---|---|---|
| Displacement (mm) | Displacement (mm) | Displacement (mm) | |||||||
| Time (ms) | Test | Modela | Relative deviation (%) | Test | Model | Relative deviation (%) | Test | Model | Relative deviation (%) |
| 400 | 154.7 | 114.0 | 26.3 | 53.8 | 34.4 | 36.0 | 9.77 | 8.75 | 10.4 |
| 600 | 346.1 | 272.8 | 21.2 | 161.2 | 142.0 | 12.0 | 12.32 | 9.77 | 20.7 |
| 800 | 631.1 | 598.5 | 5.2 | 513.0 | 517.9 | 0.9 | 38.07 | 22.84 | 40.0 |
| 1000 | 981.3 | 1164.5 | 15.7 | 1040.7 | 1236.2 | 15.8 | 73.29 | 63.52 | 13.3 |
| 1200 | 1543.2 | 1750.8 | 11.9 | 1846.9 | 2374.6 | 22.2 | 312.7 | 376.22 | 16.9 |
| 1400 | 2149.8 | 2174.3 | 1.1 | 2540.7 | 2574.9 | 0.2 | 859.94 | 552.12 | 35.8 |
| 1600 | 2570.0 | 2574.9 | 0.2 | 1070.03 | 879.48 | 17.8 | |||
| 1800 | 1358.31 | 1553.75 | 12.6 | ||||||
| 2000 | 2355.05 | 2550.49 | 7.7 | ||||||
| 2200 | 2589.58 | 2540.72 | 1.9 | ||||||
| Average deviations (%) | 13.6 | 12.5 | 17.7 | ||||||
- a Model represents numerical results.
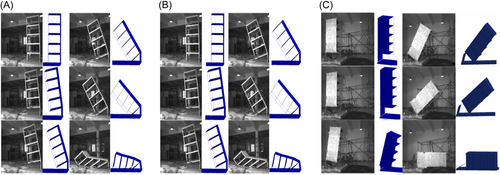
Moreover, Figure 4 compares the collapse modes between the numerical and the experimental results under three different scenarios. The comparison shows that numerical simulation can accurately represent the dynamic behavior of the frame-wall structure against progressive collapse. Therefore, it is confirmed that the numerical models using macro-elements for frame-wall structures, that is, the fiber-based beam elements for beams and columns, and the multilayered shell elements for shear walls and slabs, can capture the characteristics of both dynamic responses and failure modes of the frame-wall structures against progressive collapse.
3 Dynamic Analysis of RC Frame–Wall Structures Under Progressive Collapse
3.1 Typical RC Frame–Wall Structure Design
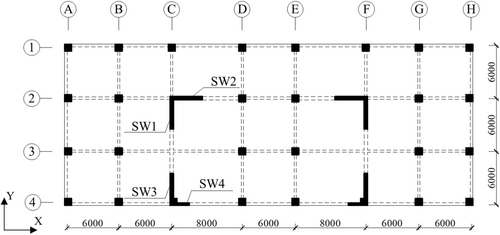
To investigate the structural performance of RC frame–wall structures against progressive collapse and the effect of shear walls on the collapse resistance, as illustrated in Figure 5, a nine-story RC frame–wall structure is initially designed following Chinese building codes [38, 42]. The structure is designed against a seismic intensity of 8° with a corresponding peak ground acceleration of 0.20 g, which has a 10% probability of exceedance in 50 years. The dead load (DL) is 7 kN/m2 (including the structure's self-weight), and the live load (LL) is 2 kN/m2. The height of the ground story and the other stories is 3.5 and 3.0 m, respectively. In the X-direction, the structure consists of seven spans, in which the lengths of the third and the fifth spans are 8000 mm, whereas the remaining span length is 6000 mm. In the Y-direction, there are four spans with an equal span length of 6000 mm. To enhance torsional resistance, shear walls are symmetrically arranged within the structure.
As illustrated in Figure 6, the cross-section of the columns is square with an edge size of 800 mm, while the beam sections are 300 mm wide and 600 mm deep, respectively. The slab thickness is 180 mm. The concrete cover is 35 mm for beams and columns, and 20 mm for slabs and shear walls. Concrete with strength grade C30 is employed and the corresponding uniaxial compressive strength of concrete is 23.7 MPa following Chinese code [38], and HRB400 steel bars with nominal yield strength of 400 MPa are used for all reinforcement. The longitudinal reinforcement of beams is 3  18 mm at the top and the bottom layer, respectively, the one of the columns is 16
  20 mm, respectively. The stirrups in beams and columns are detailed at
  10 mm@150 mm. Two orthogonal layers of steel bars with a diameter of 10 mm and a spacing of 200 mm are employed for slabs.
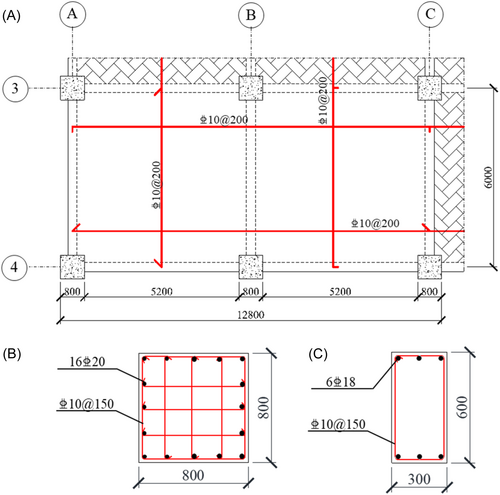
Figure 7 shows the geometric properties and reinforcement detailing of shear walls. The thickness of the shear walls is 300 mm for shear wall 4 (SW4) and 400 mm for SW1–3. Concrete employed for the shear walls is identical to that employed for the beams and columns. Shear walls are reinforced using steel reinforcement with strength grade HRB400 and HPB300, which have the nominal yield strengths of 400 and 300 MPa, respectively. Table 3 lists the reinforcement detailing of the shear walls.
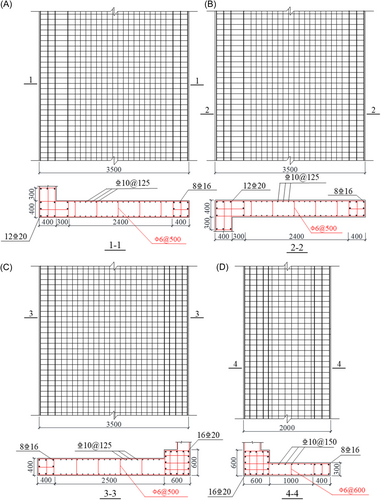
| ID | Width (mm) | Horizontal bars | Vertical bars | Lacing wire |
|---|---|---|---|---|
| SW1 | 400 |  12@125 12@125 |
 10@125 10@125 |
 6@500 6@500 |
| SW2 | 400 |  10@125 10@125 |
 10@125 10@125 |
 6@500 6@500 |
| SW3 | 400 |  10@125 10@125 |
 10@125 10@125 |
 6@500 6@500 |
| SW4 | 300 |  10@150 10@150 |
 10@150 10@150 |
 6@600 6@600 |
- Abbreviation: SW, shear wall.
The nonlinear dynamic analysis of the prototype RC frame–wall structure is conducted following the US code [43, 44]. The design load for analysis is the load combination 1.2 × DL + 0.5 × LL, which is 9.9 kN/m2 for the current study. Moreover, the IDA analysis is carried out by increasing the load factor and hence the combined load.
3.2 Introduction to the FE Model
As illustrated in Figure 8, the FE model follows the same modeling scheme as described in Section 2.2. The element types and the integration points in the cross-sections of the structural components are identical to those in Section 2.2. For the fiber beam elements, a mesh size of 0.25 m is adopted, while for the multilayered shell elements, the mesh size is 0.25 m × 0.25 m. The material parameters of this model are provided in Table 4.
| Concrete parameters | Steel parameters | ||
|---|---|---|---|
| Grade | C30 | Grade | HRB400 |
| Concrete compressive strength fc (MPa) | 23.7 | Yield strength fy (MPa) | 400 |
| Ultimate strength fu (MPa) | 540 | ||
| Elastic modulus Ec (×104 MPa) | 3.4 | Ratio of elongation (%) | 20 |
| Elastic modulus Es (×105 MPa) | 2.0 | ||
Beam elements are subject to a failure criterion determined by effective plastic strain. For beams and columns, the fiber-based beam elements are eroded once the ultimate compressive strain of unconfined or confined concrete reaches 0.004 or 0.005, respectively, or when the ultimate tensile strain of the reinforcement reaches 0.20. The failure for shell elements is determined by the maximum principal strain. If the strain of the concrete and reinforcement reaches 0.033 and 0.20, respectively, the shell elements are deleted.
Following the removal of one or multiple columns, the structure initially deforms in an elastic state, gradually moves to a plastic state, and eventually, the collapse of the structure is triggered. In the entire deformation process, it is difficult to use a constant global damping ratio to accurately describe the decaying vibration after the structure reaches the maximum deformation at a certain plastic state. Therefore similar to Gan et al.'s [45] work, the damping is not considered in the FE model of the designed RC frame–wall structure, and the results of the analyses are conservative for the design of structures against collapse.
In accordance with UFC 4-023-03 [43], the maximum chord rotation θm at the beam end is 0.2 rad provided that large deformation such as catenary action can be mobilized. This rotation is computed by the ratio of the column displacement to the clear span of the connected beams. Complying with the specified rotation limit, the collapse criterion for the structure is that the displacement difference of the two ends of the beam with the shortest span directly above the failed member reaches 20% of the span length.
3.3 Case Study of Single- and Double-Column Removal Scenarios
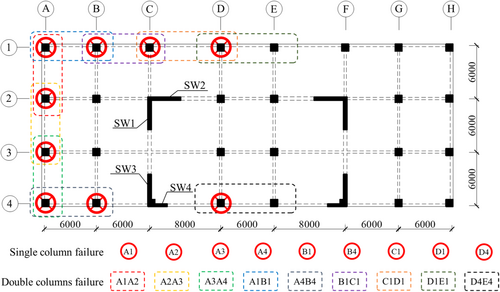
The external columns on the ground floor are at greater risk of terrorist attacks and other accidental loads. Therefore, the removal of the columns in the perimeters of the structure is employed to investigate structural behavior. To thoroughly evaluate the collapse resistance of a typical RC frame–wall structure, single-column and double-column removal scenarios are adopted. Moreover, because shear walls are located inside the building and have much greater lateral strength than the columns, the initial failure of the shear wall is not considered in this study.
As shown in Figure 9, considering the symmetry of the structure, there are nine cases to conduct the analysis of a single external column removal scenarios: A1, A2, A3, A4, B1, B4, C1, D1, and D4. Meanwhile, the double-column removal scenarios also include nine cases: A1A2, A2A3, A3A4, A1B1, A4B4, B1C1, C1D1, D1E1, and D4E4.
- 1.
Apply the gravity load with load combination (1.2DL + 0.5LL) multiplied by a given load factor α to floors of the structure. The global structure gravity load is conducted gradually with the keyword *LOAD_BODY_Z in 1500 ms.
- 2.
Conduct the nonlinear dynamic analysis induced by a column removal scenario with the keyword *MAT_ADD_EROSION at a given time (1500 ms). If the maximum vertical displacement does not reach the collapse criterion, the load factor α is increased.
- 3.
Repeat Steps 1 and 2 until the collapse is triggered.
- 4.
Once the collapse criterion is reached, record the corresponding load factor α and the peak vertical displacement of the node above the removed column, which reflects the maximum vertical displacement Δ of the overall structure.
4 Progressive Collapse Analysis Results
4.1 Results of IDA
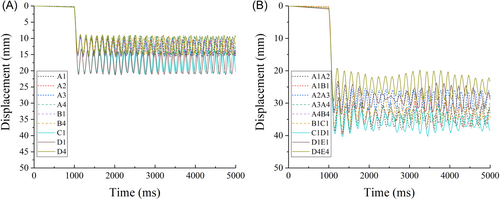
Figure 10 demonstrates the time-history of displacement under different column removal scenarios and the specified design load (i.e., 1 × (1.2DL + 0.5LL)). As the prototype structure exhibits sufficient redundancy in resisting collapse, the displacement limits corresponding to collapse are not reached for all cases, indicating that the designed structure is quite robust under single or double-column removal scenarios. The maximum vertical displacement can serve as an indicator of the potential for overall collapse under the specified design load. Accordingly, Table 5 lists the maximum vertical displacements of all cases. As expected, the maximum displacement induced by double-column removal is much larger than that by single-column removal. Under the design load, the maximum vertical displacements under single-column removal of C1 and D1 are 20.8 and 21.0 mm, respectively, which are the largest among all single-column removal scenarios. This is because the length of the span C1-D1 is 8000 mm, which is greater than that of the other spans. In comparison, the maximum displacement of the structure under other single-column removal scenarios is around 15.0 mm.
| Case | Maximum vertical displacement (mm) | Case | Maximum vertical displacement (mm) |
|---|---|---|---|
| A1 | 15.3 | A1A2 | 36.4 |
| A2 | 15.5 | A1B1 | 36.5 |
| A3 | 15.3 | A2A3 | 31.7 |
| A4 | 15.0 | A3A4 | 37.6 |
| B1 | 15.4 | A4B4 | 35.2 |
| B4 | 14.8 | B1C1 | 35.1 |
| C1 | 20.8 | C1D1 | 38.6 |
| D1 | 21.0 | D1E1 | 31.6 |
| D4 | 15.1 | D4E4 | 26.7 |
For double-column removal scenarios, the removal of C1D1 causes the greatest vertical displacement, which is attributed to the largest length of the remaining span between the two removed columns. In comparison, with the same length of the span, the maximum vertical displacement under the D4E4 removal scenario is smaller than that under the other scenarios. This is because shear walls positioned on the perimeter can limit the deformation of the remaining structure. This will be further discussed in Section 4.2 in detail.
Figure 11 shows the IDA results depicting the relationship between the maximum vertical displacement and the load factor α, which is defined as the ratio of the applied gravity load to the design load (1.2 × DL + 0.5 × LL). Due to seismic design with appropriate reinforcement detailing, the overall structural behavior is highly ductile in resisting progressive collapse caused by all column removal scenarios. After the yielding of reinforcement, the structure can still deform in a large range with hardening resistance until reaching the collapse criterion.
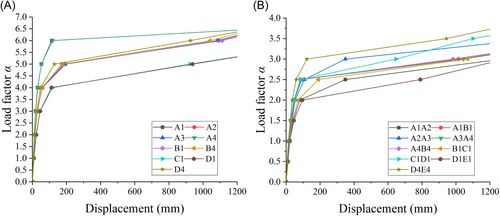
According to the IDA results, the resistance under the C1 and D1 removal scenarios is similar. This is because the directly affected region (DAR) above column C1 or D1 is identical. Moreover, removing column C1 or D1 causes larger displacement and thus a higher risk of collapse than the other cases. Under double-column removal scenarios, the D1E1 removal scenario results in the largest maximum displacement under the same load, corresponding to the highest risk of collapse in all double-column removal scenarios.
4.2 Effect of Shear Wall
The cracking pattern observed in the structure under various column removal scenarios illustrates potential load transfer mechanisms in the DARs above the removed columns. In the developed numerical model, the cracking pattern of the layered shell elements is depicted by the current crack opening strain. For simplicity, only single-column removal scenarios B1 and B4 as well as double-column removal scenarios D1E1 and D4E4 are demonstrated. This is because the DAR under B1 or B4 column removal scenario has the same geometric and material properties as well as design load, but the one under B4 removal is constrained by shear wall SW3. The comparison of the two above cases can be used as a typical example to investigate the effect of shear walls on the progressive collapse resistance following the removal of a single column. Likewise, to include the impact of the shear walls, double-column removal scenarios D4E4 and D1E1 are eventually employed.
Figure 12 demonstrates the crack pattern of the global structure under B1 removal and B4 removal scenarios through increasing load factor. It is evident that all the cracking is concentrated on the DAR above the removed column, and the remaining structure remains intact and serves as the boundary constraint to the DAR. Figure 13 illustrates the details of the crack pattern of the slabs in the DAR using crack opening strain contours under B1 and B4 column removal scenarios. As two adjacent sides of the DAR are free and the other two sides are constrained, the crack pattern of the slabs is not symmetric. Moreover, such crack patterns are quite similar to the experimental yield line pattern of the beam–slab assembly with two adjacent free edges [11], as seen in Figure 14, suggesting that the flexural action is the main load transfer mechanism.
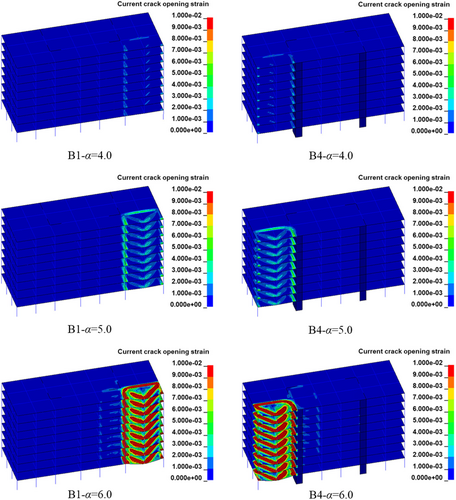
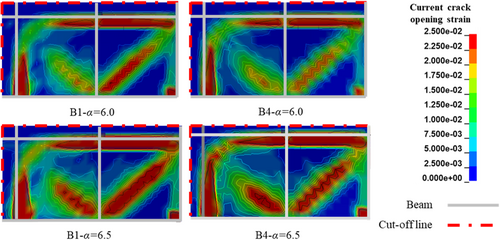
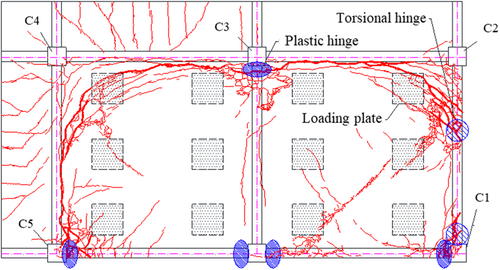
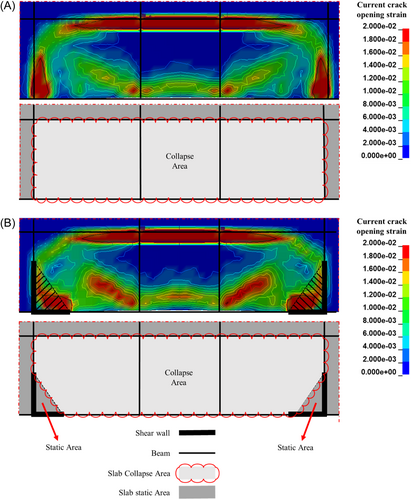
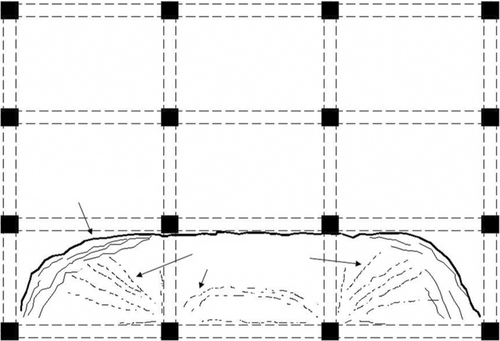
Figure 15 illustrates the development of the crack pattern of the global structure under D1E1 and D4E4 removal scenarios. Again, the main damage is concentrated in the DAR above the removed columns, which consists of three slab panels, three longitudinal beams along the X-direction, and two transverse beams along the Y-direction. Figure 16 demonstrates the crack patterns at the DAR in detail. It is seen that cracks are mobilized along the edges of the boundary beams due to negative bending moment, and diagonal crushing lines in the two outmost panels due to positive bending moment. Moreover, such crack patterns are very similar to the ones obtained from the experiment [15], as shown in Figure 17, suggesting that the dominant load transfer mechanisms are the flexural action and tensile membrane actions of the slabs.
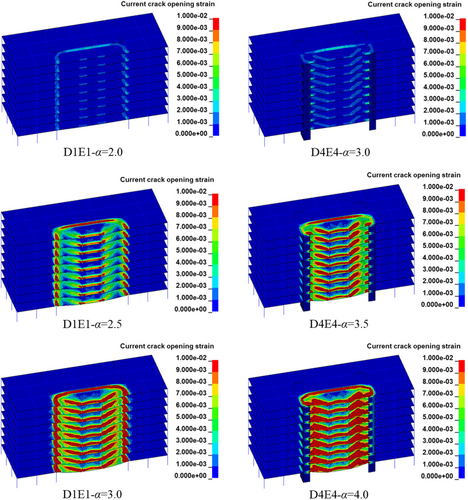
As α = 3.0, the maximum vertical displacements of the DAR under D1E1 and D4E4 scenarios are 1310.3 and 135 mm, respectively. Accordingly, the cracking extent in the DAR under D1E1 is much more severe than that under D4E4, as shown in Figure 15. When α = 4.0, the maximum vertical displacement of the D4E4 removal scenario is 1261.3 mm, resulting in the full mobilization of cracks in the slabs. In comparison, the structure under D1E1 reaches collapse under the gravity load with α = 4.0. Overall, the progressive collapse resistance under the D4E4 scenario is around 30% greater than that under the D1E1 scenario.
The comparison of D1E1 and D4E4 removal scenarios indicates that the shear walls have a significant influence on structure deformation as the walls strengthen the boundary conditions of the remaining structure. As illustrated in Figure 16, the presence of shear walls located on the external edges of the structure results in a reduction of the beam span length and the deformable slab area of the DAR under D4E4 removal scenarios as compared with the D1E1 removal scenario. The maximum beam span of the DAR under the D4E4 removal scenario is 22,000 mm, only 81.8% of that under the D1E1 removal scenario. Reduction of the beam span length increases the yield capacity, which can be expressed as (M1 + M2)/Ln. (In this equation, M1 and M2 denote the moment capacities at the ends of the beam, and Ln denotes the span of the beam.) Furthermore, the area of the slab in the DAR involved in large deformation under the D4E4 scenario is 94.7% of that under the D1E1 removal scenario. On the basis of the strain contours, it is clear that the presence of the shear walls has resulted in a change in the position of the plastic hinges in the edge beams and the slab. Consequently, based on the yield line theory, the calculated bearing capacity is expected to increase significantly.
In conclusion, the shear walls enhance progressive collapse resistance by reducing the deformable region of the DAR. This effect is observed when the shear walls are situated at the external edges of the structure, thereby directly influencing the boundary conditions of the remaining structure.
4.3 Uncertainty Analysis in RC Frame–Wall Structure
To assess the significance of multiple parameters on the structural response, this section conducts sensitivity analyses based on the developed numerical model. On the basis of previous studies [26, 46-48], three groups of 13 parameters are selected for the analyses, as shown in Table 6: (1) material parameters (e.g., fc, fy, fu, Es, and εu), (2) geometrical parameters (e.g., L, b, h, t, Asb, and Asc), and (3) load parameters (e.g., DL and LL). The probability distribution, the average value (μ), and the coefficient of variation (δ) of each parameter are presented in Table 6 as well.
| Category | Random variable | μ | δ (%) | Distribution |
|---|---|---|---|---|
Material parameters |
Concrete compressive strength (fc) | 26.5 MPa | 18 | Lognormal [49, 50] |
| Yield strength of steel (fy) | 400 MPa | 9.3 | Beta [46] | |
| Ultimate strength of steel (fu) | 540 MPa | 8.0 | ||
| Elastic modulus of steel (Es) | 200 GPa | 3.3 | Normal [46] | |
| Fracture strain of steel (εu) | 12% | 15 | ||
Geometrical parameters |
Span length (L) | 6000 mm | 0.30 | Normal [47] |
| Beam width (b) | 300 mm | 0.75 | ||
| Beam height (h) | 600 mm | 0.54 | ||
| Reinforcement area in columns (Asc) | 314.2 mm2 (d = 20 mm) |
4.0 | ||
Reinforcement area in beams (Asb) |
254.5 mm2 (d = 18 mm) |
4.0 | ||
| Concrete cover thickness (t) | 20 mm | 5.0 | Normal [51] | |
| Load parameters | Dead load (DL) | 7 kN/m2 | 10 | Normal [52] |
| Live load (LL) | 2 kN/m2 | 40 | Gamma [53] |
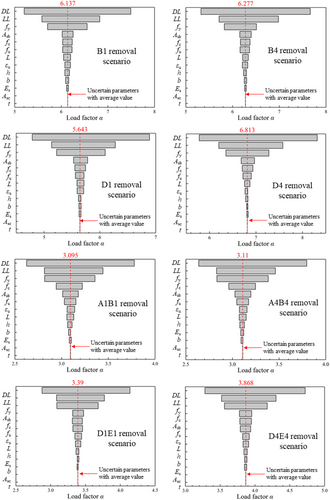
The tornado diagram is an effective method to illustrate the sensitivity of the uncertainty parameters. This method involves setting three representative values for each uncertain parameter, including the upper, base, and lower values. When a specific uncertain parameter is studied, the other uncertain parameters are kept unchanged. The sensitivity of the studied parameter is quantified by calculating the change in dynamic responses of the model. In tornado diagrams, the difference in model response due to the variation of each parameter is ranked in order from the largest one to the smallest one. Accordingly, the sensitivity of each parameter is measured by the difference in model response.
To investigate the sensitivity of each parameter out of the 13 uncertain parameters, three values of that parameter will be concerned, including the mean value, and the upper and lower limit values obtained by adding ± standard deviation to the mean value μ, respectively. As a result, to conduct the sensitivity analysis for each column removal scenario, a total of 2 × 13 + 1 = 27 cases are required, in which the additional one case is for the structural model with the mean values of all parameters. The ranking of the parameter sensitivity depends on the maximum value of α for the structure, that is, the value of α corresponding to the maximum allowed vertical displacement.
For single-column removal scenarios, the selected cases are B4 and D4 (which are directly adjacent to the shear walls) and B1 and D1 (which are not adjacent to the shear walls and serve as the basis for comparison). Likewise, for double-column removal scenarios, the selected cases are A4B4 and D4E4 (which are directly adjacent to the shear walls) and A1B1 and D1E1 (which are not adjacent to the shear walls and serve as the basis for comparison).
Figure 18 shows that the uncertainty of the load parameters has the most significant effect on structural response against progressive collapse among the three groups of uncertain parameters. The most influential material parameter is fy, followed by fc and fu. This is because both fy and fc affect the flexural strength of the structures, and fu controls the ultimate capacity to resist progressive collapse at the large deformation stage. The uncertainty of Asb exerts the largest influence among the geometrical parameters, suggesting that the longitudinal reinforcement in beams is very critical in resisting progressive collapse. Both the development of flexural strength and catenary action depend on the amount of beam reinforcement. Uncertainty of L, h, and b varies under different scenarios, but their overall effect is not evident. Finally, the structure exhibits small sensitivity to εu, Es, Asc, and t.
5 Conclusions
- 1.
Macro-based numerical scheme is effective for simulating the global dynamic responses of RC frame–wall structure to progressive collapse under different scenarios of column removal, which significantly decreases computational time. For M1 to M3 scenarios, the average errors between the numerical and experimental results during the collapse process range from 12.5% to 17.7%.
- 2.
Under design load (1.2DL + 0.5LL), removing a single or two adjacent columns does not trigger the occurrence of progressive collapse. The IDA results indicate that shear walls at the perimeter of the structure can effectively mitigate the vertical displacement of the structure in the event of external column removal through strengthening the boundary constraints of the remaining structure and reducing the deformable area of the DAR. The results also show that, for scenarios involving columns adjacent to shear walls, there is an increase in the load capacity by about 30%.
- 3.
The uncertainty analysis results indicate that DL, LL, yield strength of reinforcement (fy), compressive strength of concrete (fc), reinforcement area in beams (Asb), and ultimate strength of reinforcement (fu) are the most significant parameters for frame-wall structures to resist progressive collapse, suggesting longitudinal reinforcement of beams is extremely vital to progressive collapse resistance.
Although accidental load may not completely and suddenly damage the entire column, this paper still adopts sudden column removal scenarios to investigate the progressive collapse performance of the frame-wall structures in the context of external explosions. In general, the external columns of a structure will retain some bearing capacity and will not completely fail as a result of the blast impact. Future research should explicitly include the effect of blast loading and compute the dynamic responses of the global structure following the blast loading.
Acknowledgments
The authors are grateful for the financial support by National Natural Science Foundation of China (Grant No. 52378490) and the National Key Research and Development Program of China (Grant No. 2021YFC3100700).
Conflicts of Interest
The authors declare no conflicts of interest.


