Effect of the change of foundation stiffness on the dynamic characteristics of base-isolated structure
Abstract
The safety of an isolated structure built on the soft soil ground under the action of earthquakes is of major concern because the current seismic design of isolated structures has not considered the motions of the foundations caused by the effects of the soil-isolated structure dynamic interaction (SISI). On this basis, a shaking-table test method for base-isolated structures on change of soil foundation stiffness was proposed and implemented. The foundation stiffness was controlled by the duration compression ratio and intensity of the input ground motion based on the influence of the increase in the excess pore water pressure ratio on the stiffness of the saturated sandy foundation. Meanwhile, the influence laws of foundation stiffness on the dynamic characteristics of base-isolated structures were summarized and analyzed. The results showed that the first-order natural frequency of base-isolated structures on change of foundation stiffness decreased with an increase in the relative stiffness ratio of the structure–soil foundation (Rs), while its damping ratio increased significantly. The seismic isolation efficiency of the seismic isolation layer and the amplification effect on the rotational angular acceleration of the pile cap were significantly weakened. Meanwhile, under the same conditions, for the soil foundation with relatively small stiffness, the amplitudes of the bending moment and horizontal lateral displacement in the middle and upper parts of the pile remarkably increase because of the effects of the ISI. The research results of this test provide a certain scientific basis and reference for the seismic design of base-isolated structures considering the SISI effects.
1 INTRODUCTION
The base-isolated structure system, which is an effective, economical, and practical new technology, has been widely used in the seismic design of building structures to achieve seismic resistance. However, in the existing design of isolated structures, the effects of soil–structure interaction (SSI) are usually neglected because of the assumption of a rigid foundation1-4; in other words, the influence of SSI effects on the dynamic response characteristics of the superstructure is ignored. For isolated structures built on bedrock or rigid foundations, the above assumption has little effect on the structures' dynamic response. However, when isolated structures are located on a soft soil foundation, there is a strong scattering diffraction effect on the input motion. In this case, the inertial force reaction of the superstructure owing to the action of ground motion cannot be ignored and the assumption of a rigid foundation is not taken granted. Complex seismic wavefields in the soil foundation under the action of multiple factors affect the dynamic characteristics of isolated structures. Furthermore, the strength of isolated structures' seismic response and its laws change accordingly.5-8 In extreme situations, this may become a controlling factor affecting the design of the relevant isolated structure. In addition, under the action of the site effect, the seismic response of an isolated structure built on a soft soil foundation is severely aggravated, which is also related to an increase in the flexibility of the superstructure and a decrease in the fundamental frequency. Considering this, the code of design for isolated structures in Japan states that in the case of soft ground, the building-foundation interactions are likely to have a considerable effect on the spectrum characteristics of the input ground motion, enabling long-period ground motions.5, 9, 10 Therefore, further research on the dynamic characteristics of isolated structures on flexible foundations is needed as it has scientific value, particularly for predicting the seismic damage distribution of isolated structures, improving their working performance, and prolonging their lifecycle.
Many scholars have attempted to investigate the dynamic characteristics of isolated structures on flexible foundations. The main research methods can be divided into theoretical analyses, numerical simulations, and model tests. In terms of theoretical analyses and numerical simulations, Constantinou et al.,11 Novak et al.,12 and Pender et al.13 used different simplified analytical models to investigate the influence of SSI effects on the dynamic characteristics of isolated structures and validated the importance of considering SSI effects in isolated structure systems. Perez et al.,14 Luco,15 and Spyrakos et al.16 simulated SSI effects by using spring-damping systems and established a relevant theoretical and analytical model to investigate the influence of SSI effects on the seismic response of isolated structures. Based on the coupling method of the finite element boundary element, Cho et al.17 established a soil-structure dynamic interaction system analysis method and verified the feasibility and accuracy of this method by studying the seismic response of isolated structures. However, most above existed research results and conclusions have not been verified by the credible model tests. To verify the existing findings and conclusions, Zhuang et al.18 and Yu et al.6, 19 carried out a series of shaking-table tests of base-isolated structures on rigid, hard-soil, and soft-soil foundations to compare and analyze the influence of model foundation changes on the seismic isolation efficiency of the seismic isolation layer and dynamic response laws of the isolated structure. Li et al.7 investigated the seismic response characteristics and seismic isolation effects of a high-rise isolated structure on a soft soil foundation using a shaking-table test and provided an experimental basis for subsequent theoretical analyses.
Although research on this problem has made rapid progress in various aspects, the internal relationship between the stiffness of soil foundations and the dynamic characteristics of the isolated structure has not yet been established. The lack of systematic research results is due to the limited number of model tests on the dynamic interaction of soil-isolated structures. Consequently, based on shaking-table tests of soil-isolated structure dynamic interaction (SISI) that have already been conducted, this study further designed a model test of a base-isolated structure on a saturated sandy foundation. In this model test, the stiffness of the saturated sandy foundation was a variable, which was achieved by controlling the compression ratio of duration time and the intensity of the input ground motion for changing the different development rates of the dynamic pore pressure ratio. In addition, some variables, such as the soil dynamic pore pressure, pile dynamic strain, dynamic acceleration, and displacement of the isolated structure, were effectively measured during the change in foundation stiffness. Subsequently, the influence laws of the dynamic characteristics of isolated structures on change of foundation stiffness were analyzed and validated by combining them with the results of a series of shaking-table tests of isolated structures on different soil foundations.
2 SHAKING-TABLE TEST MODEL
2.1 Similarity ratio of the model system
In the shaking-table model test of the soil–structure dynamic interaction, it is almost impossible to design the entire model test under a completely consistent similarity ratio system owing to the involvement of two or more materials. In this paper, the geometric length, elastic modulus, and acceleration were selected as the basic physical quantities of the model structure, and the shear-wave velocity, density, and acceleration were selected as the basic physical quantities of the model soil foundation. And then, the similarity ratios of other physical quantities could be deduced according to Buckingham's theorem.6
The geometric similarity ratio of the SSI system are shown in Table 1. And to ensure that the stiffness of the soil can be changed, previous studies have proven that the duration of the input ground motion should not be shortened severely,20 and the time similarity ratio of the model soil foundation was 1.
| Type | Physical quantity | Similarities | Similarity ratio | |
|---|---|---|---|---|
| Model structure | Model foundation | |||
| Geometric characteristics | Length | 1/20 | 1/20 | |
| Displacement | 1/20 | 1/20 | ||
| Material properties | Elastic modulus | 1 | / | |
| Equivalent density | 20 | 1 | ||
| Quality | 1/400 | / | ||
| Stress | 1 | / | ||
| Shear velocity | / | 1/2 | ||
| Shear modulus | 1 | 1/4 | ||
| Effective vertical earth pressure | / | 1/4 | ||
| Dynamic characteristics | Stiffness | 1/20 | / | |
| Time | 1/4.47 | 1 | ||
| Frequency | 4.47 | 1 | ||
| Acceleration | 1 | 1/4 | ||
| Pore-water pressure | / | 1/16 | ||
2.2 Model structure and model soil foundation
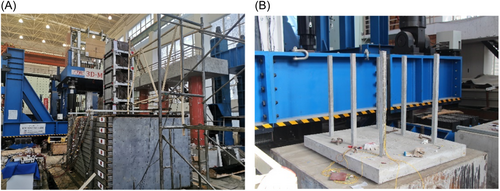
The structure model consisted of a base-isolated structure, an isolation bearing and a concrete pile group foundation. The isolated structure model was designed as a four-story steel frame system due to the limitations of the existing test conditions (Figure 1A). The ratio between the height and the width of the isolated structure was 2.625 in the vertical direction. The isolation bearing adopted a 100-mm-diameter lead-rubber bearing, which connected the four-story steel frame system with a concrete pile group foundation underneath. The concrete pile group foundation consisted of a pile cap and six 0.8 m (in length) piles with a 0.035 × 0.035 m square section each (Figure 1B). The pile cap was designed as a rigid concrete block with the dimensions of 1.2 × 1.0 × 0.1 m. The upper surface of the pile cap was equipped with embedded parts for connecting the isolation bearing. The superstructure, including the four-story steel frame system and the isolation bearing, was fixed to the embedded parts by anchor bolts.
-
100-mm-thick clay for the overburden undrained layer (Layer 1);
-
700-mm-thick liquefiable saturated loose sand-soil layer, which had a significant impact on the variation of stiffness ratio between the pile and the soil foundation (Layer 2);
-
300-mm-thick hard clay layer, which was made to model the supporting layer of the pile foundation with the pile end penetrating into this layer for 100 mm (Layer 3);
-
200-mm-thick gravel layer, which was made to avoid the dynamic sliding between the soils and the bottom of the soil box through increasing the friction force between them (Layer 4).
Overall, the dimensions of the soil foundation were 3.5 m (L) × 2 m (W) × 1.3 m (H). The clay with a certain thickness was overlaid on top to simulate the overlying undrained soil layer (Layer 1); saturated loose sand soil was used to create a model foundation layer (Layer 2). Clay and gravel layers of a certain thickness were set below the saturated sand–soil layer to simulate the impermeable layer (Layer 3 and Layer 4). In this test, the “raining sand” method is used to fill the sand soil, and the homogeneity of the sand soil has been guaranteed by filtering, screening, and full mixing in the production process.
To avoid an increase in the local density of the soil foundation, which was caused by the gravity of the pile foundation and superstructure during the installation process, a traveling crane was used to keep the pile foundation before filling the soil and was removed when the model soil foundation was completed. The soil container used in the test was a laminar shear box, and the internal clearance size of this box was approximately 3.5 m (vibration direction) × 2.0 m (vertical to the vibration direction) × 1.7 m (height). Horizontal relative deformation could be generated freely between the steel frames of each layer of the model box, which efficiently reduced the reflected wave on the boundary. Also, the adverse boundary effects of the soil container could be ignored.21 Therefore, it could be used to simulate the boundary conditions of a model soil foundation. The complete model of the soil foundation and superstructure are shown in Figure 1A.
Before the test, the model soil foundation was measured for indoor testing. The water content of the clay in the surface layer of the soil foundation was 30.8%–33.7%, and its density was 1.78 g/cm3. The water content of the saturated sand was 40.5%–41.3%, which was greater than that of the dense sand–soil foundation made in the previous model test.18 The main distribution range of the sand particle size was 0.075–1.0 mm. The water content of the hard clay in the lower part of the soil foundation was 8.3%–9.2%, and its density was 1.87 g/cm3. The initial hysteretic damping and the Poisson's ratio of the soil foundation were 9% and 0.33, respectively.
2.3 Measurement points and loading method
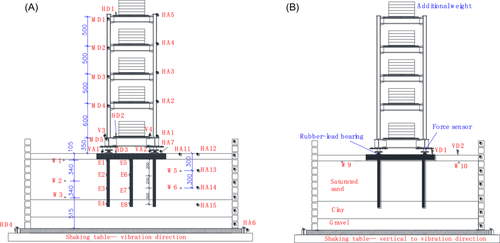
In this test, it is necessary to measure the acceleration, the pore-water pressure, the strain response, and so on. Given that the vibration direction of the model system was in the longitudinal direction of the isolated structure, one observation section was set along the vibration direction of the model system (shown in Figure 2A) and the other was vertical to the vibration direction (shown in Figure 2B). In Figure 2, MD denotes the marker for the noncontact dynamic displacement testing technique to measure the displacements of the isolated structure.22 HD and VD denote the laser displacement meter to measure the horizontal and vertical displacements of the seismic isolation layer and pile cap; HA and VA denote the accelerometer to measure the horizontal and vertical acceleration responses of the interaction system; E denotes the fiber Bragg grating (FBG) to measure the strain responses of the pile; and W denotes the pore water pressure meter to measure the dynamic pore pressure responses of the soil foundation.
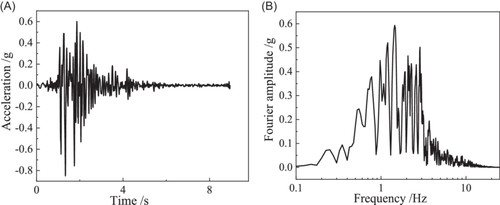
The seismic wave selected in this model test was the Kobe wave, a representative near-field earthquake motion recorded by the Kobe Marine Observatory in the 1995 Osaka-Kobe earthquake in Japan. The Kobe wave used in this test was an S-N horizontal acceleration record, with an original peak value of 0.85 g, and a strong motion remained for approximately 10 s. According to the classification standard of ground motion in Tso et al.,23 the PGA/PGV ratio of a high-frequency wave is greater than 1.2, while that of a low-frequency wave is less than 0.8, while the others are medium-frequency waves. The PGA/PGV ratio of the Kobe wave was 0.93; therefore, it was a medium-frequency seismic wave. Based on the time similarity ratio of the test model, the time step of the input motion was adjusted to 0.0045 s (the original time step was 0.02 s). The acceleration of the input motion and its corresponding Fourier spectrum are shown in Figure 3.
To determine the dynamic characteristics of the base-isolated structure on change of foundation stiffness, its natural frequency and damping ratio can be obtained by using white noise with an input PGA of 0.05 g (WN1–WN5) to scan the interaction system both before and after each conditional loading. As shown in Table 2, the measured PGAs at the shaking table under the conditions of KB1–KB4 are 0.1, 0.2, 0.3, and 0.5 g, respectively. The time interval between each loading condition was greater than 50 min to ensure the full dissipation of the excess dynamic pore water pressure in the model soil foundation.
| Serial number | Condition number | Seismic waves | Input PGA (g) |
|---|---|---|---|
| 1 | WN1 | White noise | 0.05 |
| 2 | KB1 | Kobe wave | 0.1 |
| 3 | WN2 | White noise | 0.05 |
| 4 | KB2 | Kobe wave | 0.2 |
| 5 | WN3 | White noise | 0.05 |
| 6 | KB3 | Kobe wave | 0.3 |
| 7 | WN4 | White noise | 0.05 |
| 8 | KB4 | Kobe wave | 0.5 |
| 9 | WN5 | White noise | 0.05 |
3 DYNAMIC RESPONSE ANALYSIS OF CHANGE OF FOUNDATION STIFFNESS AND PILE FOUNDATION
| Conditions | Predominant frequency f (HZ) | Shear-wave velocity vs (m∙s−1) | Relative stiffness ratio Rs |
|---|---|---|---|
| WN1 | 12.22 | 63.54 | 0.153 |
| WN2 | 11.95 | 62.14 | 0.157 |
| WN3 | 11.75 | 61.10 | 0.159 |
| WN4 | 10.52 | 54.70 | 0.178 |
| WN5 | 8.72 | 45.35 | 0.215 |
3.1 Seismic settlement of the model foundation
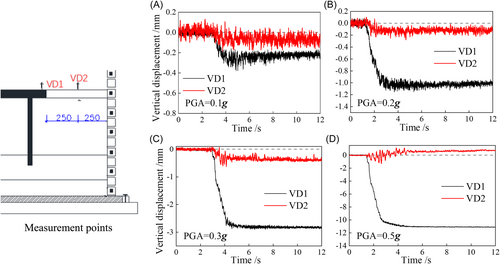
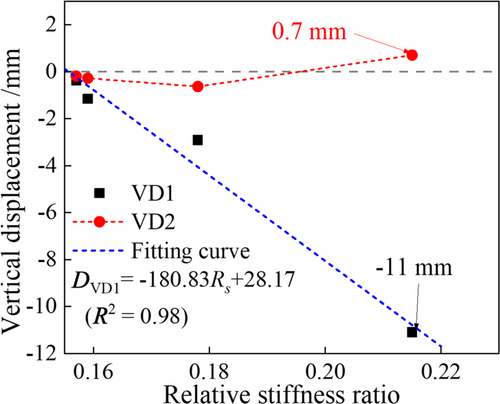
The vertical displacements of pile cap VD1 and soil ground surface VD2 under different conditions are shown in Figure 4, and the fitting curve between the seismic settlement of VD1 and VD2 on change of foundation stiffness and Rs is shown in Figure 5. It can be seen from the results that seismic settlement of the pile cap increases monotonically along with the increase of the input PGA and Rs. Under conditions KB1 and KB2, the seismic settlements of the pile cap and ground surface are within 1 and 0.3 mm, respectively, while the seismic settlement of the pile cap increases significantly under conditions KB3 and KB4, with a maximum value of 11 mm. The ground surface under condition KB4 first produces a slight settlement, followed by a certain uplifting-displacement phenomenon. This response has a maximum of 1.1 mm, finally stabilized at approximately 0.7 mm. The main reason for this uplift phenomenon is that with an increase in the seismic settlement of the pile cap, the differential settlement between the pile cap and its surrounding soil becomes increasingly obvious, which leads to the near-surface soil around the pile cap being squeezed by the soil below. Meanwhile, based on the definition of foundation bearing characteristics and their failure types in soil mechanics, it is demonstrated that the overall shear failure of the model foundation may have occurred under the condition of a relatively large Rs, resulting in rapid settlement of the pile cap and extrusion and uplifting of the soil foundation surface.
3.2 Dynamic response of pile foundation
3.2.1 Bending moment response of pile foundation
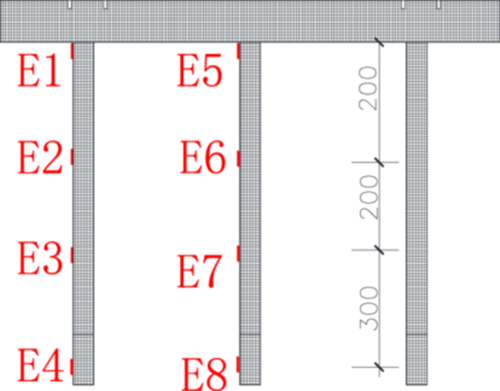
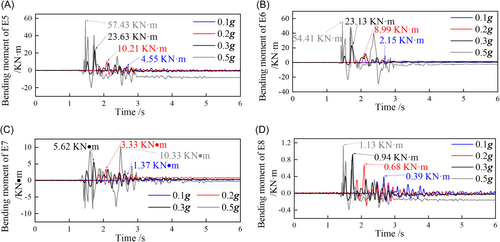
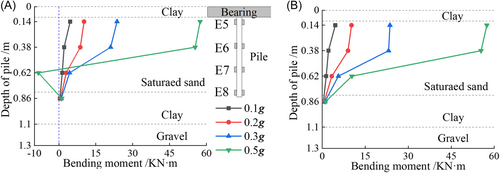
It can be seen from Figure 7 that with the gradual increase in the input PGA and the continuous increase in Rs, the ability of the model foundation to resist lateral deformation is significantly reduced, owing to the softening of its soil properties. The pile foundation has a certain degree of residual bending moment at each measurement point because it has to bear the thrust force exerted by the soil foundation, and the residual bending moment in the middle and upper parts of the pile is relatively large; for example, the residual value at the pile top is up to 8.15 kN. Consequently, under the action of a strong earthquake, there is a large shear deformation in the pile, and the working state in the middle and upper parts of the pile enters the plastic stage, which means that severe earthquake-damage is very likely to occur. This phenomenon is consistent with the general law of earthquake-damage observations. Furthermore, with an increase in the input PGA, the peak values of the bending moment at each part of the pile increased significantly under the coupling action of the saturated sand–soil layer amplification effect and soil foundation stiffness variation, and this increase was more pronounced in the middle and upper parts of the pile. For example, the peak value of the bending moment at the top portion of the pile with PGA = 0.5 g is approximately 12.6 times higher than the value with PGA = 0.1 g, and the corresponding magnification for the pile bottom is only 2.9.
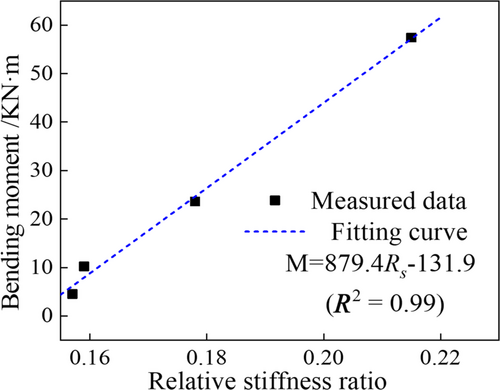
As depicted in Figure 8, under the action of small-to-moderate earthquakes (PGA ≤ 0.3 g) when the bending moment is largest at the top portion of the pile, there is no negative bending moment at each measurement point of the pile, and its amplitude gradually decreases with increasing buried depth. However, under the action of a strong earthquake, a negative bending moment appears at measurement point E7 in the lower part of the pile, and there is a difference between the deformation directions of the upper and lower parts of the pile. The reason for the differential deformation of the pile foundation seismic damage is that, in a strong earthquake, the stiffness of the soil foundation gradually decreased, and the model foundation is more likely to produce a more significant nonlinear seismic response. This significant nonlinear characteristic causes the shear deformation of the soil layer to show a torsional deformation characteristic along the depth, rather than synchronous deformation to the same side. Therefore, the direction of the pile bending moment changes under the action of a strong earthquake. From Figure 8B, IT can be observed that the bending moment is mainly concentrated in the middle and upper parts of the pile, and the maximum amplitudes of the top portion of the pile are 11 times larger than those of the bottom portion of the pile. This ratio increased with an increase in the input PGA, with a maximum value of 50. As shown in Figure 9, the bending moment at the top portion of the pile increased monotonically with an increase in Rs.
3.2.2 Displacement response of pile foundation
A laser displacement meter HD3 was placed on the pile cap to record its horizontal displacement. Owing to the large horizontal stiffness of the pile cap, its motion can be regarded as rigid. The horizontal displacement at the top portion of the pile was obtained from the measured displacement at measurement point HD3.
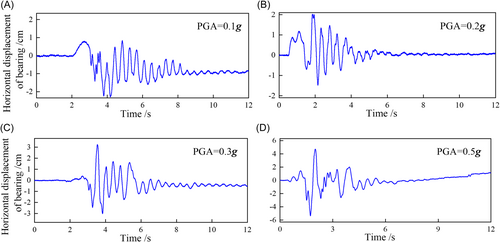
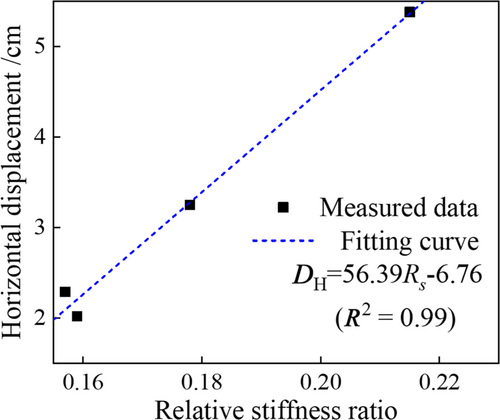
The time-history curves of the horizontal displacement under different conditions are shown in Figure 10, and Figure 11 shows the fitting curves of the horizontal displacement peak values and Rs. It can be seen from the results that the horizontal displacement at the top portion of the pile increases significantly with an increase in the input PGA. For example, the horizontal displacement peak value with the condition of input PGA = 0.1 g is 2.29 cm, and the value of input PGA = 0.5 g increases by 135% compared with the input PGA = 0.1 g. The main reason for the above earthquake-damage is that with the change in foundation stiffness and the continuous increase in input PGA, the soil foundation properties become softer, which causes its lateral displacement resistance to decrease gradually. Furthermore, the lateral confinement and lateral resistance of the pile gradually decreased. Therefore, the horizontal displacement increased significantly under the coupling action of the violent rotation of the superstructure and the change in the soil foundation stiffness. In particular, when the input PGA = 0.5 g, the horizontal displacement of the pile foundation did not reach the steady state after the mainshock, and there was an obvious unilateral cumulative lateral displacement. This phenomenon again indicated that the model foundation was damaged under these test conditions.
4 DYNAMIC RESPONSE OF THE SEISMIC ISOLATION LAYER AND THE ISOLATED STRUCTURE
4.1 Rotation response of the pile cap and the seismic isolation layer
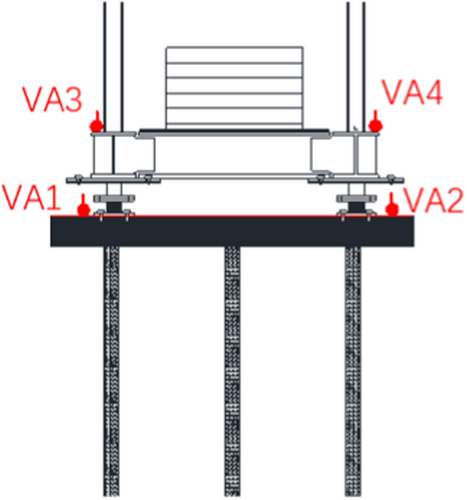
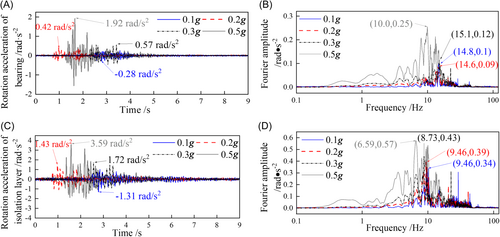
| Input PGA (g) | Location | Angular acceleration amplitudes (rad·s−2) | Ratio |
|---|---|---|---|
| 0.1 | Seismic isolation layer | 1.301 | 4.752 |
| Pile cap | 0.275 | ||
| 0.2 | Seismic isolation layer | 1.434 | 3.436 |
| Pile cap | 0.418 | ||
| 0.3 | Seismic isolation layer | 1.721 | 3.022 |
| Pile cap | 0.569 | ||
| 0.5 | Seismic isolation layer | 3.588 | 1.873 |
| Pile cap | 1.916 |
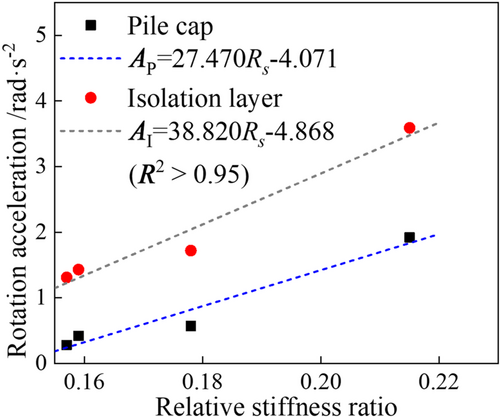
The results in Table 4 show that the seismic isolation layer has a significant amplification effect on the rotational effect of the pile cap, which is consistent with the previous shaking-table test results of isolated structures on different soil foundations. With an increase in the input PGA and Rs, the rotational effect of the pile cap and seismic isolation layer increase significantly. For example, the angular acceleration peak value of the seismic isolation layer under the action of input PGA = 0.5 g is 3.59 rad/s2, which is 175% higher than the value of input PGA = 0.1 g, and the corresponding increase of is 596%. However, the amplification effect of the seismic isolation layer on the angular acceleration of the pile cap gradually weakened. The magnification of the input PGA = 0.5 g is 1.87, which is 61% less than the value of the input PGA = 0.1 g.
From the Fourier spectrum of angular acceleration, it can be seen that the angular acceleration spectrum of the pile cap moves from high frequency to low frequency with the gradual increase in the input PGA and Rs, and its peak value gradually increases. After filtering and amplification of the pile cap rotation effect by the seismic isolation layer, the spectrum of the seismic isolation layer moves to a lower frequency direction, and its peak value is also amplified by different degrees compared with the pile cap. For an input PGA = 0.5 g, the spectrum peak value of the pile cap is 0.25 rad/s2, and the peak value of the seismic isolation layer increased by 128%. According to the above analysis, it can be seen that, with a decrease in the model foundation stiffness, the filtering amplification effect of the soil foundation becomes increasingly obvious, which leads to the spectral characteristics of the ground motion propagating to the pile foundation or the ground surface moving gradually to lower frequencies. Furthermore, under the coupling action of the soil foundation, source dynamic, and filtering amplification effects of the seismic isolation layer, the swing effect of the pile cap and base-isolated structure are significant, which results in a significant increase in the bending moment response at the top portion of the pile, making the pile foundation more likely to produce more serious earthquake-damage.
4.2 Seismic isolation efficiency of the seismic isolation layer
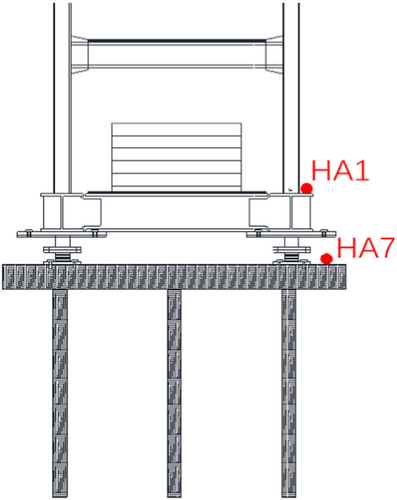
To measure the horizontal acceleration response of the seismic isolation layer on the change of foundation stiffness, horizontal accelerometers HA1 and HA7 were arranged on the top surface of the pile cap and seismic isolation layer, respectively, as shown in Figure 15. Table 5 lists the peak values of the horizontal acceleration responses at the measurement points HA1 and HA7. The fitting curves of the seismic isolation efficiency, , and Rs are shown in Figure 16.
| Conditions | Rs | Location | Acceleration amplitudes (m·s−2) | Seismic isolation efficiency (A7-A1)/A7 (%) |
|---|---|---|---|---|
| KB1 | 0.157 | Seismic isolation layer HA1 | 0.889 | 40.070 |
| Pile cap HA7 | 1.484 | |||
| KB2 | 0.159 | Seismic isolation layer HA1 | 1.329 | 38.820 |
| Pile cap HA7 | 2.173 | |||
| KB3 | 0.178 | Seismic isolation layer HA1 | 2.096 | 28.990 |
| Pile cap HA7 | 2.953 | |||
| KB4 | 0.215 | Seismic isolation layer HA1 | 3.524 | 14.860 |
| Pile cap HA7 | 4.139 |
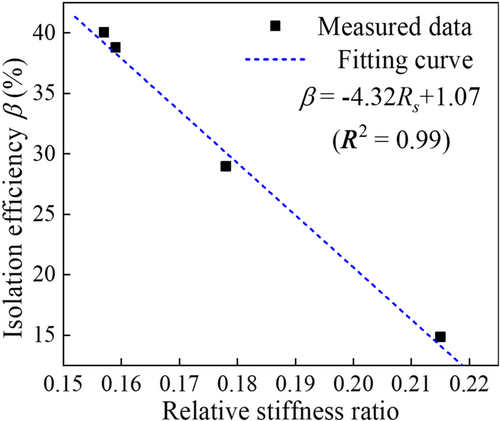
From the results in Table 5, it can be observed that the seismic isolation efficiency of the seismic isolation layer decreases continuously with an increase in the input PGA and Rs. However, it has been proven that the seismic isolation efficiency of the isolated structure on a rigid foundation increases with an increase in the input PGA.6 This finding demonstrates that an increase in Rs (the decrease in model foundation stiffness) is a major reason for the decrease in the seismic isolation efficiency. A larger Rs corresponds to a more significant the filtering effect of the soil foundation, leading to changes in the spectral characteristics of the wave field propagated to the surface and pile foundation, such as an increase in the low-frequency components and relative attenuation of the high-frequency components. Meanwhile, the seismic isolation layer has the characteristic of reducing the high-frequency vibration and amplifying the low-frequency vibration. Therefore, under the dual actions of the soil foundation effect and seismic isolation layer characteristic, the larger the Rs, the worse the seismic isolation efficiency of the seismic isolation layer.
In addition, the increment in Rs directly affects the decrease in the seismic isolation efficiency of the seismic isolation layer. The Rs at condition KB2 increased slightly compared with that of condition KB1, so the corresponding seismic isolation efficiency decreased slightly, while the seismic isolation efficiency of conditions KB3 and KB4 decreased significantly owing to their Rs remarkable increase. The aforementioned laws further indicate that Rs is the principal cause of the reduction in the seismic isolation efficiency of the seismic isolation layer.
4.3 Acceleration response of the isolated structure
In Figure 17, the layer number “0” represents the pile cap. As shown in Figure 17, the acceleration amplification factors (AAFs) of the isolated structure are between 0.53 and 0.89 under different conditions, and the seismic isolation layer can still play a significant role in seismic isolation. The AAFs of the bottom and top floors were larger and those of the middle floors were relatively smaller. This was consistent with the AAFs distribution pattern of the base-isolated structure on a non-liquefied soil foundation.29 In addition, the AAFs of each floor of the isolated structure increased significantly with an increase in Rs. For the AAFs of the top floor, its values with the input PGA of 0.2, 0.3, and 0.5 g are 0.65, 0.75, and 0.89, which increased by 7%, 15%, and 46% compared with the input PGA of 0.1 g, respectively. The AAFs for the remaining floors with the input PGA = 0.5 g increased between 41% and 45% compared to the input PGA = 0.1 g. It can be seen that the seismic isolation efficiency of the seismic isolation layer decreases significantly with the increase of the Rs, and its decline range is related to the Rs increment.
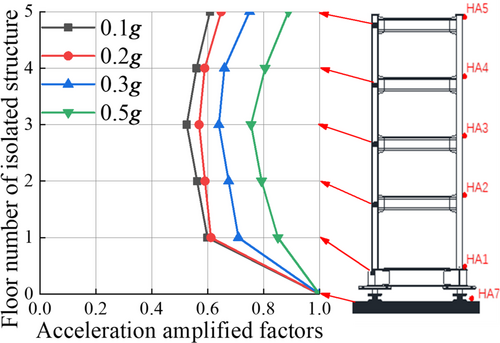
The variation laws of the isolated structure AAFs further improved the dynamic mechanism of the SISI. That is, with the decrease in model foundation stiffness, the spectral characteristics of the input motion are modified by the side effect of the soil foundation, resulting in the long periodization of the wave field around the pile cap; in addition, the restraint ability of the soil foundation to the pile foundation decreases gradually owing to the friction between the foundation and pile side reduction, leading to that the foundation at the bottom of the pile cap cannot provide a sufficiently high strength to support the pile cap and superstructure. Under the coupling action of the site, seismic source dynamic, and SISI effects, the pile cap rotates violently and its horizontal displacement increases significantly, which further leads to a significant increase in the floor AAFs of the isolated structure, and the seismic isolation efficiency of the seismic isolation layer decreases significantly.
5 CONCLUSIONS AND ANALYSES
- 1.
When the relative stiffness ratio Rs of the structure-soil foundation is relatively large, the overall shear failure of the model foundation may have occurred under the strong motion, which leads to the rapid settlement of the pile cap and extrusion and uplifting of the soil foundation surface. In addition, there is a difference between the deformation directions of the upper and lower parts of the pile, indicating that the model foundation seismic damage has obvious nonlinear response characteristics.
- 2.
Rs has a significant impact on the seismic isolation efficiency of the seismic isolation layer in change of foundation stiffness; that is, the larger the Rs, the lower the seismic isolation efficiency of the seismic isolation layer, and under the coupling action of the site, seismic source dynamic, and SISI effects, the floor AAFs of the isolated structure significantly increases. This finding is directly against the variation law of the seismic isolation efficiency based on the assumption of a rigid foundation, demonstrating the importance of the SISI effect. The finding also further verifies the results of the existing analysis of the seismic isolation efficiency considering the influence of SSI effects. In addition, the seismic isolation layer has some amplifying action on the rotation effect of the pile cap, and its amplification effect decreases with an increase in Rs.
ACKNOWLEDGMENTS
The authors gratefully acknowledge the financial support from the National Natural Science Foundation of China (51978333, 51778282). This work was also supported by the National Science Fund for Distinguished Young Scholars (51725802). Their financial support is greatly appreciated.
CONFLICTS OF INTEREST
The authors declare no conflicts of interest.


