Comparative study on the seismic performance of column-supported silos: Single, row, and group configurations under different storage conditions
Abstract
Grain plays a crucial role in a nation's economic security and public welfare, and the efficient storage of grain in group silos is essential for maintaining these reserves. As a global leader in grain production, consumption, and imports, China also holds a significant position in grain reserves. Based on shake table tests and actual case studies, this study explores the seismic mechanisms and failure modes of column-supported group silos using the Abaqus finite element simulation method. This study includes shaking table test verification and a refined numerical simulation method for column-supported silos. The dynamic responses, natural frequency, acceleration, and lateral pressure of storage material are analyzed to verify the rationality of numerical methods. Additionally, this study investigates the implementation and mechanisms of the material–structure interaction system in Abaqus, including the selection of material constitutive models, earthquake records, element size division, and grain–structure contact issues. Then, finite element models of different silo structures are built for single silos, row silos, and group silos. The modal shapes, natural frequencies, acceleration responses, relative displacement responses, and lateral pressure of storage material under the action of EL-Centro waves, Kobe waves, and artificial waves are investigated to reveal the seismic response mechanisms of column-supported silo structures under different storage material conditions. This research not only helps guide practical engineering design but also provides a scientific supplement to existing silo seismic theories.
1 INTRODUCTION
Earthquakes, as unpredictable natural disasters, pose a significant threat to human society, particularly challenging the stability of various building structures.1, 2 Silos, as critical facilities for storing grain and industrial materials, have safety implications that directly affect national economic stability and the protection of lives and property. Seismic vibrations can severely damage silo structures, causing cracks, deformations, or even collapse, potentially resulting in leakage and loss of stored materials, which can disrupt the entire supply chain.3, 4 As national reserves continue to increase, single silos can no longer adequately meet storage capacity demands, leading to widespread adoption of group silos. Due to unfavorable factors such as changing mass distribution, increasing scale of group silos, and uneven vertical stiffness distribution, their seismic performance is more complex than that of single silos. Therefore, researching the seismic mechanisms and design methods of column-supported group silos is a critical issue that urgently needs to be addressed in the field of storage structure seismic engineering.5-7 Given the importance of silos in agriculture and industry, it is crucial to investigate the damage mechanisms caused by earthquakes and understand their response behavior under seismic actions.8-10 This study aims to provide scientific foundations for the design and reinforcement of silos and support the development of effective earthquake mitigation measures, thereby reducing the potential losses caused by seismic events.11-13
The interaction between storage materials and structures is a critical factor in determining the seismic performance of storage facilities.14-16 Duan et al. based on the study of the dynamic behavior of grain storage silos during earthquakes, proposed theoretical solutions for the horizontal forces and effective mass of silo-bulk material systems, which hold significant implications for silo design and seismic analysis.17 Silvestri et al. investigated the seismic design of flat-bottom circular silos containing granular materials (e.g., grain) and found that the effective mass of the material is indeed lower than the values specified in Eurocode 8 under all circumstances.18, 19 Jing conducted shaking table tests and numerical simulations to study the dynamic horizontal pressure of granular materials on silo walls.20 Chen et al. proposed a grain-structure interaction (GSI) analysis method to study particle–particle and particle–silo wall interactions and verified its reliability in examining the seismic response of column-supported silos, thus providing valuable insights for engineering design and construction.21 Gabbianelli et al. and Khalil et al. employed vulnerability functions to provide a detailed analytical approach and data support, laying a foundation for the seismic design and assessment of industrial storage structures. Their work aims to mitigate economic losses and functional disruptions caused by earthquakes in industrial facilities.22, 23 Nascimben et al. utilized finite element technology, focusing on fluid–structure interaction and the nonlinear behavior of supporting structures, to simulate and optimize the seismic dynamic response of elevated steel tanks, offering new insights and practical references for performance enhancement.24 Benkhellat evaluated the seismic performance and damage of concrete grain silos through numerical analysis and the extended N2 method, introducing a new global damage index, which was validated by comparison with existing indices.25 Wilde et al. explored the vibrations and acoustic phenomena generated by granular material flow in silo structures, revealing the dynamic effects and generation mechanisms of silo music, which contribute to developing methods to mitigate adverse dynamic effects and enhance silo safety and reliability.26, 27 Additionally, the seismic behavior of silos is significantly influenced by sliding and separation movements between the storage material and the silo walls.28, 29 Given the unclear interaction mechanisms between grains and the silo structure, exploring the seismic performance of material–structure interaction is crucial.30, 31
In recent years, many scholars have conducted detailed studies on the mechanical properties of reinforced concrete silos.32 Yang et al. summarized the dynamic characteristics and seismic response patterns of silos at different filling heights, providing important theoretical support for understanding the dynamic response mechanisms of column-supported grain silos under seismic action.33, 34 Li et al. explored the dynamic response mechanisms of silo-storage-foundation systems under seismic wave loading.35 Durmus and Livaoglu proposed a simplified approximate method for efficiently and reliably evaluating the dynamic behavior of silo systems, providing valuable reference for the design and safety assessment of silo systems under seismic excitations.36 Wang investigated the optimized design of cylindrical reinforced concrete structures with different circumferential reinforcement ratios at varying heights.37
The seismic performance of reinforced concrete group silos, as a primary structural form of vertical silos, has garnered extensive attention.38, 39 Li et al. performed shaking table tests on both group silo and individual silo providing valuable data and analytical methods for silos under seismic action.40 Chen et al. discussed the dynamic response of column-supported silo groups (CSGSs) under seismic conditions, focusing on the impact of group effects. They proposed a simplified, empirically based method to assess the seismic performance of CSGSs, reducing the need for complex calculations and enhancing the seismic resilience of reinforced concrete group silos.41 Yuksel and Arslan employed artificial neural networks (ANN) to predict the design forces and moments for reinforced concrete silo groups under specific loading conditions, thereby simplifying traditional mechanical calculations.42 They also proposed a method to streamline the design process, improving the efficiency of silo group design.43 Furinghetti et al. studied the effects of curved surface sliding isolation techniques on silo seismic isolation, demonstrating the significant role of isolation technology in enhancing the seismic performance of steel silos.44, 45 Gabbianelli et al. developed a refined numerical model to investigate the impact of the peak friction force at the motion breakaway of sliding isolators on the behavior of isolated storage tanks. This study highlights the advantages of such isolation systems and provides effective solutions to enhance the seismic resilience of silo structures.46
In summary, the current seismic design methods for silos are not detailed. First, the theoretical research on silo pressures under seismic loading is still immature and requires further study. Second, the seismic response mechanisms of column-supported group silo structures have not been fully theorized. Therefore, understanding the interaction mechanisms between column-supported group silo structures and storage materials under seismic conditions is of great importance. This paper addresses the seismic performance of column-supported group silo structures considering material–structure interaction. The specific research contents include: establishing a dynamic analysis model considering material–structure interaction; analyzing the motion patterns of storage materials and their impact on the force and deformation of group silo structures under seismic conditions through numerical simulations and shaking table tests verification. This study's innovation, compared to existing knowledge, lies in the systematic consideration of material–structure interaction effects on the seismic performance of column-supported silo structures. It fills a gap in the scientific literature, expands the theoretical framework for seismic design, and is expected to provide new methods and technical support for practical engineering applications. This work not only advances theoretical progress in the field but also offers important foundations for future design practices, thus holding significant academic and practical value.
2 NUMERICAL SIMULATION METHOD FOR COLUMN-SUPPORTED SILO STRUCTURES
2.1 Numerical simulation method
In the finite element validation part of this section, numerical simulation models were carried out with Abaqus software.47 To ensure the accuracy and reliability of the simulation, the finite element model was built in strict accordance with the specifications and dimensions of the shaking table test model. The model includes the storage material, silo wall, ring beam, silo bottom, reinforcement cage, and supporting columns. The established finite element model of the structure under full storage conditions is depicted in Figure 1. In the selection of cell types, S4R shell cells, T3D2 line cells and C3D8R solid cells were used to simulate the silo wall, the reinforcement cage, and the other components, respectively, to ensure the accuracy of the simulation. C3D8R elements are chosen for their efficiency and versatility. As eight-node three-dimensional reduced integration elements, they lower computational costs by reducing integration points, making them ideal for large-scale models. Suitable for static, dynamic, and thermal analyses, C3D8R elements effectively handle large deformations, nonlinear material behavior, and complex geometries while maintaining accuracy and numerical stability. Their straightforward implementation and widespread use in finite element software further enhance modeling efficiency, making C3D8R a preferred choice in numerical modeling and finite element analysis.
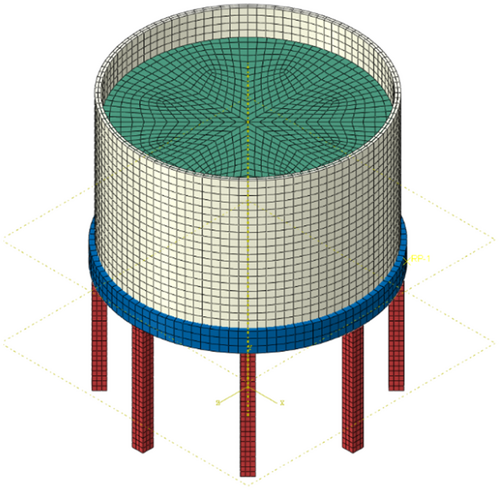
In the treatment of connection methods, various approaches were adopted to ensure the coordinated operation of different parts of the model. Tie-bonded connections are used between columns and ring beams to ensure the solidity between them. Shell-to-solid coupling connections are used between the silo wall and the silo floor to achieve a good connection effect. Embedded connections are used between reinforcement bars and concrete columns to simulate the anchoring effect in the actual project. In the selection of material constitutive structure, concrete damaged plasticity model concrete constitutive structure and bifold steel constitutive structure are adopted for reinforced concrete members to accurately reflect the mechanical properties of the materials.
2.2 Constitutive model of storage material
In the Abaqus finite element simulation software, the constitutive model of the storage material includes the Mohr–Coulomb model, the Drucker–Prager (D-P) model, and the modified D-P model. However, the modified D-P model, although adding the Cap yielding stage to the original D-P model to make its properties more fluid-oriented, may lead to excessive deformation of the storage material and unrealistic contact penetration with the silo wall when simulating the storage material.
In contrast, the D-P model addresses the convergence difficulties in simulations caused by the singularity of the yield function by modifying the Mohr–Coulomb function. Therefore, the D-P model is adopted for simulating storage materials to ensure the accuracy and reliability of the simulations.
In Equation (1), is determined by the friction angle and cohesive force of the storage material, with the friction angle 30° and cohesive force 0.03 MPa in this study. is influenced by other factors such as temperature but can be neglected. To ensure the convexity of the yield surface, it is necessary to satisfy , with a recommended value of 1 in dynamic implicit analyses.
2.3 Simulation of storage material–structure interaction
The interaction between the storage material and the silo wall is a complex nonlinear process, which shows significant differences with the different types of storage material. This contact state can generally be categorized into free open contact, sliding closed contact, and adherent closed contact. In the context of grain storage studied in this paper, the primary mode of contact between the grain and the silo wall is sliding contact, followed by adherent contact, while the influence of open contact is relatively minor.
The storage conditions in grain silos are, particularly, special, and the expansion angle and cohesive force of the storage material are the most significant factors affecting the contact state. To truly reflect this phenomenon in the Abaqus simulation, and at the same time prevent the storage material from unreasonably penetrating the silo wall, and ensure that no tensile stresses occur between the silo wall and the material, the normal hard contact model in surface-to-surface contact is adopted. In the tangential direction, we used a penalty function to enhance the constraint effect and set the friction coefficient to 0.45 to accurately simulate the dynamic interaction between the storage material and the silo wall.
Additionally, during the simulation, the impact of volume increase in the storage material due to shear dilation on the silo wall was specifically considered. To balance the accuracy of the simulation and the convergence of the calculation, the surface-to-surface contact between the storage material and the silo wall is set up with a fine-tuning of the tolerance of the specific region, which is set to 0.1 mm. Through these careful settings and adjustments, we expect to be able to more accurately simulate and analyze the complex interactions between the storage material and the silo wall.
3 VALIDATION OF NUMERICAL SIMULATION METHODS FOR SHAKING TABLE TESTS IN COLUMN-SUPPORTED SILO STRUCTURES
3.1 Shaking table tests profiles
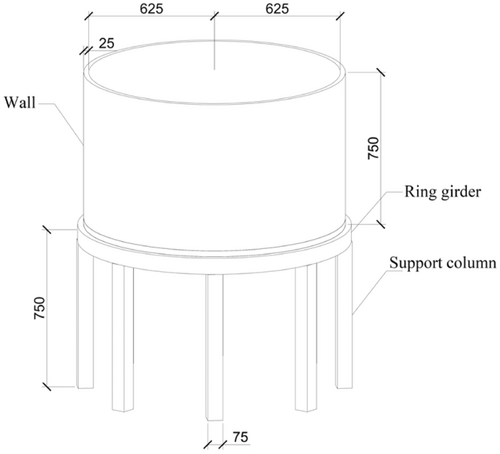
Based on the column-bearing silo structure shaking table test completed by Jia,48 which constructed a scaled model of a column-bearing reinforced concrete vertical silo single silo with scaling factor of 1:8, with the detailed dimensions shown in Figure 2. The key components such as the supporting columns, ring beams, silo bottom, and silo body were all constructed using reinforced concrete, mainly made from fine microconcrete and galvanized iron wire. To simulate the actual storage conditions of wheat, pulverized coal ash was used as the storage material within the silo,48 Fly ash has a density of 3750 kg/m³, which is similar to the storage density of wheat, thus ensuring the accuracy of the modeling results, detailed information is shown in Table 1.
| Mechanical index | Parameter |
|---|---|
| Densities (kg/m³) | 3750 |
| Modulus of elasticity (MPa) | 0.2 |
| Poisson's ratio | 0.4 |
| Angle of internal friction (°) | 30 |
| Flow stress ratio | 2/3 |
| Expansion angle | 0 |
| Yield stress (MPa) | 0.03 |
3.2 Acceleration comparison
This section employs the undamped modal analysis using the Lanczos method in Abaqus software to conduct modal analysis on the two structural systems of empty and full storage in the shaking table tests. The first natural frequency of the empty storage state is 9.3512, while the measured value from the shaking table test is 8.24481. The natural frequency in the full storage state is 4.3548, compared to the experimental data 4.2856 from the shaking table test. The finite element simulation shows an error rate of 13.42% in the empty storage state and only 1.61% in the full storage state, indicating that the numerical simulation methods are reliable to simulate the silo structures filled with storage. The smaller error under full-filled conditions may be due to the stabilizing effect of the storage material on the structure, enhancing the model's accuracy and stability, whereas the larger error under empty conditions could be attributed to factors such as the nonlinear behavior of the material model, approximations in boundary conditions, and uncertainty in model parameters.
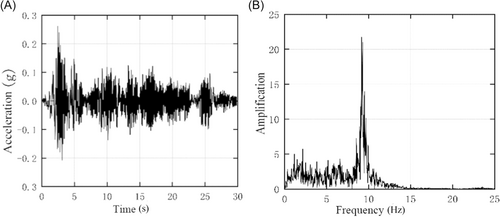
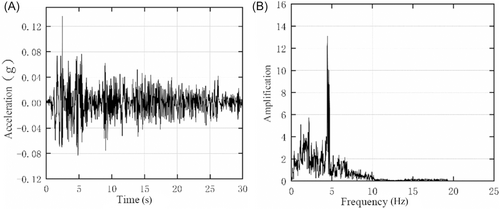
Under the influence of the EL with a Peak Ground Acceleration (PGA) of 0.1 g, the absolute acceleration time history curves and their spectral diagrams at the top of the storage were calculated for both the empty and full storage states, as shown in Figures 3 and 4. It can be concluded that: in the empty storage state, the acceleration spectrum shows a significant response amplification at 9 Hz, while in the full storage state, the response amplification at 5 Hz is more pronounced. The frequencies of response amplification in these two states correspond to their respective first natural frequencies.
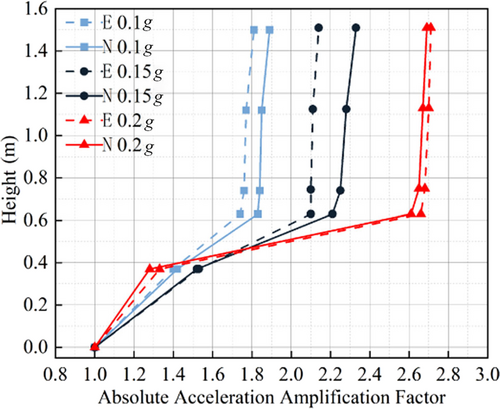
The absolute acceleration amplification factors in the full storage state are shown in Table 2, which demonstrates the errors between the simulation results and the experimental data are all within 10%, and the trend of variation along the structural height direction remains consistent. Particularly, a noticeable bending phenomenon can be observed in the middle area of the supporting columns, and a sudden change in stiffness is formed at the ring beam positions (Figure 5).
| Factor heights (m) | 0.1 g | 0.15 g | 0.2 g | |||
|---|---|---|---|---|---|---|
| Numeric | Experiment | Numeric | Experiment | Numeric | Experiment | |
| 0 | 1 | 1 | 1 | 1 | 1 | 1 |
| 0.37 | 1.411 | 1.429 | 1.534 | 1.527 | 1.339 | 1.289 |
| 0.63 | 1.751 | 1.841 | 2.107 | 2.223 | 2.662 | 2.608 |
| 0.74 | 1.773 | 1.848 | 2.108 | 2.259 | 2.684 | 2.656 |
| 1.12 | 1.781 | 1.864 | 2.123 | 2.289 | 2.703 | 2.671 |
| 1.5 | 1.825 | 1.900 | 2.153 | 2.333 | 2.715 | 2.693 |
3.3 Comparative analysis of lateral pressure responses in storage material
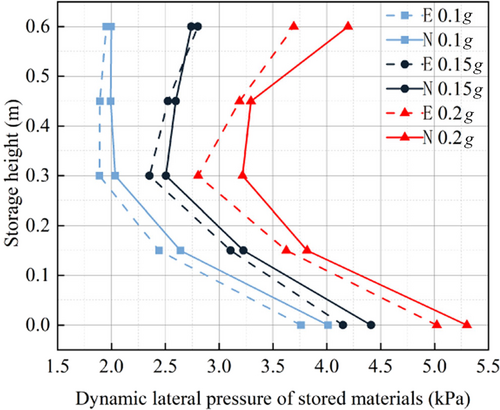
Figure 6 shows the time history of dynamic pressure of storage material at heights of 0, 0.15, 0.3, 0.45, and 0.6 m under the influence of the El-Centro earthquake with PGA 0.1 g. The figure demonstrates that the finite element simulation values align consistently with the experimental values along the height of the storage material, although the simulation results are generally larger. As the PGA increases, the dynamic lateral pressure of the storage material also increases, showing a decreasing trend from the bottom to a point and then increasing towards the top. The maximum discrepancy between the two occurs at 0.3 m, differing by only 16%. This indicates that the D-P constitutive model used in Abaqus successfully simulates the dynamic responses of grain storage, validating the rationality of the finite element model.
4 DYNAMIC CHARACTERISTICS ANALYSIS OF GROUP STORAGE STRUCTURES
4.1 Numerical model for actual group storage structures
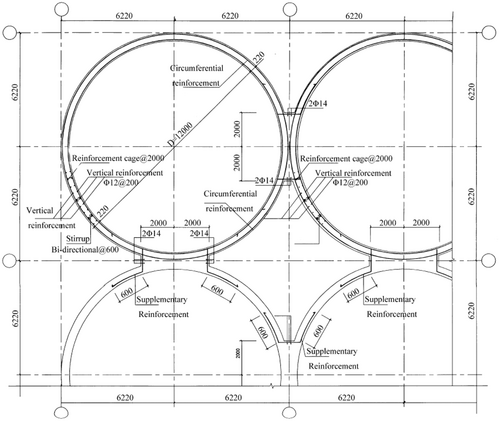
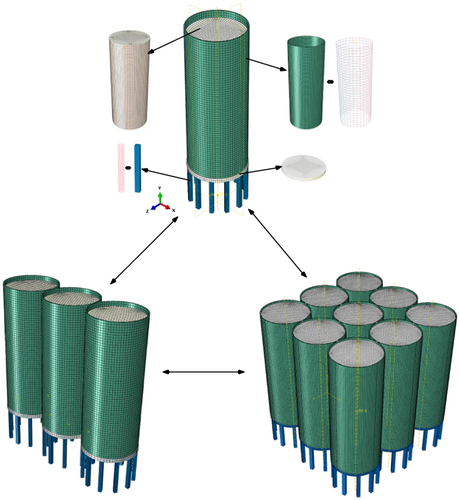
The study focuses on the actual engineering project of column-supported reinforced concrete group storage structures at Shanghai Waigaoqiao, conducting in-depth structural modeling and detailed analysis for single, row, and group storage structures, and both the 1 × 3 row and 3 × 3 group storage structure models were constructed using an integrated modeling approach. This method involves treating multiple interconnected substructures as a single entity in the model, which helps accurately capture the overall force distribution of the structure and avoid the accumulation of local errors. The overall height of the structure is designed to be 40 m, of which the height of the supporting part accounts for 8 m and the diameter of the internal space reaches 12 m. The connection method for the silo structures is illustrated in Figure 7, which aids in accurately capturing the structural stress conditions in real engineering scenarios, thereby providing a more reliable basis for subsequent structural optimization and design. In setting the structural boundary conditions, the silo structures were considered rigidly connected to the ground. Coupling constraints were applied at the bottom of the structure to simulate the rigid connection between the silo base and the ground, ensuring independent stress distribution in the silo walls.
To comprehensively investigate the seismic performance of single, row, and group silo structures under the most unfavorable conditions, nine different combination scenarios were designed, as shown in Table 3. These scenarios encompassed three different fill levels: empty, half, and full, matched with single, row, and group storage layouts, as shown in Figure 8, to thoroughly assess the impact of various factors on seismic resilience.
| Scenarios | Layout type | Storage height | Scenarios | Layout type | Storage height | Scenarios | Layout type | Storage height |
|---|---|---|---|---|---|---|---|---|
| 1 | Single | Empty | 4 | Row | Empty | 7 | Group | Empty |
| 2 | Single | Half | 5 | Row | Half | 8 | Group | Half |
| 3 | Single | Full | 6 | Row | Full | 9 | Group | Full |
4.2 Seismic record identification
This study utilized geological survey data from the Shanghai Waigaoqiao area, classified as Site Class IV with an earthquake resistance intensity of 8°, a design basic seismic acceleration of 0.2 g, and belonging to the first group of design earthquakes. In accordance with the requirements of the standard response spectrum, two natural seismic wave records, El-Centro and Kobe, were meticulously selected from the Pacific Earthquake Engineering Research Center database. Additionally, an artificial wave was generated using seismic wave creation software, all serving as seismic inputs for the structure. The structural seismic performance analysis employed a three-level defense standard, adjusting the PGA input to the silo structure to 0.07, 0.2, and 0.4 g, corresponding to small, medium, and major earthquake levels under actual conditions.
4.3 Dynamic characteristics of silo structures
With the difference of the density and elastic properties of different types of storage materials, it may influence the natural frequency and period of silos. Therefore, comparing the natural vibration characteristics of silos with different structural forms can help guide the optimization of silo design.
- (1)
In the empty state, the first and the second translational frequencies of the group silo structure are 1.3167 and 1.3235 Hz, respectively. Notably, the third torsional frequency significantly increases to 1.6159 Hz, with the torsional ratio remaining between 0.82 and 0.9. This indicates that the group silo structure exhibits high overall stiffness in the empty state, and torsional effects do not dominate.
- (2)
When the group silos are under half-filled state, the first frequency decreases to 0.9436 Hz. However, the third frequency drops to 1.2603 Hz, and the torsional ratio narrows to between 0.75 and 0.9. This suggests that as the storage material increases, the overall stiffness of the group silo structure decreases, leading to a reduction in natural frequency. At the same time, the influence of torsional effects becomes more pronounced.
- (3)
In the full state, the vibration characteristics of the group silo structure change further. Both the first and second frequencies significantly decrease to 0.4466 Hz, with the period correspondingly extending to 2.239 s. The third frequency also decreases to 0.9091 Hz, and the torsional ratio further reduces to below 0.49. This indicates that in the full state, the overall stiffness of the group silo structure is significantly reduced, resulting in a substantial decrease in natural frequency. Moreover, the influence of torsional effects becomes more pronounced, possibly related to changes in the torsional characteristics of the structure with the increasing of the storage material.
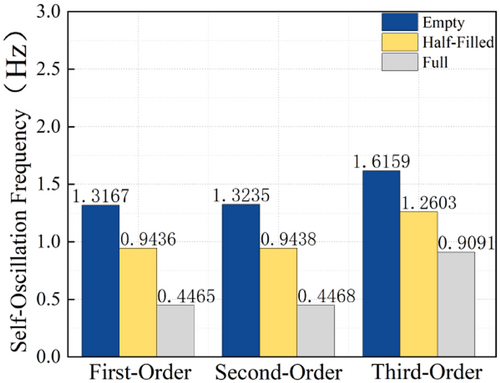
As the amount of storage material increases (from empty to half-filled to full), the natural frequency of the group silo structure exhibits a gradual decreasing trend, while the vibration period extends progressively. This is mainly due to the change in the structural stiffness and mass distribution of the group silos caused by the increasing storage material. Concurrently, the influence of torsional effects also intensifies with the increase in storage material.
5 SEISMIC RESPONSE ANALYSIS OF THE GROUP SILO STRUCTURE
5.1 Comparison of acceleration responses in the group silo structure
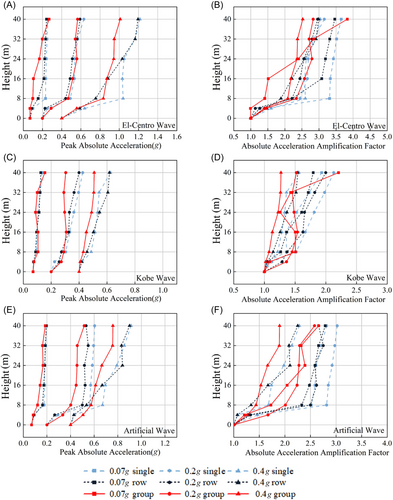
The study calculated maximum acceleration responses at various heights (0, 4, 8, 16, 24, 32, and 40 m) from the base for three silo structural forms under different storage conditions during minor, moderate, and severe earthquakes, El-Centro wave (EL), Kobe wave (KB), and artificial wave.
5.1.1 Acceleration responses of structures in empty silo state
- (1)
The absolute acceleration of the upper structure increases with height, while the variation in the upper silo walls is relatively gradual. However, the increase in absolute acceleration in the support columns is significant, especially at the ring beams where a noticeable abrupt change occurs. This is because the lateral displacement stiffness of the lower support columns is much lower than that of the upper silo walls, leading to a significant increase in absolute acceleration within the 0–8 m range. When reaching the ring beams at 8 m height, the stiffness suddenly increases, resulting in an abrupt change. This agrees with the characteristic of column-supported silo structures being stiffer at the top and more flexible at the bottom.
- (2)
Notably, at approximately 4 m height on the support columns, the peak acceleration curve exhibits a “bending” phenomenon. This is due to the significant mass of the upper silo body, which generates considerable inertial forces. Under seismic excitation, a noticeable phase difference occurs between the upper silo body and the base translation, leading to a reduction in the absolute acceleration amplification factor at the middle of the columns. Additionally, the overall trend for the upper silo walls is a linear increase. However, under certain conditions, particularly, when the PGA is 0.2 and 0.4 g, the absolute acceleration at the silo top shows a certain increase. This indicates that the whip effect at the silo top is more pronounced during moderate and severe earthquakes.
- (3)
Under the influence of the EL, the absolute acceleration response of the structure is most pronounced, reaching its maximum. While the absolute acceleration response under the KB is the smallest. As the PGA increases, the absolute acceleration amplification factor of the structure generally shows a decreasing trend, primarily due to the significant structural plastic deformation under moderate and severe earthquakes. Taking the EL as an example, the absolute acceleration amplification factor ranges for single silos, row silos, and group silos are 1–3.7, 1–3.5, and 1–3.0, respectively, indicating an overall tendency for the amplification factor to decrease from single silos to group silos.
5.1.2 Acceleration response of structures in half-filled silo state
The absolute peak accelerations at various points for three structural types under half-filled silo state, subjected to three seismic levels, are shown in Figure 11, which indicates that the artificial wave induces the most intense absolute acceleration response, reaching the maximum value, while the response triggered by the KB is the weakest, with the smallest peak absolute acceleration. This comparison highlights the significant impact of seismic waveform on the dynamic characteristics of structures.
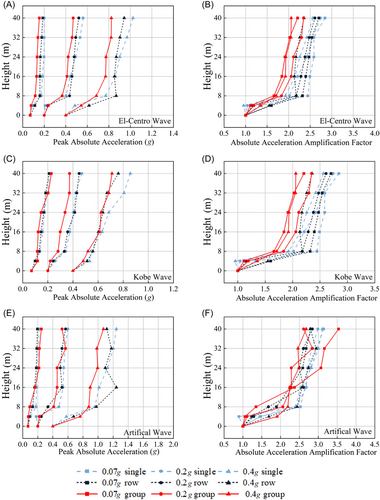
Under the influence of the EL, the absolute acceleration amplification factor ranges for single silos, row silos, and group silos are 1–2.81, 1–2.64, and 1–2.33, respectively. Under the KB, these ranges are 1–2.85, 1–2.63, and 1–2.35. In contrast, under the artificial wave, the amplification factor ranges for single silos expand to 1–3.2, for row silos to 1–2.9, and for group silos to 1–3.5. These results clearly illustrate the impact of different waveforms on structural acceleration responses and the overall decreasing trend in acceleration amplification factors from single silos to group silos.
5.1.3 Acceleration response of structures in fully filled state
Figure 12 illustrates the peak absolute acceleration at various points for three structural types under fully filled conditions and three seismic levels. Similar to the half-filled state, the absolute acceleration response is generally the smallest for group silos and the largest for single silos. The absolute acceleration response is large under the KB and small under the EL.
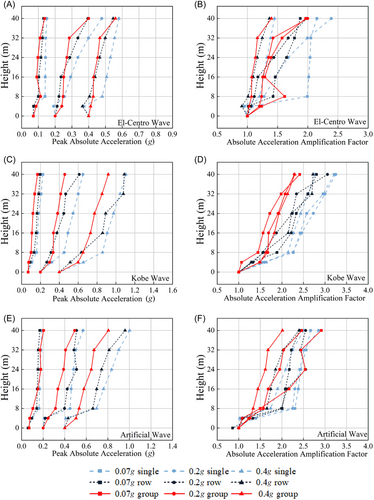
Under the influence of the EL, the amplification factor range for single silo structures is 1–2.41, while the factors for row silos and group silos are closer, ranging from 1 to 1.98 and 1 to 2.0, respectively, both slightly lower than for single silo structures. Under the KB, the amplification factor ranges for single silos, row silos, and group silos are 1–3.25, 1–3.13, and 1–2.46, respectively, generally showing a decreasing trend from single silos to group silos. Under the artificial wave, the amplification factors for single silos, row silos, and group silos vary between 1–2.78, 1–2.53, and 1–2.9, respectively.
Under the three storage filling states empty, half-filled, and fully filled, the acceleration responses of different structural systems were compared, and the changes in peak absolute acceleration at the silo top were analyzed in detail, as shown in Table 4. It was shown that under the three structural systems, the peak absolute acceleration was the largest under the half-filled state, followed by the empty state, and the smallest under the fully filled state. This is because under the fully filled state, there is a phase difference between the storage material movement and structural movement, and the mutual friction between the storage materials acts as an effective energy dissipation mechanism, thereby reducing the peak absolute acceleration. However, under the half-filled state, the relatively reduced gravitational effect leads to more vigorous storage material movement, resulting in an increase in the peak absolute acceleration compared to the fully filled state.
| Scenarios | PGA | ||||||||
|---|---|---|---|---|---|---|---|---|---|
| 0.07 g | 0.2 g | 0.4 g | |||||||
| Single | Row | Group | Single | Row | Group | Single | Row | Group | |
| El-Centro | |||||||||
Empty Half Full |
2.557 1.990 1.506 |
2.424 1.890 1.313 |
2.681 1.545 1.377 |
6.312 5.479 4.780 |
5.918 5.220 3.957 |
5.662 4.692 3.998 |
1.214 1.025 5.798 |
1.195 9.427 5.460 |
1.009 8.234 5.594 |
| Kobe | |||||||||
Empty Half Full |
1.352 1.332 2.248 |
1.256 1.247 1.962 |
1.545 2.281 1.690 |
4.257 3.759 6.498 |
3.997 3.557 6.112 |
3.041 3.730 4.578 |
6.252 7.781 1.104 |
6.171 7.676 1.088 |
5.080 7.110 9.191 |
| Artificial | |||||||||
Empty Half Full |
1.969 2.198 1.865 |
1.953 1.957 1.689 |
1.862 2.477 2.040 |
6.046 5.979 5.700 |
5.320 5.224 5.100 |
5.159 5.224 4.929 |
9.130 1.243 1.002 |
9.000 1.115 9.595 |
7.588 1.071 8.054 |
- Abbreviation: PGA, Peak Ground Acceleration.
For single silo structures, their dynamic responses are relatively independent, with minimal influence from surrounding structures. Under seismic conditions, the peak acceleration of single silo structures is mainly influenced by their own stiffness and mass distribution. As the intensity of ground motion increases, the peak acceleration of single silo structures will also increase accordingly. However, due to the lack of mutual constraints and support from adjacent structures, the acceleration response of single silo structures may be more sensitive and susceptible to the direct impact of seismic waves, resulting in potentially larger peak accelerations.
The acceleration responses among different silos may exhibit certain phase differences or mutual cancellation phenomena. These variations should be fully considered in structural seismic design to ensure the safety and stability of the structures.
5.2 Comparison of displacement responses of silo structures
5.2.1 Elastoplastic displacement angle of silos
| Structural systems | Natural period (s) | Displacement angle limit () | Column top displacement limit |
|---|---|---|---|
| Single | |||
| Empty | 0.482 | 1/260 | 30.77 |
| Half | 0.634 | 1/177 | 45.16 |
| Full | 0.954 | 1/100 | 80.00 |
| Row | |||
| Empty | 0.592 | 1/195 | 41.03 |
| Half | 0.975 | 1/97 | 82.49 |
| Full | 1.339 | 1/62 | 128.62 |
| Group | |||
| Empty | 0.759 | 1/138 | 57.97 |
| Half | 1.059 | 1/86 | 93.02 |
| Full | 2.239 | 1/30 | 266.67 |
This section analyzes the displacement responses at various heights (0, 4, 8, 16, 24, 32, and 40 m) from the base for two structural forms under different storage conditions, and under El-Centro, Kobe, and artificial waves at three seismic levels minor, moderate, and major.
5.2.2 Displacement responses of structures in empty silo states
Under empty silo conditions, the peak relative displacement at various points for three structures under three seismic levels is shown in Figure 13, which illustrates that the peak displacement increases gradually with the height of the structure. Particularly, significant changes can be observed in the support columns from 0 to 8 m. In contrast, the relative displacement increase in the upper silo section is smaller. Notably, at the 8 m ring beam, the displacement curve exhibits a pronounced “jump” phenomenon, but generally, it still shows a “broken-line” growth trend. This phenomenon is attributed to the “upper rigid, lower flexible” characteristic of the structure, where the abrupt change in stiffness at the ring beam is a key factor in forming this characteristic.
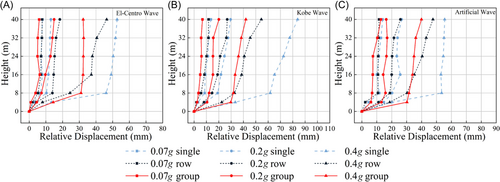
Under empty silo conditions and at 0.07 g minor seismic intensity, the artificial wave has a relatively significant impact on the structure, with displacements at the column tops of single-silo, row-silo, and group-silo structures reaching 11.64, 10.78, and 6.91 mm, respectively. As the PGA increases to 0.2 g, the influence of the artificial wave remains the most pronounced. The displacements at the column tops of single-silo, row-silo, and group-silo structures reach 20.23, 18.82, and 15.85 mm, respectively, indicating that the structural displacement response gradually intensifies under seismic action. It is noteworthy that, although the displacements increase, the elastic-plastic displacement angles of the three structures do not exceed their limits, demonstrating good seismic performance.
At a PGA of 0.4 g, under the influence of the EL, the relative displacements at the 8 m column tops for single-silo, row-silo, and group-silo structures are 46.12, 24.44, and 31.06 mm, respectively. Under the KB, the relative displacements are 99.91, 77.09, and 80.22 mm, respectively. And under the artificial wave, the relative displacements are 61.74, 32.78, and 31.84 mm, respectively. At this point, the elastic-plastic displacement angles of most structures are approaching or exceeding their limits, indicating that the seismic performance of the structures under major earthquakes is facing severe challenges.
The effects of different seismic waves and magnitudes on single-silo, row-silo, and group-silo structures exhibit significant variations. Under minor and moderate seismic intensities, although the elastic-plastic displacement angles of all structures do not exceed their limits, the displacement response of the single-silo structure is consistently the largest. However, under major seismic intensities, the elastic-plastic displacement angle of the single-silo structure exceeds its limit, demonstrating poorer seismic performance.
In contrast, the row-silo and group-silo structures perform better, with their elastic-plastic displacement angles remaining within the safe range. This can be attributed to the fact that under minor and moderate seismic intensities, the plastic development of the structures is not yet apparent, and their overall behavior is almost elastic. However, when subjected to major seismic intensities, the elastic–plastic displacement angles of some structures exceed the code limits, indicating that these regions have entered the plastic development stage. Consequently, the relative displacements of the structures increase significantly under major seismic events.
Under the same PGA conditions, group-silo structures generally exhibit smaller displacements. This reveals that there are significant differences in displacement responses among different structures under seismic forces. This may be related to the unique spectral characteristics and energy distribution of seismic waves, leading to diverse dynamic responses of structures under seismic actions.
5.2.3 Displacement response of structures in Half-Filled states
In the half-filled condition, the peak relative displacement values at various points for the three structures under three seismic levels are illustrated in Figure 14.
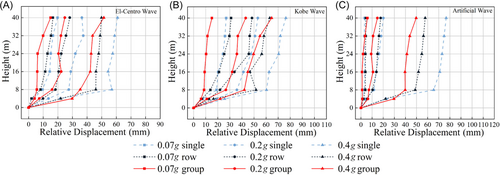
Under different seismic waves and magnitudes, significant differences in relative displacements at the top of 8 m columns were observed for single-silo, row-silo, and group-silo structures. Under the half-filled condition, during small earthquake with PGA 0.07 g, the KB had a relatively greater impact, resulting in displacements of 18.97, 13.89, and 8.63 mm at the column tops for single-silo, row-silo, and group-silo structures, respectively. The elastic-plastic displacement angles for all structures remained within the limits under the small earthquake.
When the earthquake magnitude increased to a medium-sized event with PGA 0.2 g, the impacts of the EL and KB on the structures became more pronounced. Under the EL, the relative displacements for single-silo, row-silo, and group-silo structures were 27.51, 18.40, and 16.07 mm, respectively. Under the KB, the displacements were 35.82, 21.86m, and 26.71 mm, respectively. In contrast, the displacement responses under the artificial wave were smaller, with values of 11.68, 10.47, and 7.15 mm, respectively.
As the PGA further increased to a severe earthquake with 0.4 g, the displacement responses of all three structures under seismic waves showed significant growth. Specifically, under the EL, the relative displacements at the top of 8 m columns for single-silo, row-silo, and group-silo structures were 56.92, 45.94, and 35.32 mm, respectively. Under the KB, they were 60.36, 51.70, and 42.00 mm, respectively. Under the artificial wave, they were 65.46, 48.82, and 39.80 mm, respectively. At this point, the elastic-plastic displacement angles of the single-silo structure exceeded the limits. The displacement responses of the row-silo and group-silo structures also approached their limits but remained relatively stable. This reveals that with the increase of PGA and the filling storage of the silos, the dynamic characteristics and seismic responses of the structures underwent significant changes.
5.2.4 Displacement response of structures in full-silo states
Under the full-silos condition, the peak relative displacement values at various points for the three structures under three seismic levels are illustrated in Figure 15.
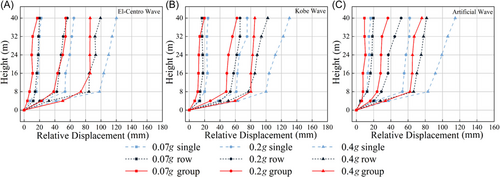
Under full-silos condition, when subjected to a minor earthquake of 0.07 g, the KB exhibits a relatively obvious impact on structures. However, the elastic-plastic displacement angles at the column tops of all structures remain within their limits, demonstrating good seismic resilience.
As the PGA increases to 0.2 g, the impact of the KB remains the most pronounced. In this section, the displacements at the column tops for the single-silos, row-silos, and group-silos structures reach 61.33, 53.57, and 48.20 mm, respectively, indicating a progressive enhancement in the structural response under seismic forces.
At the major earthquake stage, with PGA reaching 0.4 g, under the EL, the relative displacements at the 8 m column tops for single-silos, row-silos, and group-silos structures are 98.19, 84.45, and 73.91 mm, respectively. Under the KB, the relative displacements are 99.91, 77.09, and 80.22 mm, respectively. Under artificial waves, the relative displacements are 83.11, 66.51, and 62.22 mm, respectively. Moreover, the elastic-plastic displacement angles for most structures are approaching or exceeding their limits, indicating that seismic performance under major earthquake conditions faces significant challenges. Therefore, in the design and construction of storage structures, the impact of seismic forces should be thoroughly considered, and reasonable seismic measures should be implemented to enhance overall stability and safety of the grain silos.
5.3 Comparison of lateral pressure responses in storage materials
Figure 16 compares the dynamic lateral pressure of single-silo and group-silo structures under full conditions. It can be concluded that, under the same seismic waves and intensity, the dynamic lateral pressure in group silos is generally smaller than that in single silos. This is mainly due to the unique structural characteristics of group silos. As group silos consist of multiple interconnected compartments, their structure is more complex, which allows forces to be dispersed and transmitted among multiple compartments under seismic waves, thereby reducing the dynamic lateral pressure experienced by individual compartments to some extent.
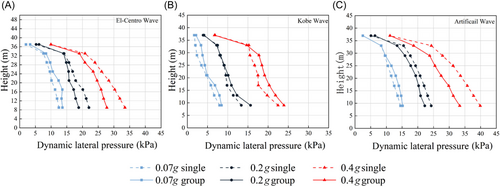
Table 6 shows the pressure coefficients on the storage side of the single silo structure and the group silo structure in the half-filled silo and full-silo condition, and the following pattern can be derived: compared with the half-filled state, the storage materials in the full state are more compact, with increased frictional forces between particles, which enhances the overall stability of the storage materials to some extent. However, under the influence of seismic waves, the storage materials in the full state still generate significant dynamic lateral pressures. Nevertheless, due to the advantages of group silo structures, their dynamic lateral pressures remain smaller than those in single silo structures.
| Seismic motion | Height (m) | PGA | |||||
|---|---|---|---|---|---|---|---|
| Single structure | Group silo structure | ||||||
| 0.07 g | 0.2 g | 0.4 g | 0.07 g | 0.2 g | 0.4 g | ||
| El-Centro | 37 | 1.24 | 1.74 | 2.71 | 1.41 | 1.51 | 1.97 |
| 33 | 1.28 | 1.77 | 2.73 | 1.47 | 1.51 | 1.99 | |
| 29 | 1.28 | 1.76 | 2.76 | 1.57 | 1.44 | 1.85 | |
| 25 | 1.27 (1.22) | 1.72 (2.11) | 2.68 (3.62) | 1.50 (1.07) | 1.41 (2.18) | 1.90 (3.20) | |
| 21 | 1.21 (1.16) | 1.67 (1.84) | 2.61 (3.72) | 1.27 (0.85) | 1.38 (1.71) | 1.80 (3.34) | |
| 17 | 1.22 (1.24) | 1.61 (2.24) | 2.53 (3.93) | 1.32 (0.97) | 1.50 (2.07) | 1.71 (3.69) | |
| 13 | 1.21 (1.17) | 1.55 (2.15) | 2.45 (3.67) | 1.23 (0.63) | 1.63 (2.38) | 1.69 (3.48) | |
| 9 | 1.20 (1.15) | 1.43 (1.98) | 2.27 (3.35) | 1.72 (0.61) | 1.91 (2.35) | 2.11 (3.48) | |
| Kobe | 37 | 0.83 | 1.08 | 1.60 | 0.88 | 1.26 | 1.71 |
| 33 | 0.74 | 0.97 | 1.47 | 0.88 | 1.05 | 1.63 | |
| 29 | 0.68 | 0.83 | 1.26 | 0.80 | 0.92 | 1.45 | |
| 25 | 0.57 (1.31) | 0.86 (2.16) | 1.35 (4.11) | 0.60 (0.92) | 0.91 (1.47) | 1.48 (3.34) | |
| 21 | 0.42 (1.05) | 0.81 (1.89) | 1.28 (4.31) | 0.52 (0.77) | 0.81 (1.10) | 1.42 (3.39) | |
| 17 | 0.32 (1.33) | 0.81 (2.44) | 1.29 (4.42) | 0.51 (0.94) | 0.83 (1.55) | 1.48 (3.55) | |
| 13 | 0.29 (1.29) | 0.87 (2.36) | 1.36 (4.26) | 0.50 (0.73) | 0.84 (1.87) | 1.31 (3.60) | |
| 9 | 0.89 (1.25) | 1.22 (2.15) | 1.45 (3.42) | 1.11 (0.72) | 1.28 (1.41) | 1.42 (2.81) | |
| Artificial | 37 | 1.24 | 1.97 | 3.38 | 1.18 | 1.98 | 2.92 |
| 33 | 1.30 | 2.00 | 3.37 | 1.28 | 1.98 | 2.88 | |
| 29 | 1.30 | 1.98 | 3.37 | 1.30 | 2.01 | 2.90 | |
| 25 | 1.29 (1.32) | 1.94 (2.40) | 3.36 (4.14) | 1.32 (1.45) | 1.99 (2.01) | 2.83 (4.40) | |
| 21 | 1.28 (1.05) | 1.88 (1.89) | 3.25 (4.31) | 1.28 (1.10) | 1.91 (1.66) | 2.74 (4.12) | |
| 17 | 1.23 (1.33) | 1.81 (2.41) | 3.14 (4.48) | 1.05 (1.12) | 1.81 (2.15) | 2.76 (4.07) | |
| 13 | 1.20 (1.31) | 1.75 (2.52) | 3.05 (4.26) | 0.89 (1.21) | 1.67 (2.59) | 2.40 (3.55) | |
| 9 | 1.11 (1.24) | 1.60 (2.57) | 2.83 (3.81) | 0.61 (1.17) | 2.20 (2.64) | 2.88 (3.43) | |
- Note: The contents in parentheses are the pressure coefficients for half-filled silo storage.
- Abbreviation: PGA, Peak Ground Acceleration.
As PGA increases, the lateral pressure increases. Under intense seismic conditions, particularly, when triggered by artificial waves, the lateral pressure at the bottom of storage materials in single silo structures reaches a peak of 39.69 kPa, whereas the response is minimal under KB conditions. Notably, under the major earthquake with an artificial wave of 0.4 g, the overpressure coefficient at approximately 37 m height of storage materials rises to 3.38. Group silo structures exhibit similar patterns under the same seismic conditions, with a maximum lateral pressure 33.308 kPa, also achieved under the major earthquake with artificial waves, and the minimal response under KBs.
However, the existing Code for Design of Reinforced Concrete Silos (GB50077-2017) appears to be overly conservative in its specification of the horizontal lateral pressure correction coefficient, for deep silos. The code stipulates a Ch value of 2 for the lower two-thirds of the storage materials, with a linear transition between 1 and 2 for the upper third storage materials. However, in this study, it was found that even under moderate seismic conditions, the overpressure coefficient in most regions where the storage height exceeds half of the silo height was more than twice the recommended value in the standards. Moreover, this coefficient tends to increase further with height. Therefore, a more cautious consideration of the impact of ground motion on the lateral pressure of storage materials may be considered comprehensively in the practical design of silo structures.
6 CONCLUSIONS
- 1.
The natural frequencies of both single and row silo structures decrease with the increase in storage material mass. The type of storage material, silo structure forms, and seismic excitations influence the natural vibration characteristics. The natural frequencies and periods of group silo structures vary significantly under different filled storage conditions. Full storage results in the lowest stiffness and a substantial drop in frequency, with enhanced torsional effects. Therefore, the impact of storage material on structural vibration and torsional characteristics should be considered in the design of silo structures.
- 2.
The absolute acceleration responses of the three structural systems increase with the silo height under empty, half-filled, and full silo conditions, with abrupt changes at the ring beams. Different seismic waves and structural systems affect acceleration responses, with KB generating the largest responses and group silos the smallest responses. As seismic intensity increases, the acceleration amplification factors generally decrease. There are differences in acceleration responses among single, row, and group silos, with group silos showing a more gradual change in peak acceleration due to mutual interactions. Moreover, the state of storage material significantly affects peak acceleration, with half-filled storage conditions yielding the largest and full-filled storage conditions the smallest responses.
- 3.
The relative displacement responses of the three structural systems increase with height under empty, half-filled and full storage conditions, with abrupt changes at the ring beams. Single silos exhibit the largest displacements, while group silos are the most stable. Under different seismic waves and magnitudes, structural displacement responses different, but the overall trend remains consistent. Under full storage conditions, major earthquakes impose higher demands on structural seismic performance. Therefore, in the design of storage structures, it is essential to fully consider seismic effects and reasonable seismic measures to ensure structural stability and safety.
- 4.
Under seismic conditions, the dynamic lateral pressures of storage material in both single and group silos increase with seismic intensity, but group silos generally experience smaller dynamic pressures due to structural characteristics. In full-filled storage conditions, the frictional forces between storage materials increase, and interactions with silo walls weaken, affecting structural stability. As the PGA increases, the lateral pressure on the storage material increases. Under major earthquake conditions, the maximum lateral pressure coefficient required by the standards, when subjected to artificial waves, may be underestimated for medium to major earthquake conditions.
ACKNOWLEDGMENTS
This study was funded by the National Natural Science Foundations of China (Grant No. 52108134), Scientific and Technological Project of Henan Province (No. 232102321005), and the Young Backbone Teacher Foundation of Henan University of Technology (No. 21420196), the Open Research Fund of Research Center on Levee Safety and Disaster Prevention, MWR (Grant No. LSDP202106).
CONFLICTS OF INTEREST
The authors declare no conflicts of interest.


