Investigation of the water environmental DNA/RNA profile for non-invasive biomonitoring of the fish pathogen Aeromonas salmonicida subsp. salmonicida and detection of immune responses in rainbow trout (Oncorhynchus mykiss)
Abstract
Aquaculture industries face challenges in fish production, primarily due to disease occurrence. Clinical manifestations of these diseases often indicate a considerable advancement in the pathological process. Infected fish often experience morbidity, leading to compromised welfare and substantial economic losses for production facilities. Therefore, prophylaxis and early detection of the pathogens could allow the facility managers to intervene or treat the disease before clinical disease signs occur. For the first time, environmental DNA/RNA (collectively eNA) was used to detect the salmonid pathogen Aeromonas salmonicida subsp. salmonicida in the water hosting rainbow trout (Oncorhynchus mykiss). This took place under controlled experimental conditions, before the occurrence of clinical outcome and mortality. The concentration of bacteria in the water was determined by using a standard curve. To determine the window of possible intervention, bacterial concentration was measured from an early stage of disease and throughout when fish became moribund. Furthermore, the acute phase protein, serum amyloid A produced by rainbow trout, was detected in the water and was found to be up-regulated 4 days post challenge. It was thereby shown that it is possible to detect strong immune responses in the fish in a non-invasive manner. The detection of eNA from the water can be used as a tool to detect pathogens in the early phase of infection before the disease becomes severe. This will facilitate interventions to limit the disease and increase the welfare of the fish, which is becoming a requirement for a more sustainable and ethical animal production.
1 INTRODUCTION
Furunculosis is caused by the opportunistic gram-negative bacterium Aeromonas salmonicida subsp. salmonicida (Asal). It is a serious threat to salmonid aquaculture and may induce high mortality and consequent economic losses (Austin & Austin, 2012). High fish density and suitable water temperatures for the growth of Asal facilitate fast horizontal transmission of the bacterium between fish (Derome et al., 2016). Furunculosis in salmonids is described in three forms: the peracute, the acute and the chronic form (Cipriano & Bullock, 2001). Clinical indications of disease are darkening of the skin, exophthalmia, external and internal hemorrhages (Cipriano & Bullock, 2001; Derome et al., 2016), bleeding at the base of the fins, extended abdomen, occurrence of skin furuncles (Marana et al., 2016) and splenomegaly (Cipriano & Bullock, 2001).
Preventive measures include vaccines, which confer some protection against Asal in rainbow trout (Oncorhynchus mykiss). However, even vaccinated fish develop furunculosis, which indicates that vaccination against Asal does not protect the fish sufficiently (Marana et al., 2021; Pedersen et al., 2008). Furunculosis outbreaks are more common during summer periods with the concurrent rise in water temperatures (Pedersen et al., 2008).
DNA and RNA are released into the aquatic environment originating from various sources, including feces, mucus, bodily fluids, cells, scales, skin, cellular ruptures and microbial cells (Bohara et al., 2022). Consequently, it becomes feasible to isolate genetic material from this milieu. Detecting species through environmental DNA (eDNA) is an increasingly popular non-invasive detection methodology (Zhang et al., 2024). It has been implemented for detection of a wide range of species present in different environments (air, soil, water, snow, feces, etc.) (Bohmann et al., 2014). In aquatic environments, eDNA detection has been used to a great extent to estimate stock densities, biomass and for species identification. However, despite of its great potential, a standardized method for applying eDNA for biomonitoring is lacking (Ramírez-Amaro et al., 2022; Rourke et al., 2023; Takahashi et al., 2023). eDNA has proven valuable in detecting invasive species (Sepulveda et al., 2023) and mapping evolving global patterns. However, several challenges must be addressed before efficient eDNA monitoring strategies can be implemented and analytical techniques standardized (Thompson & Thielen, 2023). Nonetheless, these are aspects that lie beyond the scope of this manuscript. The use of eDNA measurements for management strategies has been discussed previously (Sepulveda et al., 2023) and is also an important aspect of the present study. eDNA consists of intra- and extracellular DNA (Bairoliya et al., 2022; Barnes & Turner, 2015; Nielsen et al., 2007). A recent application of eDNA includes the detection of pathogens in host organisms by only sampling the surroundings of the host. A study conducted by Jørgensen et al. (2020) demonstrated that environmental DNA (eDNA) sampling from water alone could successfully detect the presence of the parasite Bonamia ostreae in the habitats of the European flat oyster (Ostrea edulis) (Jorgensen et al., 2020). Bonamia ostreae is responsible for causing bonamiosis, a disease of significant economic concern that leads to mortality in both wild and farmed oyster populations (Jorgensen et al., 2020). Moreover, isolating environmental RNA (eRNA) from water samples could allow for the detection of gene expression changes in a non-invasive manner. Although eRNA is highly degradable, making environmental DNA a more popular choice, recent evidence suggests that eRNA is more stable than previously thought (Wood et al., 2020).
Elucidating the eDNA/eRNA (collectively eNA) profile of relevant aquaculture pathogens may have immense impact on management and prophylactic procedures in fish productions. Regular surveillance using only water samples is a novel, non-invasive, inexpensive and straightforward technique, which may lead to early interventions before the disease becomes established. By detecting Asal in the water, before the fish are severely infected can prevent severe clinical disease and mortality, leading to a decreased use of antibiotics, improved fish welfare and economy. In principle, if the eNA profiles of all fish-relevant pathogens were known, intelligent disease surveillance tools such as the high-throughput Fluidigm chip could be developed for screening the eNA of all the relevant pathogens from a number of water samples on one chip.
This study represents an inaugural investigation into the presence of environmental nucleic acids (eNA) in water during controlled infections of rainbow trout with two different concentrations of Asal. The concentration of Asal eNA was correlated with observable clinical signs, gene expression profiles, and the initiation of mortality in the fish. Our study furthermore demonstrates that pathogens can be detected non-invasively using eNA before fish show clinical signs of disease, which may facilitate the development of early warning systems and applications of preventive measures. The experiment was concluded upon the onset of mortality, at which time point preventive measures were overdue.
2 MATERIALS AND METHODS
2.1 Ethics
Experimental procedures were performed according to a license issued by the Experimental Animal Inspectorate, Ministry of Environment and Food, Denmark with license number 2019-15-0201-00388. Fish were euthanized when signs of distress were observed to ensure humane treatment and secure high animal welfare. These euthanizations were counted as mortalities.
2.2 Fish source and husbandry
Two hundred and ten rainbow trout intended for the experiment were procured from a certified pathogen-free hatchery (Aqua Baltic, Nexø, Denmark) and allowed to acclimate in our facility for a minimum of 14 days. Subsequently, they were evenly distributed among three 80-L tanks, each equipped with internal biofilters (EHEIM GhbH & Co.) with a flow rate of 20 L per minute, accommodating 70 fish per tank. The mean weight of the fish was 12.3 g prior to commencing the experiment. The experiment was conducted at a temperature of 18 ± 2°C.
2.3 Challenge with Aeromonas salmonicida subsp. salmonicida
Each of the three tanks represented a group: (1) uninfected, (2) low infection and (3) high infection with Asal. To challenge the fish with Asal, they were transferred from 80 L tanks to 10 L tanks with oxygenated facility water for 1 h. The infection conditions were either: (1) a mock-infection, (2) low infection with Asal broth (1.53 × 10⁵ colony forming unit [CFU]/mL), or 3) high infection with Asal broth (1.93 × 10⁷ CFU/mL). After 1-h bath challenge, all fish were carefully netted back to their respective 80 L tanks. Fish were then continuously monitored for the emergence of clinical signs until the onset of mortality.
2.3.1 Sampling
Confirmation of specific pathogen-free (SPF) status
Spleen samples from nine fish were obtained to detect that the SPF fish showed no expression of Asal gene AopO. In addition, head kidney swabs were spread on blood agar plates to confirm the SPF status of the fish. Hence, three fish were euthanized (300 mg MS222/L, Cat. no. E10521, Sigma-Aldrich) from each tank before the challenge to obtain these samples. The blood agar plates inoculated with head kidney swabs were incubated at room temperature for 96 h to confirm the absence of bacterial growth.
Spleen samples for gene expression
Spleen samples were collected to analyze systemic immune gene expression throughout the course of the disease. The aim was to validate that the reactions observed in rainbow trout corresponded to previously documented immune responses to furunculosis (Marana et al., 2019, 2021), thus confirming the typical disease progression in this study. Spleens from 10 fish per tank were collected for qPCR pre-challenge and again 2 and 4 days after challenge corresponding to the onset of mortality. The spleen samples were immediately placed in RNAlater (Cat. no. R0901, Sigma-Aldrich), kept at 4°C overnight and subsequently stored at −20°C until further processing.
Water samples for gene expression analysis
Water samples were obtained to analyze presence of Asal eNA and fish eNA during the course of furunculosis. The collected water samples were filtered through a membrane to collect eNA (Liang & Keeley, 2013), which subsequently was purified and kept for further analyses. Water samples of 0.5 L in quadruplicate per tank were obtained pre-challenge and at 24 h, 48 h, 72 h and 92 h after challenge. Hydrogen peroxide (3%, Cat. no. H1009, Sigma-Aldrich) was used to clean glassware between each sample filtration. The water was filtered through a 0.45 μm filter (Cellulose acetate, ADVANTEC®) for a maximum of 10 min or until all the sample was filtered. The filter was cut in two and one half of the filter was folded into a cone shape with forceps and placed into an Eppendorf tube containing 1 mL of RLT buffer (Cat. no. 79216, Qiagen) for conservation of eRNA and eDNA. Filters were incubated at room temperature for 15 min and subsequently stored at −20°C until further use. The eNA was purified following a modified protocol from manufacturer (RNA mini kit Cat. no. 74104, Qiagen). Shortly, the samples were thawed at room temperature and a 5 mm stainless steel bead (Qiagen) was added to each sample tube. The eRNA and eDNA were released from the filter using TissueLyzer (Qiagen) in 30 Hz for 2 × 4 min (right and left). The cooling block for sample homogenization was changed between each run. Samples were subsequently centrifuged at 10,000 rpm for 3 min and 600 μL of supernatant was collected. Then, 600 μL of 70% ethanol was added to the 600 μL sample supernatant and the solution was homogenized by pipetting up and down. The spin column from the kit was loaded with 600 μL of sample solution and centrifuged at 7500 rpm for 30 s. The flow-through was discarded and the procedure repeated until all the sample solution was loaded onto the column. The rest of the procedure followed the manufacturer's manual. Samples were eluted in 50 μL elution buffer and placed in −80°C.
Clinical signs
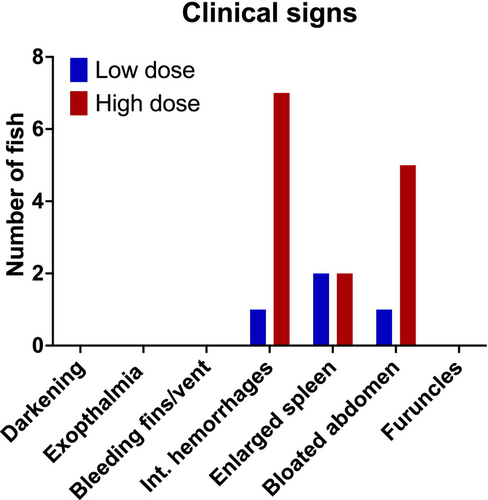
To assess the clinical impact of furunculosis on the fish, 10 rainbow trout per tank were sampled at 2 and 4 dpc to observe internal and external clinical signs. Clinical signs were evaluated by the presence or absence of darkening of the skin, exophthalmia, external and internal hemorrhages, splenomegaly, distended abdomen and furuncles.
2.3.2 Standard curve (SC)
To establish a correlation between the Ct values obtained from qPCR and the quantity of bacterial eNA present in the water, an SC was generated. The bacterium Aeromonas salmonicida subsp. salmonicida 111129-2/1 was cultured in Luria-Bertani (LB) broth in Erlenmeyer shake flask at 20°C. A 21-h bacterial culture with an optical density (OD) of 1.8, corresponding to a CFU count of 3.8 × 10⁹ (determined through preliminary correlations of OD and CFU values), was then diluted in sterile-filtered (0.2 μm) fish facility water, resulting in a CFU concentration of 1 × 10⁶ per liter. To create the SC, the solution was filtered in quadruplicate (4 × 0.25 L) through a 0.45 μm filter. The resulting filters were then each divided into half: one half was preserved in RLT buffer (Qiagen) to retain the eNA for subsequent extraction, whereas the other half was reserved for alternative purposes. From the eNA-containing filters, a 7-point SC was generated in triplicate using serial dilutions (1:10) and real-time qPCR targeting the bacterium. Briefly, on each half filter replicate, eNA from 125,000 bacteria were present. Following purification and elution in 50 μL elution buffer, the concentration of eNA corresponded to 2500 Asal/μL. The eNA stock was then serially diluted six times by a factor of 10, resulting in concentrations corresponding to: (1) 250, (2) 25, (3) 2.5, (4) 0.25, (5) 0.025, and (6) 0.0025 bacteria/μL. Five microliters of each dilution were utilized as a template for the qPCR reactions.
2.3.3 cDNA synthesis
Spleen
Spleen samples were homogenized (Tissue-lyser II, Qiagen) and RNA was purified by following the GenElute Mammalian Total RNA Miniprep Kit (Cat. no. RTN350, Sigma-Aldrich) manual and subsequently treated with DNase I solution (Cat. no. 89836, Thermo Fisher Scientific). Purified samples were measured on nanodrop 2000 (Saveen & Werner APS) to check the RNA concentration and quality. The samples were furthermore analyzed on a 1.5% agarose gel and visualized with ethidium bromide for presence of DNA residuals. cDNA was synthesized in a T100 thermocycler (Biorad) using random hexamer primers and TaqMan® reverse transcription reagents following the manual (Cat. no. N8080234, Thermo Fischer Scientific): 20 μL total volume reactions consisted of 10 μL RNA (consisting of 400 ng RNA + RNase-free water [Cat. no. 10977035, Invitrogen]), 1.16 μL RNase-free water (Cat. no. 10977035, Invitrogen), 2 μL 10× RT-buffer, 0.44 μL 250 mM MgCl2, 4 μL dNTP Mix, 0.4 μL Hexamer, 1 μL RN'ase inhibitor and 1 μL Transcriptase, 50 u/μL.
Water
cDNA was synthesized as part of a one-step qRT-PCR from purified eNA from water samples using QuantiTect probe RT-PCR kit (Cat. no. 204443 Qiagen) following the manual.
2.3.4 Quantitative RT-PCR (qPCR)
Spleen
The genes investigated in the spleen by qPCR analysis targeted the immune-relevant genes: saa, ifnγ, cxcl8, il10 and il22 (Appendix S1). Quantitative PCR was performed using AriaMx Real-Time PCR machine (G8830A-04R-010, AH diagnostics AS). The 12.5 μL total volume reactions consisted of 2.5 μL cDNA, 6.25 μL Brilliant III Ultra-Fast QPCR Master Mix (Cat. no. 600,881, AH Diagnostics AS), 1.0 μL primer–probe mixture (10 μM forward primer and reverse primer, 5 μM Taq-Man probe) and 2.75 μL RNase-free water (Cat. no. 10977015, Invitrogen). Reverse transcriptase minus (NO-RT) and negative controls (NTC) were used for every plate setup. In this study, elfα (Appendix S1 and S2) was used as a housekeeping gene for the spleen analyses.
Water
The genes examined in the water were aopO, targeting Asal and cytb and saa, targeting rainbow trout (Ct values can be seen in Appendix S3 and S4). The mitochondrial gene encoding Cytb exhibits high expression levels in rainbow trout and was thus selected as a housekeeping gene (Shekh et al., 2017) in the water samples. This approach is based on the premise that the concentration of cytb in the water will correlate with the number of fish present. Consequently, we propose employing cytb as a reference gene for aopO expression detected in water, allowing for standardization of aopO expression relative to the fish population in the enclosed system. Additionally, the acute phase protein Saa is known to be significantly up-regulated in tissues during Asal infections. Therefore, we sought to determine whether this up-regulation could be detected in the water using eNA, also utilizing cytb as a housekeeping gene. Each 96-well plate for qPCR included cDNA/eDNA samples from the water and a 7-point standard curve in quadruplicates diluted with a factor 10. Quantitative PCR assays were performed with the QuantiTect probe RT-PCR kit (Cat. no. 204443, Qiagen) following the manual. At 4 dpc the time point controls were lost when analyzing cytb and saa. Therefore, an average of all the stable timepoint controls was used (Appendix S4).
Data analysis
Gene expression was calculated based on the method by Livak and Schmittgen (2001). Statistical difference (p < 0.05) between the challenge groups and the control was calculated in GraphPad Prism 10 with a Student's t-test assuming a Gaussian distribution. In addition, the geometric standard error of fold changes was calculated.
2.3.5 Correlation
Correlations were determined between the eNA fold change in the water and the fold change of immune-relevant genes in the spleen to investigate whether the infection pressure from the pathogen detected in the water could be correlated to any immune gene, potentially providing a rapid surveillance of fish health by only sampling water. Significant correlations (p < 0.05) were determined with Pearson r in GraphPad Prism 10 assuming a Gaussian distribution.
3 RESULTS
3.1 Mortality and clinical outcome
Rainbow trout received a challenge with a low and a high dose of Asal to investigate the presence of pathogen and host eNA in water samples and disease outcome in the fish. Mortality commenced at three dpc with one fish mortality recorded from the high-dose group. By 4 dpc, 8 fish from the high-dose group were moribund and subsequently euthanized, accounting for mortality. Immediately after this, the experiment was terminated. Fish were meticulously examined for various clinical signs and the presence of furuncles. Clinical signs were absent during the initial sampling point at 2 dpc. However, during the subsequent sampling point at 4 dpc, three fish from the low challenge dose group and 7 fish from the high challenge dose group exhibited multiple visible signs of infection (Figure 1).
3.2 Environmental nucleic acids in water samples
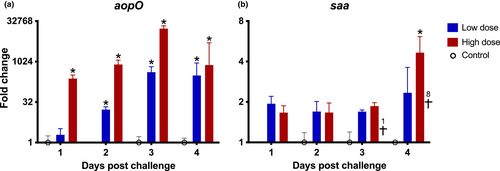
eNA was monitored in water samples daily throughout the experiment, targeting the genes cytb and saa in rainbow trout, and aopO in Asal. In general, the fold change of aopO (Figure 2a) was observed to be higher in the group subjected to a high challenge dose compared to the low challenge dose group (raw data in form of Ct values can be found in Appendix S3). For the low-dose group, the mean fold change exhibited a gradual increase, reaching a plateau at 3–4 dpc. Conversely, in the high-dose group, the maximum fold change was observed at 3 dpc. The upregulated expression of an immune-related gene saa from rainbow trout in water samples was detected, demonstrating significant upregulation at 4 dpc, coinciding with the increase in mortality (Figure 2b).
3.3 Standard curve
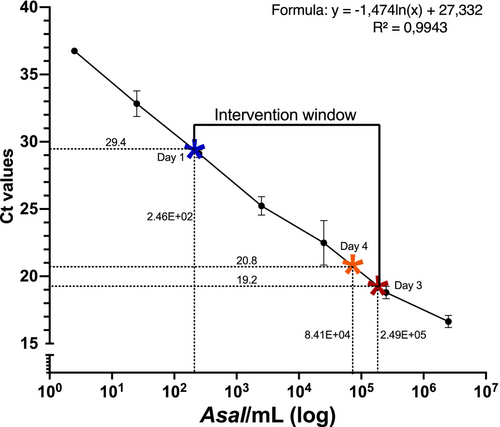
A SC was generated to plot the Ct values of water samples obtained with qPCR and calculate the corresponding bacterial concentrations in the water. The SC was based on the mean Ct values of quadruplicate samples of a dilution series (1:10) with a known amount of Asal in the water (Figure 3). The formula for the fitted line for the SC was y = −1.474ln(x) + 27.332 with R2 = 0.9943. The highest mean Ct value (29.4) for the Asal aopO gene (lowest concentration of eNA) was measured at 1 dpc in the low-dose fish tank (indicated by a blue star in Figure 3) with a corresponding low concentration of bacteria (2.46E+02 bacteria/mL). When mortality began at 3 dpc, the average Ct values in both low- and high-dose tanks decreased reaching as low as 19.2 in the tank with the high concentration of bacteria (red star in Figure 3) corresponding to 2.49E+05 bacteria/mL. At mortality peak, before the experiment was ended, the Ct value had increased to 20.8 in the high-dose tank (orange star in Figure 3).
3.4 Gene expression
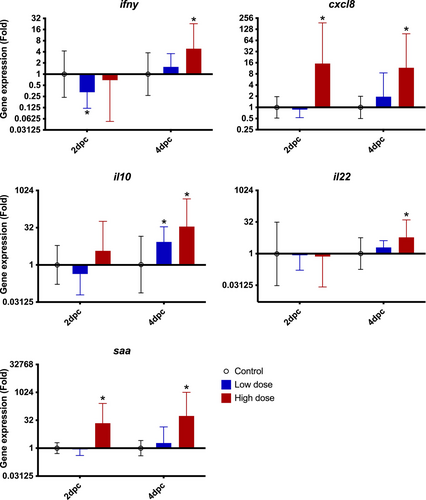
Immune-relevant gene expression was conducted to confirm that the fish had a normal immunological reaction towards the pathogen and to correlate the gene expression patterns to the eNA profile in the water. Gene expression in the spleen of the high-dose group showed mostly a significant up-regulation of the pro-inflammatory factors saa, ifnγ and cxcl8 at 2 and 4 dpc. Furthermore, the modulatory cytokines il22 and il10 were also up-regulated at 4 dpc (Figure 4, Appendix S2).
3.5 Correlation
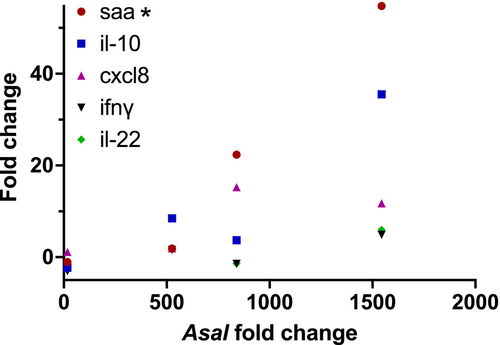
To ascertain whether pathogen gene regulations detected in water samples could be linked to the immune response elicited by the disease in rainbow trout, a correlation analysis was conducted. The fold change of Asal eNA in the water was correlated with the fold change of immune-relevant genes in the spleen for both the low- and high-dose groups. A significant correlation was observed (r2 = 0.92) between Asal eNA in the water and the saa gene expression in the spleen (Figure 5).
4 DISCUSSION
To our knowledge, this is the first time the eNA profile of a bacterial fish pathogen and the immune-relevant gene expression in fish has been investigated in water during controlled experimental conditions. The economically important fish species, rainbow trout was infected with the opportunistic pathogen Aeromonas salmonicida subsp. salmonicida, which causes the severe disease, furunculosis, in salmonids (Cipriano & Bullock, 2001; Marana et al., 2016, 2021). The new eNA methodology allowed us to detect the environmental pathogen load in the water of fish tanks before severe clinical disease appeared and beyond which, effective control measures are no longer applicable. This new technique can lead to intervention or treatment during the early phase of infection and thus prevent the spread of the pathogen and avoid fish morbidity and mortality. This improves sustainability, the welfare of the fish and reduces economical costs for the fish production facilities. Conclusions of this study are similar to previous research where the prevalence of salmonid alphavirus (SAV) was investigated in seawater containing infected Atlantic salmon (Salmo salar) (Bernhardt et al., 2021).
In this study, fish became moribund after infection with Aeromonas salmonicida subsp. salmonicida. Fish reacted with a strong immunological response, in agreement with previous studies (Marana et al., 2021) and the mortality started with one dead fish at 3 dpc and 8 dead fish 4 dpc. Therefore, the disease progressed similarly to other studies (Marana et al., 2019, 2021) and to a situation normally occurring in a fish farm. The expression of immune-relevant genes observed here is also comparable to what has been found and discussed in previous studies in rainbow trout (Marana et al., 2019, 2021). Both genes targeting rainbow trout (cytb, saa) were expressed in the water and a significant increase in saa was observed 4 dpc. In the spleen, the up-regulation of saa was much more pronounced compared to that found in the water.
Here we provide a proof of concept that strong gene regulations in rainbow trout can be detected in water using standard qPCR. This finding has a potential effect on the 3Rs principle (Replacement, Reduction and Refinement in animal experimentation) and fish welfare as the further improvement of techniques to purify and amplify eRNA can lead to an increasing use of non-invasive sampling. A recent study showed that gene expression of Japanese medaka (Oryzias latipes) exposed to pyrene was detectable in the water using sequencing, supporting our findings (Hiki et al., 2023).
Using a standard curve with known bacterial concentrations, we estimated a window for intervention under the experimental conditions applied, from when the pathogen became detectable in the water to the point where mortality started (Figure 3). The severity of furunculosis can vary depending on environmental conditions, e.g. temperature. At lower temperatures where Asal is replicating slower, the window for treatment is wider and fish farmers have a better chance to initiate interventions – and vice versa. Furthermore, each farm has different farming conditions and different strains of Asal which may vary in virulence (Long et al., 2016) and thereby complicate a standardized intervention strategy. Here we demonstrated that a high level of Asal eNA in the water correlated with a probable high bacterial transmission rate, especially because the aopO gene has been linked to virulence in Asal (Dacanay et al., 2006). The whole Asal bacteria was probably captured on the filter and not only the bacterial extracellular eDNA. The standard curve is based on a dilution of live/dead bacteria and the ratio of intracellular/extracellular eDNA is unknown, likewise in the experimental setup. This may introduce bias in the calculations of bacterial load from the standard curve but in our opinion, this is a minor issue.
A significant positive correlation for transcripts of the saa gene in the spleen of fish and eNA from Asal in the water was found in this study. Whether this correlation is always present, needs to be investigated further. Should this be the case, the response in the fish affected by Asal can be estimated non-invasively from sampling water only.
This study focused on a single bacterial fish disease. However, other fish pathogens may exhibit distinct eNA profiles and consequently different optimal intervention periods. Future research should aim to characterize the eNA profiles of various pathogens relevant to aquaculture to elucidate their respective patterns in aquatic environments and determine appropriate intervention timings. Additionally, analysis of water samples for multiple pathogens could enhance our comprehension of co-infections and their dynamics, if we know these profiles.
High-throughput chips or qPCR technologies to detect pathogens in aquaculture are being developed at a few places in the world, including at our lab (Hanxi et al., 2023; Jørgensen & Andersen, 2021; Shea et al., 2023). They are based on qPCRs and Ct values, which are used as output. These chips are meant to determine the presence or absence of the pathogens, and to some degree, the quantity of the pathogen. Such eNA-based techniques can facilitate broad-range surveillance schemes of several pathogens simultaneously. In our opinion, controlled experiments, like the present study, are crucial to interpret and validate chip results in relation to the disease situation in the fish and to use the results for intervention measures.
5 CONCLUSION
Using an eNA approach, we detected Aeromonas salmonicida subsp. salmonicida from the surrounding water with infected rainbow trout before the fish showed any signs of disease. An intervention window was determined from a standard curve spanning from early detection without clinical diseases to the beginning of mortality. The bacterial concentration in the water at early detection and at the beginning of mortality was estimated. This approach facilitates interventions before fish become moribund and mortality starts. An up-regulated expression of saa in the fish was furthermore detected in the water enabling non-invasive analyses of strong immune responses.
AUTHOR CONTRIBUTIONS
The conception or design of the study (MHM, CH, LvGJ). the acquisition, analysis, or interpretation of the data (MHM, HMJ, DHC, PEP, MMD, YD, CH, LvGJ). writing of the manuscript (MHM, LvGJ).
ACKNOWLEDGMENTS
This project was funded by The European Maritime and Fisheries Fund and The Danish Fisheries Agency under the Ministry of Food, Agriculture and Fisheries of Denmark (J nr 33111-I-21-070). We acknowledge Inger Dalsgaard from the Technical University of Denmark for providing us with the Aeromonas salmonicida subsp. salmonicida strain 111129-2/1.
CONFLICT OF INTEREST STATEMENT
There is no conflict of interest.
Open Research
DATA AVAILABILITY STATEMENT
Data is fully available in the manuscript and in the appendixes.


