A hybrid Harrison Hawk optimization based on differential evolution for the node localization problem in IoT networks
The copyright line for this article was changed on 13 December 2022 after original online publication.
Summary
Despite the close of a tumultuous 2020 and the start of 2021, connected devices will continue to shape the future of numerous industries, and businesses are confident that the Internet of Things (IoT) will play a key role in the future success of their trade. The growing Internet of Things (IoT) is connecting devices to a variety of sensors, applications, and other IoT elements to automate business processes and support human efficiencies in business and the home. WSN along with node localization algorithms can play a critical role in IoT applications. Nevertheless, in IoT applications, the context of real-time location-based services is gaining an overwhelming interest. To do this, several approaches are proposed in the recent literature based mainly on computational intelligence algorithms. This paper proposes a node localization algorithm based on swarm intelligence algorithms, that is, a hybrid Harris Hawks optimization based on differential evolution (HHODE).HHODE algorithm relies on Euclidian Distance as objective function to evaluate best-fit coordinates of sensor nodes in a wireless sensor network. Moreover, several experimentations are performed depending on the network size, communication range of sensors, geographical distribution, and the beacon nodes' density to demonstrate the efficiency of the HHODE algorithm. Compared to Standard DE, HOO, PSO, and Bat Algorithm, HHODE shows higher performance with regard to node localization.
1 INTRODUCTION
The Internet of Things (IoT) allows the connections of thousands of sensors, actuators, and smart devices for persisting connectivity, autonomously gathering, and sending information. The placement of the sensors is unnecessary predefined; they might be haphazardly distributed in a region known as the “sensing field,” which corresponds to the field of concern for the phenomena being observed.
The effective use of IoT networks or D2D communication1 has offered up a bunch of emerging research fields like transportation, biological monitoring, wearable computing,2 Crowd Dynamics Management,3 and so on where many problems are observed and treated in IoT Networks, like “energy consumption,4, 5 fault tolerance, scalability, deployment, and topology maintenance.”6
The most important challenge in IoT networks is node localization.7 In addition, the node localization is important in several fields and has received much attention in a variety of smart applications sectors such as water quality monitoring, intrusion detection, sniper localization, and health monitoring.
The fundamental purpose of node localization is estimating the nodes' positions from unknown location information employing the real positions' awareness of a small number of sensors and inter-sensor distances. The sensors with unknown location information are called non-anchor nodes where sensors with known location information are called anchor or beacons nodes. The aptitude to self-localize is particularly effective in environmental monitoring applications.
- the device's expensive cost in matters of measurement, power, computing time, and area; and
- service's low accuracy in specific settings (indoors, underground, etc.).
The emerging tendency in processing with the node localization problem is using a small number of beacons and to call the communication methods presented in Kulkarni and Venayagamoorthy9 for the localization of unknown nodes rather than applying GPS, where the sensor network localization method will estimate their locations.
Newly, Hawks optimization based on differential evolution (HHODE) is proposed10 as a hybrid metaheuristic algorithm. In this paper, HHODE is proposed for the issue; HHODE is a hybridization of Harris' Hawk optimization algorithm11 exploration phase with the differential evolution algorithm12 to ensure a balance between exploration and exploitation. In addition, the proposed algorithm provides a large solution space to discover and to analyze optimal potential solutions among exploitation phase, and it clearly shows its effectiveness when it comes to localization time and error.
This paper is presented in eight sections. The overview of the node localization problem by a metaheuristic algorithm where related work is given in Section 2. Section 3 introduce the HHO algorithm, while the Section 4 presents the node localization problem based on HHODE algorithm. The performance evaluation and a comparative study are shown in the Section 5. The final section contains our conclusion.
2 RELATED WORK
- The nodes' mobility.
- The environment of deployment.
- The distance estimation.
- Network dimension.
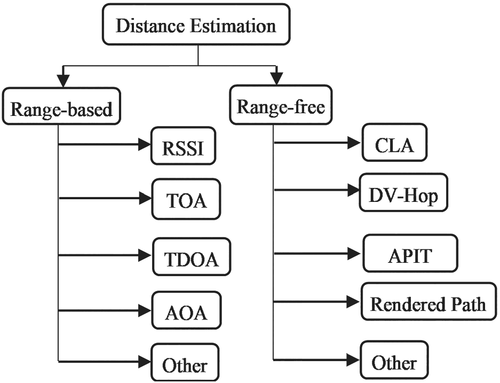
“Range-based uses the communication range for distance estimation to determine the nodes moreover at (2D)” as in Zhang et al.13 or more beacon nodes (3D) as in Ahmad et al.14 The most popular are as follows:
“Received Signal Strength Indicator (RSSI)”,15 “Angle Of Arrival (AOA)”,16 “Time Of Arrival (TOA)”,17 and “Time Difference Of Arrival (TDOA),”18 and recently other.19
Range-free based, instead, uses connection or proximity data to estimate distance. The generally used are “Distance Vector-Hop (DV-Hop),” “Approximate Point in Triangulation Test (APIT),” “Centroid Localization Algorithm (CLA),” “Rendered Path (RP),” and so on.20
Distance estimation algorithms are chosen based on their impact on the system's performance, and each one is targeted to a certain application field.
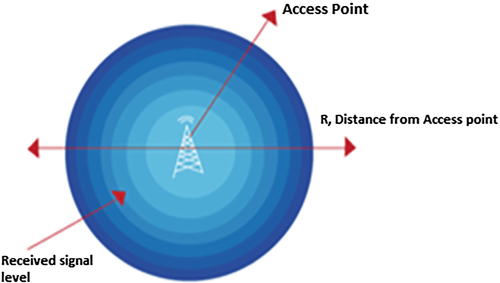
The second step of the node localization scheme is position computation. With the data from the previous step, it's feasible to compute the locations of the target nodes. A lot of methods are used in this step like “trilateration (Figure 3A), multilateration (Figure 3C) and triangulation (Figure 3B),”21 “probabilistic approaches,”22 “bounding box,”23 and “the central position and fingerprinting.”24

In the final step, for computing the target nodes' location using beacon nodes, a fusion scheme is realized between the two steps: distance estimation and position computation, as schematized in Figure 3.
Localization algorithms have received a considerable interest in the previous decade; primarily, mathematical techniques to deal with node localization problems are suggested.
Node localization is treated in Zhu et al.25 by using maximum likelihood estimation. In previous studies,26, 27 two received signal strength indicator (RSSI) based approaches were developed where wireless sensors could find their position using WLAN technology in an indoor environment. The first approach uses a training session, and the position is based on neuronal networks using training measurements. The second approach uses triangulation model with some fixed access points.
Even if these traditional methods of operations research work well, huge computing efforts and overhead communication are required, which expand exponentially while the problem size grows. In addition, it is impossible to ensure the WSN's ability to manage growing sensor nodes, as well as to provide a very important localization time that will affect not only the power usage of the nodes but also the whole network.
Metaheuristic and swarm intelligence techniques have recently been seen as effective methods for dealing with the node localization problem, where a large amount of stochastic population-based approaches are addressed.
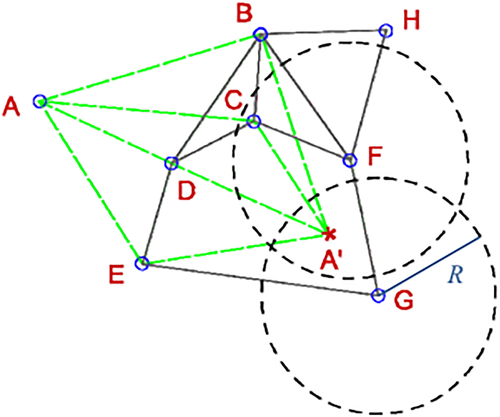
- the flip ambiguity problem, schematized in (Figure 4) is neglect in this approach; and
- the nodes communicate with the base station directly. So high communication range is needed.
- localization time are not evaluated in this work; and
- the Bat parameters chosen were not adjusted to the issue where the pulse rate is very high and maximum frequency is quite low.
In 2019, a new technique called moth-flame optimization algorithm (MFOA) has been suggested to overcome with the node localization problem.31 Moreover, the moth moves effectively via different trajectories, like the spiral trajectory. The simulation results indicate the efficiency of the algorithm.
For better accuracy, whale optimization algorithm (WOA)32 is addressed. WOA calculates node locations using multi stage method to traverse the entire network area. When applied to an enormous WSN, this method performs well with regard to node localization. The simulation results demonstrated WOA's superior performance in matters of localization error and computing time.
The salp swarm algorithm (SSA) was proposed to improve node localization.33 It was compared to the particle swarm optimization, the firefly algorithm, the grey wolf optimization algorithm, and the Butterfly optimization algorithm. The simulation results demonstrate that the proposed method outperforms the other techniques.
In order to improve localization precision, dolphin swarm optimization (DSO)34 was used to the M-curves' trajectory. The suggested route provides broad coverage and excellent position dependability. Despite this, the power usage was entirely ignored. When you browse the whole network using M-curves, you exhaust the mobile node, and the network goes down.
In 2020, an enhanced method based on Bat algorithms using a parallel position is proposed35; the fundamental concept involves a central mobile node of some network nodes proceeding with a spiral trajectory for finding the nearby nodes. The simulation results show an outstanding localization quality in terms of accuracy and energy consumption.
An enhanced fruit fly optimization algorithm (EFFOA) is presented36 for better node localization accuracy with swarm intelligence. The simulation results on different studies and situations show that EFFOA exceeds some famous optimization algorithms.
A new optimization approach known as the sine–cosine algorithm is proposed37 to resolve the localization issue. The suggested approach resolves the problem of flip ambiguity. In terms of localization accuracy, the number of localized nodes and the speed of localization, the experimental results revealed good performance when compared to GWO, PSO, and GA algorithms.
In 2021, Nguyen et al.38 present a novel hybrid swarm evolution method (HSEA) for node localization. The HSEA is constructed by mixing the particle swarm optimizer (PSO) and the differential-evolution (DE) algorithms. The simulation results of the proposed method shown that HSEA enhanced the efficiency in the matters of localization error and localized nodes' number than other algorithms.
In Nguyen et al.,39 glowworms swarm optimization (GSO) was introduced for better localization accuracy. The objective function was stated mathematically by using a three dimensions localizing model's (3D) and Pareto distances. Outcomes show that GSO outperforms both PSO and CS algorithms.
In Dao et al.,40 ant lion optimizer (ALO) was developed to solve localization issue. In the tests, the impacts of parameters such as node density and communicating range are evaluated in order to evaluate the effectiveness of the proposed technique in terms of mean localization error and percentage of success. When compared to the results of the tests with cuckoo search (CS) and particle swarm optimization (PSO), the proposed approach clearly outperforms the competition in terms of location accuracy.
A new technique to localization in WSNs utilizing the KH algorithm has been suggested.41 Trilateration is used to compute the non-anchor node positions. In terms of accuracy and error, the performance evaluation revealed that the KH-based localization algorithm outperforms PSO and IAL algorithms.
For greater accuracy with swarm intelligence, Hawks optimization algorithm (HHO) is proposed.42 The simulations results show that the algorithm surpasses some approaches in computation cost and accuracy.
3 HARRIS' HAWK OPTIMIZATION (HHO)
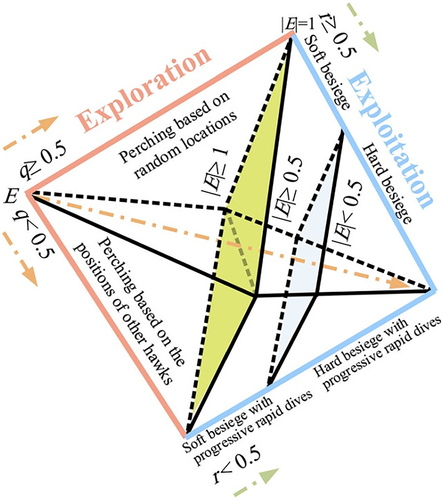
Harris Hawks optimization (HHO) is a population-based, gradient-free optimization technique proposed in Birogul,10 “ it is based on Harris Harris' Hawk's strategy in catching its prey, where certain Hawks attack from various angles the selected target in coordination for instant disorientation. The goal is to reach the prey neatly. The attack should be done within seconds. Nevertheless, in some cases, based on the prey's getaway power and tracking territory, the objective can be achieved in a brief time and with a huge amount of attacks. There is a leader during the coordinated attack. A new Harris' Hawk will take up the leadership if the first one becomes exhausted while chasing the prey or during the attack. Thus, Attacks continue in this manner until the hunt is successful or until prey escapes. This is a strategy that is sometimes employed. To confuse and tire the prey, it is necessary to attack from many directions at the same time. The operation is done when Harris' Hawk, the leader of the hunt, easily chases down the exhausted prey.” Figure 5 shows all steps and process of HHO, which are presented in the next subsection.
3.1 Exploration
3.2 Transition from exploration to exploitation
3.3 Exploitation phase
3.3.1 Soft besiege
∆X(t) is “the difference between the position vector of the rabbit and the current location in iteration t,” is a “random number inside (0,1),” and “J = 2 (1 − )” represents “the random jump strength of the rabbit throughout the escaping procedure.” The J value changes randomly in each iteration to simulate the nature of rabbit motions.
3.3.2 Hard besiege
3.3.3 Soft besiege with progressive rapid dives
where , are “random values inside (0,1),” is “a default constant set to 1.5.”
3.3.4 Hard besiege with progressive rapid dives

4 NODE LOCALIZATION BY HARRISON HAWK OPTIMIZATION BASED ON DIFFERENTIAL EVOLUTION ALGORITHM (HHODE)
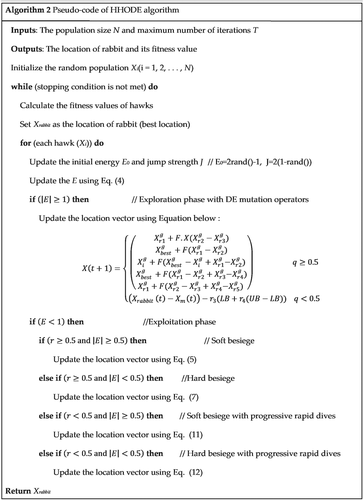
“The HHODE controls an overall population space which is shared by HHO and DE. The differential evolution (DE) optimization has the benefit that, in the course of local search, the diversity in the population”. The pseudo code of the HHODE is given in Figure 7.
- random deployment of N beacon nodes and M unknown nodes, with the same range of communication;
- the beacon nodes compute the locations and send their positions using RSSI;
- localized nodes are defined as nodes that are encircled by three or more beacons;
- the localized node computes its distance to every neighboring beacons. An actual distance between the target node , and ith beacon ( , ) is described as
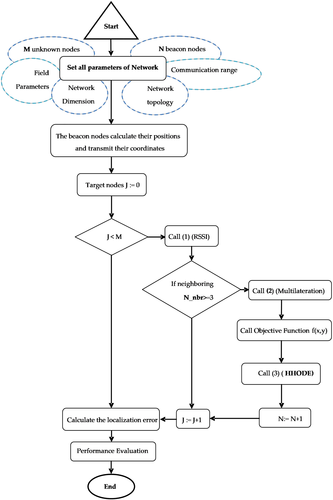
- Each localized node autonomously runs HHODE to determine its location by computing its positions (x, y). The objective function (mean square error between actual node positions and estimated distances) is computed as follows:
- At every iteration end, nodes that have been founded perform as beacon nodes in the following iteration. This decreases the probability of the flip ambiguity.
- The steps 2 to 6 repeated by a number of iteration defined or until all target nodes get localized or no more nodes can be localized. The mean localization error (MLE) is computed as the mean square of Euclidean distance so of computed node coordinates ( ) and the actual node coordinates ( for i = 1,2, …. ML determined for HHODE algorithm, as shown below:
5 SIMULATION EXPERIMENTS AND PERFORMANCE EVALUATION
Several parameters have been examined to evaluate HHODE's performance like: population size, convergence of the algorithm, anchor density, communication range, Moreover, a comparative study is done with some metaheuristics as Standard DE, HOO, PSO, and Bat Algorithm by providing various criteria.
5.1 The main standards
The main standards46 used to evaluate the performance are:
5.1.1 Mean localization errors (MLE)
The mean distance between the estimated location ( ) and the real node coordinates ( .
5.1.2 Mean computing time (MCT)
5.2 Simulation setup
In this subsection, all the simulations are performed using MATLAB environment on a laptop of 8 GB memory and i5-2.4 GHz CPU to evaluate the performance of HHODE. In our simulation experiments, the sensor nodes are randomly deployed over a 50 m x 50 m meters square area. The number of sensors is 200 where 40 anchor nodes are taken. The transmission range of sensor node is 30 m. The initial deployment of sensor node is random, in each iteration; the number of localizable nodes is not expected to be the same. The unknown nodes' coordinates are calculated using HHODE.
5.3 Evaluation parameters of HHODE
5.3.1 The effect of communication range
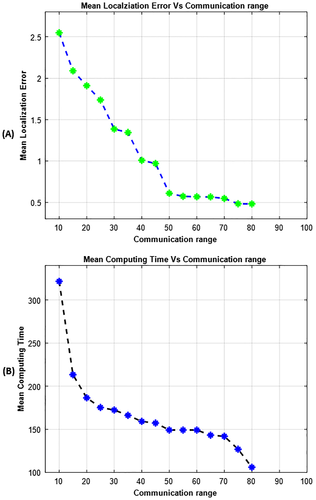
The communication range specifies whether or not unknown nodes are covered by the beacon nodes and having more than three beacon nodes around them, which is one of the most essential parameters. The obtained result is depicted in the following figures. From Figure 9A, it is observed that for a range less than 20, the localization error is insignificantly high. The phenomenon can be explained by the nodes are scattered in the networks, and the connectivity is low also depends on the preliminary deployment. On the other hand, we perceive that the communication range is over 20, make the localization error decline; as the result, there is more anchor information to compute the position of unknown nodes. Although at a certain value of the range, the localization error gradually declines. From the localization time versus communication range shown in Figure 9B, we see that the algorithm convergence rapidly; this is because, in the case of a little communication range, the unknown nodes are quickly localized by the beacon nodes with a major error. The greater the communication range is, the lengthy the computing time will be. The environmentally noise affects the unknown node as well the localization error. In conclusion, the computing time is excellent and with the suitable communication range, which keeps the power usage low.
5.3.2 The effect of anchor density
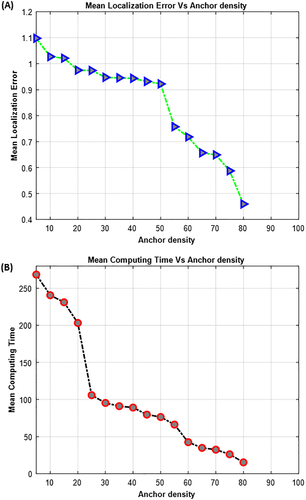
The beacon nodes' density as an important parameter affects the localization performance and the wireless sensor network cost. To evaluate this effect, various experiments were conducted. Figure 10A show the localization error versus anchor density. It showed up that the MLE progressively reduced according to the progression of density; once the density increments, the network connectivity is high. On the other hand, we can see from Figure 10B that localization time reduces as the number of anchor nodes increase, this is because additional localized nodes become anchor nodes at each iteration, reducing the number of unknown nodes.
5.3.3 The effect of population size
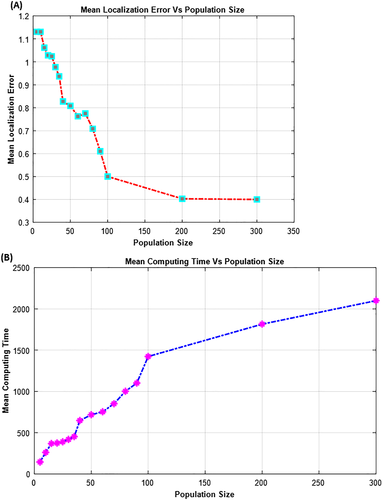
The population size is an important determinant in the algorithm's convergence, especially during the exploration phase. Moreover, a study of the localization problem with population size variations was performed (communication range = 30, number of iteration number = 30 iteration and anchor density is 20 sensor nodes). In Figure 11A the simulation results indicate the fast convergence of the algorithm when the population rate is high, which advantages the algorithm in the exploration phase. Furthermore, Figure 11B show that the localization error is inversely related to the computing time. Because hawks were involved in determining the global minimum values of optimal positions for unknown nodes, As a result of this, the network is able to maintain its energy consumption and optimize its lifetime.
5.4 Comparative study
In this sub-section, a descriptive analysis is simulated and examined of “HHODE,” with Standard DE, HOO, PSO, and Bat Algorithm. The nodes' deployment is shown in Figure 12, and the number of nodes is 200 nodes, deployed in random way in 50 m × 50 m (two-dimension) network space with 40 beacon nodes.
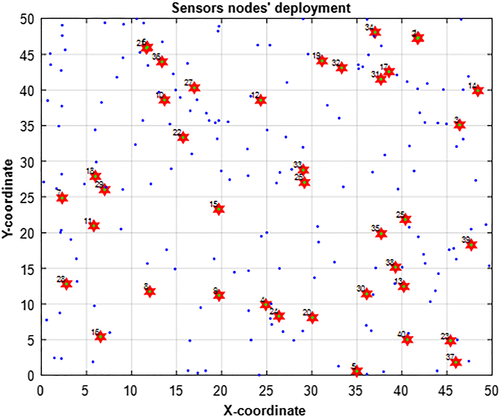
Figure 13A illustrates the progression of HHODE in terms of localization error with other meta-heuristics. The simulations demonstrate that the minimal localization error is reached by HHODE. The presented algorithm very easily converges and gives the ideal result, especially with the increases of iterations. HHODE gives high accuracy position relatively to other meta-heuristic algorithms. In addition, Figure 13B presents the variation of localization time, where every algorithm run-time is calculated regarding iteration number. Calculations are totally carried out on the unique system in seconds. From the above we conclude that a minimal calculation let the HHODE determines maximal unknown nodes' location in few iterations in comparison to other algorithms.
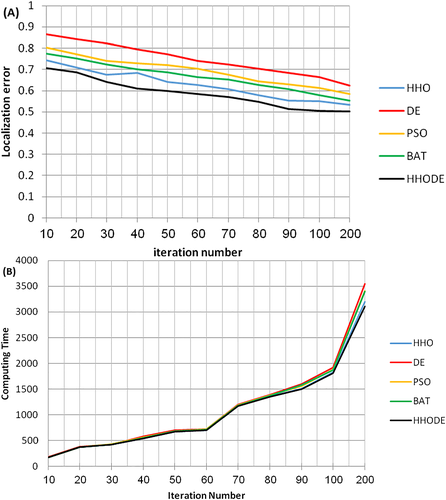
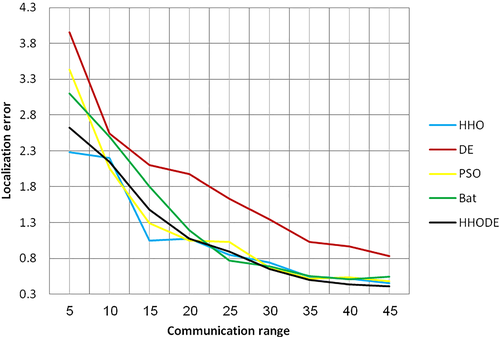
Figure 14 represents the variations of localization error according to communication range. We see that the localization error obtained by DE is very high compared to other algorithms. When communication range is over 30, HHODE outperform the others algorithms and gives the smallest localization errors, this due that the HHODE algorithm is able to show high and competitive exploration and exploitation functions.
6 CONCLUSION
In order to utilize the distance in node localization in WSN with higher ranging accuracy, an multilateration location-based metaheuristic (HHODE) algorithm is proposed.
Compared to popular swarm intelligence approaches like Standard DE, HOO, PSO, and Bat algorithm, the proposed algorithm has improved location accuracy and time response.
Several experiments have been carried out varying relevant network parameters such as network size, number of beacon nodes, and communication range of nodes.
Such experiments have proven a higher localization node accuracy as well as time response. This latter property of time response is critical in real-time application in an IoT infrastructure.
In the case of large environmental disturbance, it needs to adopt efficient corresponding methods to solve the problem of node localization. Node layout research based on two-dimensional level has limited application scope. Gradually realizing efficient location in three-dimensional level will play a greater role in intelligent buildings, large shopping malls and other scenarios.
Future works will emphasize on multiobjective optimization scheme in three-dimensional scenario by considering power consumption and scalability of the network in order to improve the network lifetime.
Furthermore, security aspects must be taken care of when dealing with node localization.
Fake position coordinates can be easily provided by a malicious beacon node. Resilient schemes have to be developed to overcome vulnerability in mobile wireless sensor networks.
Open Research
DATA AVAILABILITY STATEMENT
Data sharing not applicable to this article as no datasets were generated or analysed during the current study.


