Machine-learning analysis identifies “elite” viral controllers with increased survival and homeostatic responses in critical COVID-19
Nadia García-Mateo, Alejandro Álvaro-Meca, Tamara Postigo, Alicia Ortega, Jesús F. Bermejo-Martin, Ana P Tedim, Salvador Resino, and Antoni Torres contributed equally to this work.
Dear Editor,
The outcome of COVID-19 disease is strongly related to the interaction between the virus and the host immune response, which may become dysregulated in critically ill patients. This dysregulated response is characterized by elevated levels of inflammatory mediators, an overactivation of the innate immune system,1 lymphopenia,2 delayed antibody and interferon responses,3 and a massive dissemination of viral components into the blood,4 all of which contribute to severity and increased mortality.5-7 These immune and non-immune parameters can be integrated into so-called combitypes8 to identify subgroups of patients with different immune profiles and outcomes, helping to guide clinical strategies. In a previous study we used viral RNA levels in plasma to categorize a multicentre cohort of critically ill COVID-19 patients into three subgroups with different mortality rate.4 In this study, we combined virological data (SARS-CoV-2 N1 RNA plasma load and N-antigenemia) and 32 host response biomarkers to improve classification of critically ill COVID-19 patients, with the objective to identify biological clues explaining survival.
We conducted a prospective cohort study in 785 critically ill COVID-19 patients with a plasma EDTA sample collected at intensive care unit (ICU) admission. The detailed methods and the biological parameters measured are summarized in the Supporting Information. The biological characteristics of 90-day survivors compared to non-survivors (Table S1) indicated that non-survivors were more likely to exhibit the presence of SARS-CoV-2 N antigen, along with higher viral RNA load in plasma, higher tissue damage (RNase P RNA), lower lymphocyte counts, and higher neutrophils levels. Additionally, non-survivors exhibited increased concentrations of multiple biomarkers involved in endothelial dysfunction (angiopoietin 2, endothelin-1, ICAM-1 and VCAM-1), inflammation (TNF-α, IL-15 and IL-6), coagulation (D-dimmer), chemotaxis (CXCL10, CCL2, and IL-8), immunosuppression (IL-10, PD-L1, and IL1-RA), T-cell biology (CD27), apoptosis (Fas) and innate immune-related proteins (EGF and SP-D).
Based on these biological characteristics, XGBoost algorithm was employed to develop a model for predicting 90-day mortality (AUROC of 0.80) (Supplementary Figure 1) and SHAP values were obtained to evaluate the influence of each biological feature on the outcome variable (Figure 1). Levels of SARS-CoV-2 N1 RNA was the parameter ranking the first to predict 90-day mortality, following by endothelin-1, IL-15, IL-8, neutrophils, IL-6, TREM-1, CCL2, CD27, SP-D, myeloperoxidase, IL-10, D-dimer, PTX-3, CXCL10, RNase P and VCAM-1, suggesting that viral control, endothelial dysregulation, pro-inflammatory mechanisms and chemotaxis are key biological functions in determining 90-day mortality in critical COVID-19 disease. On the contrary, high levels of the cytokine RANTES, anti-SARS-CoV-2 S IgM and anti-SARS-CoV-2 S IgG antibodies represented a protective factor against mortality.

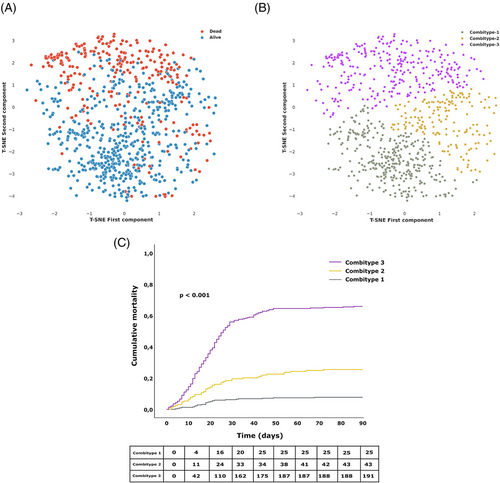
We further classified the patients into three groups or combitypes with different 90-day mortality rate, using a partitional clustering method based on the biological characteristics (Figure 2A, B). The Combitype-1 group was the most common (41.5%) and showed the lowest mortality rate at day 90 after ICU admission (7.7%), followed by the Combitype-2 group (21.5%) with a 90-day mortality rate of 25.4%. The 90-day mortality dramatically increased to 65.9% in the Combitype-3 group, who represented 36.9% of the cohort. Survival mean time in the first 90 days in each group was as follows [days (lower limit—upper limit)]: Combitype-1 [84.7 (82.7–86.8)], Combitype-2 [73.0 (68.5–77.6)] and Combitype-3 [44.2 (40.2–48.2)] (Figure 2C).

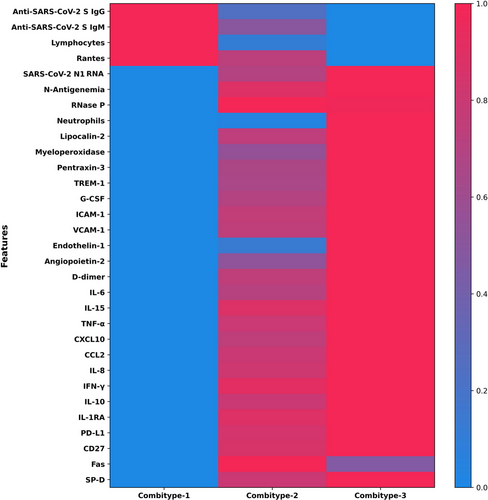
The three groups of 90-day mortality risk exhibited different biological characteristics (Figure 3 and Table S2). The Combitype-1 group had the lowest viral RNA load in plasma, the lowest prevalence of antigenemia, the highest concentration of anti-SARS-CoV-2 S IgG and IgM antibodies, and a homeostatic response to infection, with reduced levels of all pro-inflammatory cytokines and chemoattractant proteins tested (except RANTES). Thus, Combitype-1 could be considered a group of “elite” viral controllers within the population of patients admitted to the ICU.

In contrast, the Combitype-2 and -3 groups had a higher viral RNA load and higher prevalence of SASR-CoV-2 N antigen in plasma. The overall biomarker profile in the Combitype-2 and Combitype-3 groups indicated a broad dysregulation of the host response to infection, but with striking differences between these two groups. While the Combitype-2 had moderate viral RNA load along with intermediate levels of inflammatory and endothelial dysfunction biomarkers, the Combitype-3 showed the highest concentration in plasma of lipocalin-2, MPO, VCAM-1, PTX-3, IL-10, CXCL10, angiopoietin-2, IL-6, IL-15, endothelin-1, IL-8, and TREM-1, indicating an exacerbated pro-inflammatory profile coupled with higher endothelial dysregulation and very high viral RNA load in plasma.
These three immune signatures were linked to significant clinical differences (Table 1). Patients in the Combitype-1 group were younger and presented better respiratory function (PaO2/FiO2 ratio), and lower organ dysfunction (SOFA score) at ICU admission, together with lower frequency of hypertension, diabetes, chronic kidney disease, and chronic neurological disease as comorbidities. On the contrary, the Combitype-3 group had the highest prevalence of diabetes and immunosuppression. In terms of complications during hospital admission, the Combitype-1 group needed less often invasive mechanical ventilation and showed a lower frequency of secondary infections, acute kidney injury and septic shock, while the Combitype-3 group suffered more frequently acute liver failure, acute kidney injury, coagulation disorders and septic shock. As mentioned earlier, the Combitype-3 group was the one who presented the highest levels of viral RNA load and pro-inflammatory mediators. Taken together, these results point to the important role of uncontrolled viral replication in the development of multiorgan failure and the extremely high mortality rate observed in this group. In line with these results, a previous investigation has shown a novel mechanism for propagating inflammation, which involves SARS-CoV-2 fragments,9 which could underlie the extrapulmonary pathologies observed in critical COVID-19 patients, particularly in the Combitype-3 group, which exhibited a very high SARS-CoV-2 RNA load in plasma.
| Combitype-1 | Combitype-2 | Combitype-3 | p-value (1 vs. 2) | p-value (1 vs. 3) | p-value (2 vs. 3) | |
|---|---|---|---|---|---|---|
| No. (%) | 326 (41.5) | 169 (21.5) | 290 (36.9) | |||
| Age (years) | 61.0 [51.0–69.0] | 66.0 [58.0–73.0] | 68.5 [61.0–75.0] | <0.001 | <0.001 | 0.007 |
| Sex (female) | 105 (32.2) | 46 (27.2) | 90 (31.0) | 0.673 | 0.821 | 0.673 |
| Days since symptoms onset | 10.0 [8.0–13.0] | 10.0 [7.0–12.0] | 9.0 [7.0–13.0] | 0.037 | 0.037 | 0.767 |
| Epidemic period | ||||||
| 16 Mar. to 21 Jun., 2020 | 34 (10.4) | 10 (5.9) | 13 (4.5) | 0.237 | 0.020 | 0.746 |
| 22 Jun. to 6 Dec., 2020 | 200 (61.3) | 102 (60.4) | 173 (59.7) | |||
| 7 Dec. 2020 to 27 Feb. 2021 | 92 (28.2) | 57 (33.7) | 104 (35.9) | |||
| SOFA | 4.0 [3.0 - 6.0] | 5.5 [4.0 - 7.2] | 5.0 [4.0 - 8.0] | <0.001 | <0.001 | 0.940 |
| PaO2/FiO2 ratio | 119.1 [85.0 - 164.4] | 97.7 [76.7 - 136.0] | 100.0 [72.6 - 134.8] | 0.001 | 0.001 | 0.876 |
| Comorbidities | ||||||
| Hypertension | 145 (44.5) | 95 (56.2) | 177 (61.2) | 0.026 | <0.001 | 0.337 |
| Obesity | 132 (40.5) | 61 (36.1) | 84 (29.1) | 0.393 | 0.012 | 0.218 |
| Diabetes | 53 (16.3) | 45 (26.6) | 112 (38.6) | 0.012 | <0.001 | 0.012 |
| Chronic pulmonary disease | 32 (9.8) | 22 (13.0) | 47 (16.2) | 0.431 | 0.074 | 0.431 |
| Chronic cardiac disease | 35 (10.7) | 18 (10.7) | 47 (16.2) | >0.999 | 0.182 | 0.207 |
| Chronic kidney disease | 9 (2.8) | 14 (8.3) | 37 (12.8) | 0.006 | <0.001 | 0.138 |
| Chronic neurological disease | 13 (4.0) | 18 (10.7) | 27 (9.3) | 0.004 | 0.007 | 0.641 |
| Immunosuppression | 22 (6.7) | 10 (5.9) | 36 (12.4) | 0.721 | 0.016 | 0.025 |
| Treatments | ||||||
| Hydroxychloroquine | 36 (11.0) | 9 (5.3) | 11 (3.8) | 0.036 | 0.004 | 0.601 |
| Lopinavir/ritonavir | 28 (8.6) | 10 (5.9) | 21 (7.3) | 0.71 | 0.71 | 0.71 |
| Tocilizumab | 87 (26.7) | 35 (20.7) | 72 (25.0) | 0.528 | 0.701 | 0.528 |
| Remdesivir | 65 (19.9) | 32 (18.9) | 41 (14.2) | 0.883 | 0.236 | 0.350 |
| Complications | ||||||
| Invasive mechanical ventilation | 208 (64.0) | 155 (91.7) | 262 (90.3) | <0.001 | <0.001 | 0.746 |
| Hyperglycaemia | 226 (69.3) | 132 (78.6) | 245 (84.5) | 0.057 | <0.001 | 0.141 |
| Secondary infections | 136 (41.7) | 110 (66.7) | 176 (62.4) | <0.001 | <0.001 | 0.422 |
| Acute kidney injury | 56 (17.2) | 53 (31.4) | 150 (51.7) | <0.001 | <0.001 | <0.001 |
| Acute liver failure | 74 (22.7) | 41 (24.3) | 101 (34.8) | 0.781 | 0.004 | 0.036 |
| Coagulation disorders | 86 (26.4) | 42 (24.9) | 124 (42.8) | 0.713 | <0.001 | <0.001 |
| Septic shock | 23 (9.8) | 26 (22.4) | 110 (50.7) | 0.001 | <0.001 | <0.001 |
| Outcomes | ||||||
| UCI stay among survivors (days) | 9 (5.0–19.0) | 22 (11.0–36.0) | 22 (10.0–44.0) | <0.001 | <0.001 | 1.000 |
| Hospital stay since ICU admission among survivors (days) | 18 (12.0–35.0) | 33 (22.0–58.0) | 35 (24.0–59.0) | <0.001 | <0.001 | 1.000 |
| 90-day Mortality | 25 (7.7) | 43 (25.4) | 191 (65.9) | <0.001 | <0.001 | <0.001 |
- Statistics: Values are expressed as median (quartile 1 - quartile 3) for continuous variables and absolute count (percentage) for categorical variables. Kruskal–Wallis test with False Discovery Rate adjustment was used to compare continuous variables, and Pearson's Chi-square (𝛘2) or Fisher's exact tests were used to compare categorical variables. Significant differences (p-value < 0.05) are shown in bold. Immunosuppression was a composed variable obtained from the summation of hematologic comorbidity, active malignant neoplasia, HIV (human immunodeficiency virus) infection or AIDS (acquired immune deficiency), solid organ transplantation and bone marrow transplantation.
- Abbreviations: PaO2/FiO2, ratio of arterial oxygen partial pressure (PaO2 in mmHg) to fractional inspired oxygen (FiO2). Missing data were present for Days since symptoms onset (7), SOFA (15), PaO2/FiO2 ratio (103), Hypertension (1), Obesity (1), Chronic cardiac disease (1), Chronic kidney disease (1), Immunosuppression (1), Hydroxychloroquine (2), Lopinavir/ritonavir (2), Tocilizumab (2), Remdesivir (2), Invasive mechanical ventilation (1), Hyperglycaemia (1) and Septic shock (212).; p-value, level of significance; SOFA, Sequential Organ Failure Assessment.
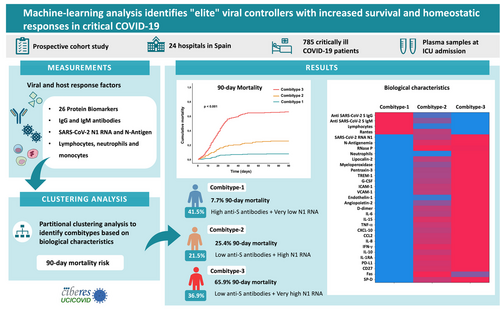
In conclusion, this is the first study combining SARS-CoV-2 RNA levels with host response data to develop a 90-day mortality prediction model by an XGBoost algorithm and employing SHAP values to evaluate the influence of each biological feature on the outcome variable. Our results showed that SARS-CoV-2 RNA load was the most important biological factor influencing 90-day mortality among COVID-19 patients admitted to the ICU and revealed that endothelin-1 and IL-15 had a higher influence on COVID-19 mortality than other pro-inflammatory cytokines, like IL-6. This prediction model confirmed our previous findings demonstrating that viral N1 RNA load was a predictor of 90-day mortality.4 However, the current clustering analysis considering 33 biological features on top to viral RNA load enabled better classification of patients with different severity (Figure 4), revealing the existence of the group showing a better prognosis within critically ill COVID-19 patients, the “elite” viral controllers. This group represented the largest group of our cohort and exhibited a robust antibody response that prevent uncontrolled viral replication and/or propagation, leading to more homeostatic immune responses to infection and increased survival. These results could help to understand the factors leading to survival not only in severe SARS-CoV-2 infection, but also in the infections caused by other emerging viruses.

AUTHOR CONTRIBUTIONS
JFBM, APT, SR and AT participated in protocol development, study design and management. JFBM and SR participated in the analysis and interpretation of data. AAM developed the machine learning and statistical analysis and drafted the figures. NGM participated in the coordination of the clinical study, analyzed the data and wrote the manuscript. AO and TP developed the dPCR works and profiled the biomarkers. DVS participated in statistical analysis. LT, PRM, EBM, EGC, AUI, MCT, AE, SCF, IMV, FPG, LS, JLM, PVC, VSM, MGR, NC, MCMD, LJV, CML, RNJG, EM, ALV, WT, JAB, RHM, JB, PE, AMdG, CR, GA, GR, JBM, RC, MSV, EBP, EG, FC, MRN, JMSC, YPM, MTGU, MTBV, AMR, LPB, LRC, NAM, JMG, MLB, JC, CB, JG, MTN, JNdO, EPS, LGG, JCR and JME recruited the patients and collected the clinical data. SR, IM, MMV, MJMG, VM, MV and OC performed the antibody assays. LSR performed the extraction of viral RNA. APT and AdF analyzed the viral load data. NJ participated in profiling the biomarkers. DJK, FB and DdGC participated in the study design. AM, AC, LFB and RA participated in the study design and coordination. All authors have critically revised the manuscript and approved the final version. All authors agree to be accountable in ensuring that questions related to the accuracy or integrity of any part of the work are appropriately investigated and resolved. All authors confirm that they had full access to all the data in the study, verify the underlying data reported and accept responsibility to submit for publication.
ACKNOWLEDGEMENTS
This work was supported by awards from the Instituto de Salud Carlos III: FONDO—COVID19, COV20/00110, CIBERES, 06/06/0028 (AT), CIBERES, 22/06/00035, Proyectos de Investigación en Salud, PI22/00968 (JFBM), Miguel Servet, CP20/00041 (DdG), Sara Borrell, CD018/0123 (APT) and PFIS, FI20/00278 (AdF). We also received funds from Programa de Donaciones “Estar Preparados”, UNESPA (Madrid, Spain) and from the Canadian Institutes of Health Research (CIHR OV2 - 170357 (DJK/JFBM), Research Nova Scotia, Li-Ka Shing Foundation (DJK) and finally by a Research Grant 2020 from ESCMID (APT). COV20/00110, PI22/00968, CP20/00041, FI20/00278 were co-funded by European Regional Development Fund and European Social Fund (“A way to make Europe”, “Investing in your future”). We are indebted to the Fundació Glória Soler for its contribution and support to the COVIDBANK of HCB-IDIBAPS Biobank. The funding sources did not play any role in any aspect pertinent to the study, including writing of the manuscript and the decision to submit it for publication. This work was not supported by any pharmaceutical company or other agency.
CONFLICT OF INTEREST STATEMENT
JFBM, AT, FB, RA, JME and APT have a patent application on SARS-CoV-2 antigenemia as a predictor of mortality in COVID-19.
The remaining authors declare no conflicts of interest.
ETHICAL APPROVAL
This is a sub-study of the CIBERESUCICOVID study (NCT04457505), which received approval from the Institution's Internal Review Board (Comité Ètic d'Investigació Clínica, registry number HCB/2020/0370). Participant hospitals obtained the approval of the respective local ethics committee. The study was performed in full compliance with the Declaration of Helsinki and national and international law on data protection. Informed consent was obtained from each patient or legal representative.
Open Research
DATA AVAILABILITY STATEMENT
The data that support the findings of this study are available from the corresponding author upon reasonable request.


