Characteristics of PD-1+CD4+ T cells in peripheral blood and synovium of rheumatoid arthritis patients
Abstract
Objectives
PD-1 plays a crucial role in the immune dysregulation of rheumatoid arthritis (RA), but the specific characteristics of PD-1+CD4+ T cells remain unclear and require further investigation.
Methods
Circulating PD-1+CD4+ T cells from RA patients were analysed using flow cytometry. Plasma levels of soluble PD-1 (sPD-1) were measured using enzyme-linked immunosorbent assay (ELISA). Single-cell RNA sequence data from peripheral blood mononuclear cells (PBMCs) and synovial tissue of patients were obtained from the GEO and the ImmPort databases. Bioinformatics analyses were performed in the R studio to characterise PD-1+CD4+ T cells. Expression of CCR7, KLF2 and IL32 in PD-1+CD4+ T cells was validated by flow cytometry.
Results
RA patients showed an elevated proportion of PD-1+CD4+ T cells in peripheral blood, along with increased plasma sPD-1 levels, which positively correlated with TNF-α and erythrocyte sedimentation rate. Bioinformatic analysis revealed PD-1 expression on CCR7+CD4+ T cells in PBMCs, and on both CCR7+CD4+ T cells and CXCL13+CD4+ T cells in RA synovium. PD-1 was co-expressed with CCR7, KLF2, and IL32 in peripheral CD4+ T cells. In synovium, PD-1+CCR7+CD4+ T cells had higher expression of TNF and LCP2, while PD-1+CXCL13+CD4+ T cells showed elevated levels of ARID5A and DUSP2. PD-1+CD4+ T cells in synovium also appeared to interact with B cells and fibroblasts through BTLA and TNFSF signalling pathways.
Conclusion
This study highlights the increased proportion of PD-1+CD4+ T cells and elevated sPD-1 levels in RA. The transcriptomic profiles and signalling networks of PD-1+CD4+ T cells offer new insights into their role in RA pathogenesis.
Introduction
Rheumatoid arthritis (RA) is a chronic autoimmune disorder characterised by synovial proliferation of fibroblasts and leukocytes infiltration, affecting approximately 0.5% of the global population.1, 2 Its pathogenesis involves dysregulated immune responses that perpetuate inflammation.3 Activated immune cells release autoantibodies and inflammatory cytokines, such as tumor necrosis factor-α (TNF-α), further intensifying synovial inflammation.4 Peripheral CD4+ T cells are thought to be recruited and activated within the inflamed synovium.5 In collagen-induced arthritis mouse models, the conditional knockout of CD4+ T cells significantly reduces inflammation, underscoring their critical role in immune regulation in RA.5-7
Programmed death 1 (PD-1), encoded by PDCD1 or PD-1 gene, regulates immune suppression by interacting with its ligand, PD-L1.8 PD-1 is primarily expressed on T cells, where its activation recruits phosphatases that inhibit tyrosine phosphorylation, leading to T cell supression.8 While PD-1 inhibitors restore T cell antitumor activity in cancer patients, PD-1 agonists enhance immunosuppression and have been proposed for treating autoimmune diseases by modulating excessive immune responses.9, 10 PD-1 deficiency in collagen-induced arthritis models results in more severe inflammation, whereas PD-L1 immunoglobulin therapy has been shown to reduce joint inflammation.11 These findings highlight PD-1's role in maintaining immune tolerance in RA.12
Recent studies have identified PD-1+CD4+ T cells as key mediators in RA. Peripheral helper T cells (TPH), marked by a PD-1highCXCR5−CD4+ T cells phenotype, promote pathogenic B cells activity within the inflamed synovium.13, 14 Some studies have linked elevated PD-1 expression on CD4+ T cells with increased RA disease activity,15, 16 while others have reported reduced PD-1 expression in RA, showing an inverse correlation with disease severity.5, 17 Thus, further research is required to clarify PD-1 expression and the role of PD-1+CD4+ T cells in RA.
This study utilised flow cytometry to assess PD-1 expression on CD4+ T cells in RA. In addition, single-cell RNA sequencing (scRNA-seq) data and bioinformatics analyses were employed to explore the heterogeneity and characteristics of PD-1+CD4+ T cells, offering novel insights into RA pathogenesis.18
Results
PD-1 expression on CD4+ T cells in the peripheral blood of RA patients
This study included 47 RA patients and 12 age- and gender-matched healthy controls (HC). Demographical and clinical data are summarised in Supplementary table 1. PD-1 expression on CD4+ T cells was assessed via flow cytometry, with the gating strategy depicted in Figure 1a. The proportion of CD4+ T cells did not differ significantly between RA patients and HCs (Figure 1b). However, the frequency of PD-1+CD4+ T cell was markedly higher in RA patients (Figure 1c and d).
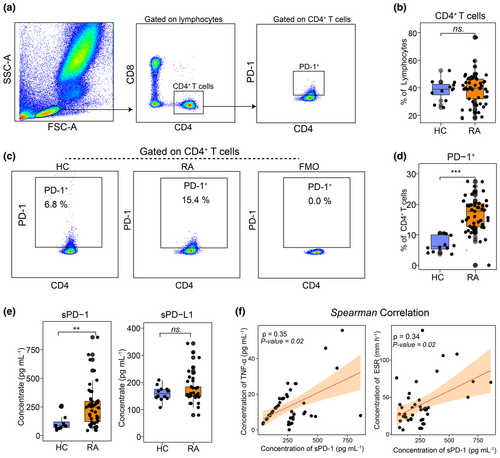
Plasma concentrations of soluble PD-1 (sPD-1) and soluble PD-L1 (sPD-L1) were measured using enzyme-linked immunosorbent assay (ELISA). RA patients exhibited significantly higher sPD-1 levels compared to HCs, while sPD-L1 levels showed no significant difference between groups (Figure 1e). To explore the clinical significance of PD-1, we examined correlations between sPD-1 and RA activity markers, including erythrocyte sedimentation rate (ESR) and TNF-α, both recognised indicators of disease severity.19 As shown in Figure 1f, sPD-1 levels correlated positively with TNF-α and ESR, indicating that sPD-1 may serve as a biomarker for RA disease activity.
Transcriptomic profiles of PD-1+CD4+ T cells in the PBMCs of RA patients
To characterise peripheral PD-1+CD4+ T cells, we performed integrated analysis on two scRNA-seq datasets (GSE159117, GSE208161)20, 21 from five RA cases. A total of 24 123 T cells, identified as PTPRC+CD3E+ at the transcriptome level, were obtained to subsequent analysis. Unsupervised clustering analysis divided these T cells into 10 subtypes, including CCR7++CD4+ T cells, CCR7+CD4+ T cells, FOXP3+CD4+ T cells, CCR7+CD8+ T cells, GZMK+CD8+ T cells, NKG7+CD8+ T cells, HAVCR2+ T cells, MT-CO2+ T cells, TUBB+ T cells and KLRC2+ T cells (Figure 2a). The expression patterns of canonical markers enabled precise annotation of these subtypes (Figure 2a and b).20, 22 We identified two distinct CD4+ T cell subtypes based on CCR7 expression levels. CCR7, which is predominantly expressed on naive T cells and central memory T cells,23 is crucial for regulating memory T cell migration, lymphocyte activation and dendritic cell maturation.24 These results advance our understanding of T cell subtypes in RA.
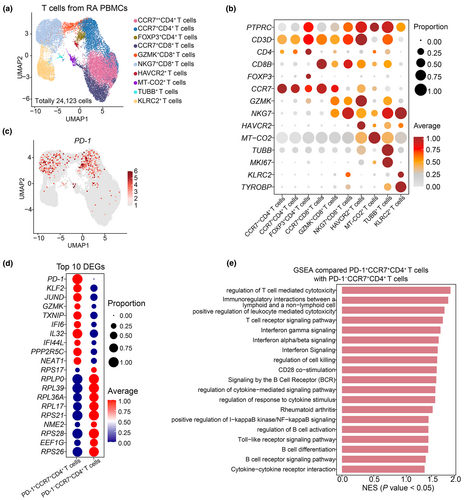
Our bioinformatic analysis detected PD-1 expression on both CCR7+CD4+ T cells and NKG7+CD8+ T cells (Figure 2a and c). The NKG7+CD8+ T cells, known for their cytotoxic functions,22 may use PD-1 to modulate immune response in a compensatory way for RA patients. Differentially expressed genes (DEGs) analysis revealed that PD-1+CCR7+CD4+ T cells exhibited high levels of KLF2 and IL32 compared to PD-1−CCR7+CD4+ T cells (Figure 2d, Supplementary table 2). KLF2, a transcription factors from the Kruppel family, plays a role in B cell immune response.25 IL32, a pro-inflammatory cytokine, induces the release of TNF-α, interleukin-6 (IL-6), interleukin-1β (IL-1β) and interleukin-8 (IL-8).26 Gene set enrichment analysis (GSEA) further demonstrated activation of type I interferon production and upregulation of interferon-β production signalling pathways in PD-1+CCR7+CD4+ T cells (Figure 2e). These results suggest that PD-1+CCR7+CD4+ T cells contribute to immune effector functions in RA patients.
CCR7, KLF2 and IL32 expression in peripheral PD-1+CD4+ T cells in RA patients
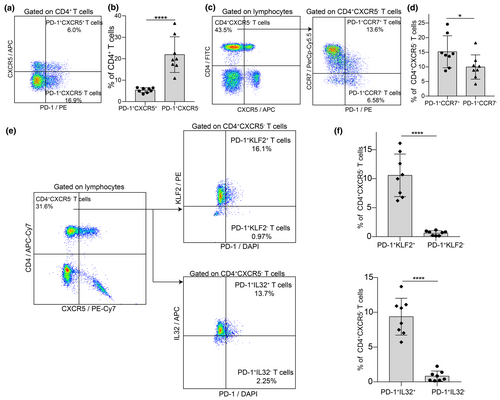
We analysed the expression of CCR7, KLF2 and IL32 in circulating PD-1+CD4+ T cells using flow cytometry on peripheral blood samples from eight RA patients. Patient demographics are summarised in Supplementary table 3. Among the CD4+ T cells, 17.38% were PD-1+CCR7+, while 7.25% were PD-1+CCR7− (Figure 3a and b). This indicates that CCR7+PD-1+CD4+ T cells are twice as common as CCR7−PD-1+CD4+ T cells. Additionally, 11.09% of CD4+ T cells were PD-1+KLF2+, a significantly higher proportion compared to 0.71% of PD-1+KLF2− cells. Similarly, 10.61% of CD4+ T cells were PD-1+IL32+, while only 0.87% were PD-1+IL32− (Figure 3c and d). These results demonstrate the co-expression of PD-1 with CCR7, KLF2 and IL32 in peripheral CD4+ T cells of RA patients.

Previous studies have identified two distinct CD4+PD-1+ T cell subtypes: follicular helper T cells (TFH) marked by PD-1+CXCR5+CD4+ T cells, and TPH marked by PD-1+CXCR5−CD4+ T cells, which play roles in B cells activation and differentiation in RA and allergic diseases.27-29 In our study, PD-1+CXCR5− TPH cells comprised 21.91% of CD4+ T cells, whereas PD-1+CXCR5+ TFH cells accounted for 5.34% (Figure 4a and b). This suggests that PD-1+CXCR5−CD4+ TPH cells are approximately four times more prevalent than PD-1+CXCR5+CD4+ TFH cells in the peripheral blood of RA patients. Within the CD4+CXCR5− T cell subset, 15.17% were PD-1+CCR7+ (Figure 4c and d). Moreover, PD-1+KLF2+ cells made up 10.58%, and PD-1+IL32+ cells constituted 9.37% of CD4+CXCR5− T cells (Figure 4e and f). These results indicate that TPH cells are significantly more frequent than TFH cells in RA patients and that most TPH cells express CCR7, KLF2 and IL32.
PD-1 expression in T cell subtypes in the synovium of RA patients
The scRNA-seq dataset from the ImmPort database (access No. SDY998) classifies cells from synovium of RA patients into fibroblasts, T cells, B cells and monocytes (Figure 5a).30 This dataset provides a valuable resource to explore the characteristics of synovial PD-1+CD4+ T cells. The expression patterns of canonical cell markers enabled the identification of these cell subtypes (Figure 5b).30-32 Fibroblasts (Fib) were further categorised into CD34+ Fib, DDK3+ Fib, CD55+ Fib and HLA-DRA+ Fib (Figure 5a). Monocytes (Mon) were subdivided into IL1B+ Mon, IGHG4+ Mon and NUPR1+ Mon (Figure 5a), while B cells were classified into MS4A1+ B cells, ITGAX+ B cells and CD83+ B cells (Figure 5a).
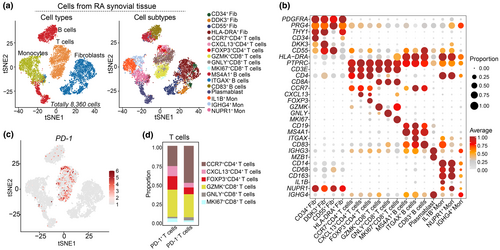
The previous study had revealed T cell subtypes in synovial tissues, including CCR7+ T cells, GZMK+ T cells and so on.30 Based on specific markers expression, we re-analysed and classified these cells into six subpopulations, including CCR7+CD4+ T cells, CXCL13+CD4+ T cells, FOXP3+CD4+ T cells, GZMK+CD8+ T cells, GNLY+CD8+ T cells and MKI67+CD8+ T cells (Figure 5a and b). PD-1 was predominantly expressed in CCR7+CD4+ T cells, CXCL13+CD4+ T cells and GZMK+CD8+ T cells (Figure 5c and d). Specifically, PD-1+ T cells constituted 26.67% of CCR7+CD4+ T cells and 13.33% of CXCL13+CD4+ T cells (Figure 5d). These results indicate significant heterogeneity among PD-1+CD4+ T cells in the synovium.
Transcriptomic profiles of PD-1+CCR7+CD4+ T cells in the synovium of RA patients
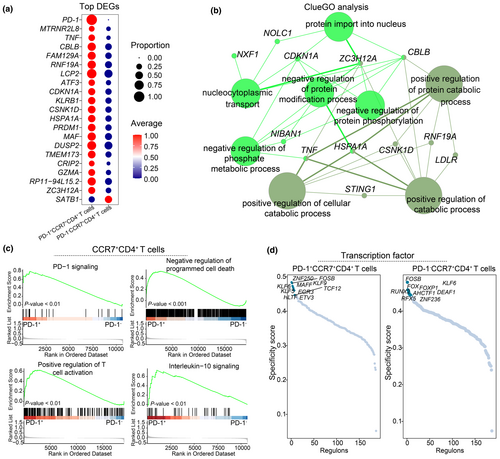
To characterise synovial PD-1+CD4+ T cells, we identified DEGs by comparing PD-1+CCR7+CD4+ T cells with PD-1−CCR7+CD4+ T cells. PD-1+CCR7+CD4+ T cells exhibited elevated levels of TNF, LCP2 and DUSP2 (Figure 6a, Supplementary table 4). ClueGO analysis revealed that the upregulated DEGs in PD-1+CCR7+CD4+ T cells were involved in pathways related to the positive regulation of protein catabolism, cellular catabolism, and negative regulation of protein phosphorylation (Figure 6b). GSEA further indicated that PD-1+CCR7+CD4+ T cells were activated in pathways associated with PD-1 signalling, negative regulation of programmed cell death, positive regulation of T cell activation and interleukin-10 signalling (Figure 6c, Supplementary figure 1a). Additionally, regulons for the cell types were identified using SCENIC package,33, 34 revealing high expression of transcription factors such as EGR3, KLF5, TCF12 in PD-1+CCR7+CD4+ T cells (Figure 6d). These transcription factors may provide valuable targets for further experimental studies.
Transcriptomic profiles of PD-1+CXCL13+CD4+ T cells in the synovium of RA patients
To further investigate synovial PD-1+CXCL13+CD4+ T cells, we analysed their gene expression profiles in comparison to PD-1−CXCL13+CD4+ T cells. PD-1+CXCL13+CD4+ T cells showed significantly higher expression levels of ARID5A, DUSP2 and other genes (Figure 7a, Supplementary table 5). ClueGO analysis revealed that upregulated DEGs in these cells were associated with the pathways related to T cell activation, IL-10 production regulation, TNF superfamily cytokine production and IL-6 production (Figure 7b). This suggests a potential role for PD-1+CXCL13+CD4+ T cells in inflammatory cytokine secretion within the RA synovium.
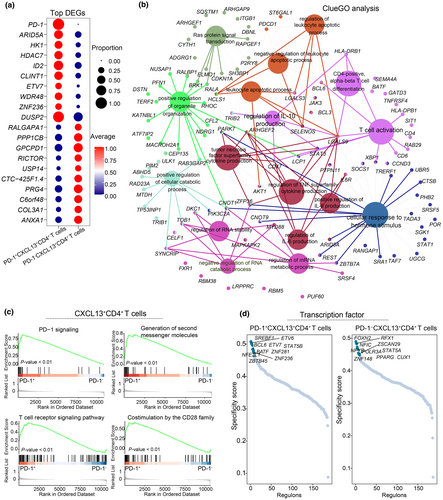
Gene set enrichment analysis results highlighted that PD-1+CXCL13+CD4+ T cells were involved in the PD-1 signalling pathway, second messenger generation, T cell receptor signalling and CD28 family co-stimulation signalling (Figure 7c, Supplementary figure 1b). SCENIC analysis identified specific transcription factors, including BCL6 and BATF in PD-1+CXCL13+CD4+ T cells, while FOXN2 and PPARG were expressed in PD-1−CXCL13+CD4+ T cells (Figure 7d). These differential transcription factors may contribute to the distinct immune functions observed between PD-1−CXCL13+CD4+ T cells and PD-1+CCR7+CD4+ T cells.
Analysis of cell–cell communication between PD-1+CD4+ T cells and other cells in RA synovium
We used the CellChat algorithm to explore the cell–cell communication networks in the RA synovial microenvironment (Supplementary figure 2). The CellChat analysis demonstrates that the BTLA-TNFRSF14 ligand-receptor pair is pivotal for interactions between PD-1+CXCL13+CD4+ T cells and ITGAX+ B cells, impacting BTLA signalling pathways (Figure 8a). BTLA expression is notably high in PD-1+CXCL13+CD4+ T cells (Figure 8c), consistent with previous findings that BTLA is upregulated in effector CD4+ T cells and can drive autoreactivity in lupus patients.35 The TNFRSF12-TNFRSF12A pair facilitates communication between PD-1+CCR7+CD4+ T cells and DDK3+ fibroblasts (Figure 8a). Additionally, PD-1+CCR7+CD4+ T cells amplify TGFB1 signalling pathways, with TGFB1-TGFBR1 and TGFB1-TGFBR2 serving as key mediators (Figure 8a).
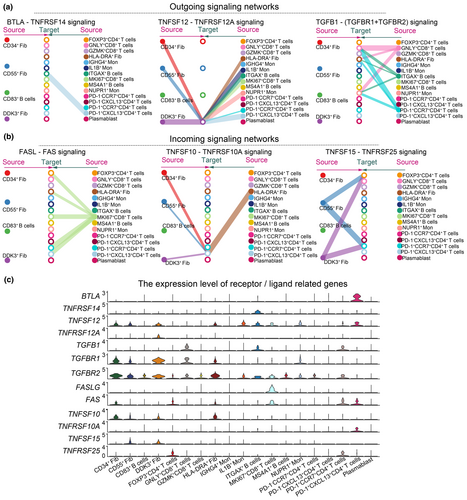
Both PD-1+CCR7+CD4+ T cells and PD-1+CXCL13+CD4+ T cells receive signals from MKI67+CD8+ T cells via the FAS-FASLG pair (Figure 8b). PD-1+CXCL13+CD4+ T cells also receive signals from HLA-DRA+, CD34+, CD55+ and DDK3+ fibroblasts through the TNFSF10-TNFRSF10A pair, and from CD55+ and DDK3+ fibroblasts via the TNFSF15-TNFRSF25 pair (Figure 8b). In summary, CellChat analysis suggests that PD-1+CD4+ T cells interact with B cells and synovial fibroblasts through BTLA and TNFSF signalling pathways.
Discussion
The PD-1 signalling pathway plays a critical role in autoimmune diseases, including RA.12 A phase 2 trial of Peresolimab, a PD-1 agonist, demonstrated its therapeutic potential in RA patients,10 highlighting PD-1 activation as a promising treatment strategy. In this study, we found an increased percentage of PD-1+CD4+ T cells in the peripheral blood of RA patients. Additionally, elevated plasma levels of sPD-1 were positively correlated with both ESR and TNF-α, indicating that sPD-1 may serve as a biomarker for RA disease activity.
In allergic diseases, circulating TFH cells, marked by low CCR7 and high PD-1 expression, have been shown to enhance IgG production in memory B cells.28 In RA patients, we confirmed PD-1 co-expressed with CCR7, KLF2 and IL32 in circulating TPH cells. CCR7 directs T cell homing and positioning, contributing to adaptive immune responses.36 KLF2 regulates lineage-specific transcription factors and influences CD4+ T cells localisation,37 while IL32 stimulates the production of inflammatory cytokines, such as TNF-α, IL-8, IL-6 and IL-1β.38 Furthermore, type I interferon and interferon-β production pathways were activated in PD-1+CCR7+CD4+ T cells, suggesting their immune effector role in RA.
Matsuda et al. reported PD-1 expression in synovial lymphocytes in 66.7% of RA cases, as assessed by immunohistochemistry.39 Our study extended these findings by identifying PD-1 expression on both CCR7+CD4+ T cells and CXCL13+CD4+ T cells in RA synovial tissue. PD-1+CCR7+CD4+ T cells exhibited higher levels of TNF, LCP2 and DUSP2 than their PD-1− counterparts. TNF is a central therapeutic target in RA and other autoimmune diseases,40 while LCP2 mediates signals from the CD28/B7 family, regulating T cell receptor signalling pahways.41 DUSP2, part of the dual-specificity phosphatase family, plays a role in cell proliferation and differentiation.42 Both PD-1+CXCL13+CD4+ T cells and PD-1+CCR7+CD4+ T cells were linked to the pathways involved in T cell activation and cytokine production. Overall, these findings suggest that PD-1+CD4+ T cells in RA synovium are highly heterogeneous and contribute to complex immune regulatory mechanisms in RA.
Plasma levels of sPD-1 were elevated in RA patients. In vitro studies demonstrated that sPD-1 could inhibit the PD-1/PD-L1 interaction.43 In a collagen-induced arthritis mouse model, sPD-1 blocked PD-1 on T cell membranes, exacerbating inflammation via the Th1 and Th17 pathways.44 However, plasma levels of sPD-L1 did not increase in RA patients, indicating possible insufficiency in PD-1 signalling. This suggests potential dysfunction of the PD-1/PD-L1 signalling axis in RA.
In RA synovium, TPH cells enhance the differentiation of memory B cells into immunoglobulin-producing cells.45 Our analysis revealed enrichment of BTLA and TNFSF signalling pathway among PD-1+CD4+ T cells, ITGAX+ B cells and synovial fibroblasts. These pathways are mediated by ligand-receptor pairs such as BTLA-TNFRSF14, TNFSF10-TNFRSF10A and TNFSF15-TNFRSF25, highlighting critical intercellular communication networks in the RA synovial microenvironment.
SCENIC analysis identified distinct transcriptional regulators in PD-1+CCR7+CD4+ T cells (e.g. EGR3, KLF) and PD-1+CXCL13+CD4+ T cells (e.g. BCL6, BATF) from RA synovium. EGR3 is involved in T cell development and differentiation,46 while KLF5 regulates T cell development, metabolism and pluripotency.47 BCL6 drives CD4+ T cells differentiation into TFH cells,48 and BATF, part of the activator protein-1 family, enhance immune response in T cells and B cells.49 These transcription factors offer insight into the regulatory mechanisms of PD-1+CD4+ T cells in RA.
This study has limitations. Only 12 cases were included because of challenges in obtaining peripheral blood from healthy individuals. Moreover, the treatment history and clinical characteristics of patients in the scRNA-seq datasets were not fully available. Further investigation is needed to examine the molecular features of PD-1+CD4+ T cells under different treatment regimens and stages of disease activity. In conclusion, this study characterises PD-1 expression and the functional role of PD-1+CD4+ T cells in RA, providing a basis for the development of PD-1 agonist therapies.
Methods
RA patients and healthy volunteers
Patients with RA were enrolled from the Shenzhen People's Hospital, while HC were recruited from colleagues at the same institution. Approval for the study was granted by the Institutional Review Board of Shenzhen People's Hospital (Approval No. LL-KY-2019504). Informed consent was secured from all participants for the use of their blood samples. It was confirmed that HC volunteers did not have autoimmune diseases. RA diagnoses were established according to the 2010 European League Against Rheumatism (EULAR) and American College of Rheumatology (ACR) criteria.50 The exclusion criteria comprised acute active infections, acquired immune deficiency syndrome, tuberculosis, hepatitis B virus, malignant tumors, liver and kidney failure and neuropsychiatric disorders.
Collections of clinical parameters and assessment for disease activity
Clinical information was recorded, including age, height, body weight, erythrocyte sedimentation rate (ESR), C-reactive protein (CRP), rheumatoid factor (RF) and anti-cyclic citrullinated peptide (anti-CCP), tender joint counts (TJC) and swollen joint counts (SJC). Patient global assessment of disease activity (PtGA) were assessed based on above clinical characteristics. The scores of DAS28-ESR and DAS28-CRP were used to assess disease activity and calculated by the following formulas51, 52: DAS28-ESR = 0.56 × SQRT (TJC28) + 0.28 × SQRT (SJC28) + 0.70 × ln (ESR) + 0.014 × (PtGA); DAS28-CRP = 0.56 × SQRT (TJC28) + 0.28 × SQRT (SJC28) + 0.36 × ln (CRP + 1) + 0.014 × (PtGA) + 0.96. RA patients were assigned into four groups according to the following thresholds: remission (DAS28 < 2.6), low (DAS28 < 2.6 to 3.2), moderate (DAS28 > 3.2 to 5.1) and high (DAS28 > 5.1). Demographical and clinical data are summarised in the Supplementary Information.
Blood samples collection and flow cytometry analysis
Fresh peripheral blood samples were collected in EDTA-K2 anticoagulant tubes, and disposed within 2 h in a 4°C refrigerator. Blood samples were stained for 15 min at 25°C using the following antibodies: anti-CD4 (BD Biosciences, San Diego, USA), anti-CD8 (BD Biosciences), anti-CD25 (BD Biosciences), anti-CD127 (BD Biosciences), anti-PD-1 (BD Biosciences), anti-CCR7 (BD Biosciences), anti-CXCR5 (R&D Systems, Minnesota, USA), anti-KLF2 (R&D Systems), anti-IL32 (BD Biosciences). After incubation with these antibodies, red blood cells were lysed with lysing buffer (BD Biosciences) for 10 min. The cells were further fixed and permeabilised for 30 min using a Fixation/Permeabilisation Solution Kit (BD Biosciences). Subsequently, the cells were stained with intracellular and intranuclear antibodies for 30 min. Cell fluorescence was acquired on a BD Aria II flow cytometry equipment (BD Biosciences). Lastly, the data of flow cytometry was analysed using the FlowJo software (version 10.8.1).
Measurement of sPD-1, sPD-L1 and TNF-α concentration by ELISA
The plasma samples from RA patients were collected and stored in a −80°C refrigerator. Human PD-1 ELISA kit (Novus, Colorado, USA), PD-L1 ELISA kit (Novus) and TNF-α ELISA kits (Dakewe Biotech, Shenzhen, China) were used to measure the concentration of sPD-1, sPD-L1 and TNF-α. ELISA was performed at a wavelength of 450 nm according to the manufacturer instructions.
Single-cell transcriptome datasets and bioinformatics analysis
Single-cell RNA-seq datasets from the PBMCs and synovial tissue in RA patients were downloaded from the ImmPort (https://www.immport.org/shared/study/SDY998, accession code SDY998)30 and the GEO databases (https://www.ncbi.nlm.nih.gov, accession no. GSE159117, GSE208161).20, 21
Seurat package (version 4.0.2, https://satijalab.org/seurat/)53 in R studio was used to identify highly variable genes. Principal component analysis (PCA) and UMAP visualisation analysis were performed using 2000 highly variable genes. For the GSE159117 and GSE208161 datasets, the top 15 principal components were selected for unsupervised clustering using FindClusters with the parameters (resolution equal to 1.0). For the SDY998 dataset,30 the top 20 principal components were selected for unsupervised clustering using FindClusters with the parameters (resolution equal to 1.2). The UMAP plots were used for dimension reduction and visualisation of cell subtypes and gene expression.
Those cells with PD-1 expression greater than zero were deemed PD-1+ and those with expression less than or equal to zero were deemed PD-1−. DEGs were identified using the FindMarkers function in the Seurat package. The DEGs with a P-value < 0.05 were considered statistically significant.
Functional enrichment analysis
Functional enrichment analysis of whole gene expression features were conducted on GSEA software (http://www.gsea-msigdb.org/gsea/index.jsp).54 Reference gene sets related to signalling pathways were downloaded from the GSEA database (https://data.broadinstitute.org/gsea-msigdb/msigdb/release/7.4/). The protein–protein interaction and signalling pathways network of the upregulated DEGs in PD-1+ T cells were performed using ClueGO and CluePedia plugins of Cytoscape software.55-57
Transcription factors analysis
The regulon analysis was performed via SCENIC package, according to the motifs database for RcisTarget and GRNboost.33, 34, 58 To improve the scalability or robustness, we randomly selected a certain number of cells, according to the minimum number of cell subpopulations.59 To quantify the cell-type specificity of a regulon, we evaluated the Jensen-Shannon Divergence (JSD) to identify unique transcription factors.59
Cell–cell communication analysis
The CellChat package was employed to identify related ligand–receptor pairs from scRNA-seq data.60 Ligand–receptor pairs with a P-value < 0.05 were considered to be significant interacting molecules among different cell subtypes. The most unique signalling pathways in PD-1+CD4+ T cells were selected for further visualisation.
Statistical analysis
R studio (version 4.0.0) was used for statistical analysis. Visualisation of graphs was conducted using the ggplot2 package in R studio. The correlation analysis between the two datasets was performed using Spearman correlation analysis. The two-sided unpaired Wilcoxon test was applied for quantitative data with non-normal distributions. A P-value < 0.05 was considered to be statistically significant.
Acknowledgments
We thank the participants in this study and the staff members in the Rheumatology Department of Shenzhen People's Hospital, Shenzhen, China. The study was supported by the Sanming Project of Medicine in Shenzhen (Grant number: SZSM202111006), the Shenzhen Key Medical Discipline Construction Fund (Grant number: SZXK011) and the National Natural Science Foundation of China (Grant number: 82302030).
Author contributions
Yan-juan Chen: Conceptualization; data curation; formal analysis; funding acquisition; investigation; methodology; project administration; resources; validation; visualization; writing – original draft; writing – review and editing. Yong Chen: Investigation; methodology; resources; software; visualization; writing – review and editing. Ping Chen: Methodology; resources. Yi-qun Jia: Writing – review and editing. Hua Wang: Funding acquisition; supervision; writing – review and editing. Xiao-ping Hong: Funding acquisition; supervision; writing – review and editing.
Conflict of interest
The authors declare no conflict of interest.
Ethics approval
The study design was approved by the Institutional Review Boards of the Shenzhen People's Hospital (No. LL-KY-2019504). Informed consent was secured from all participants for the use of their blood samples.
Open Research
Data availability statement
Data are available upon reasonable request. All data relevant to the study are either included in the article or uploaded as Supplementary Information.


