Categorisation of patients based on immune profiles: a new approach to identifying candidates for response to checkpoint inhibitors
Abstract
Objectives
Inhibitors to the checkpoint proteins cytotoxic T-lymphocyte-associated protein 4 (CTLA-4) and programmed cell death protein 1 (PD-1) are becoming widely used in cancer treatment. However, a lack of understanding of the patient response to treatment limits accurate identification of potential responders to immunotherapy.
Methods
In this study, we assessed the expression of PD-1 and CTLA-4 on 19 leucocyte populations in the peripheral blood of 74 cancer patients. A reference data set for PD-1 and CTLA-4 was established for 40 healthy volunteers to determine the normal expression patterns for these checkpoint proteins.
Results
Unsupervised hierarchical clustering found four immune profiles shared across the solid tumor types, while chronic lymphocytic leukaemia patients had an immune profile largely unique to them. Furthermore, we measured these leucocyte populations on an additional cohort of 16 cancer patients receiving the PD-1 inhibitor pembrolizumab in order to identify differences between responders and non-responders, as well as compared to healthy volunteers (n = 20). We observed that cancer patients had pre-treatment PD-1 and CTLA-4 expression on their leucocyte populations at different levels compared to healthy volunteers and identified two leucocyte populations positive for CTLA-4 that had not been previously described. We found higher levels of PD-1+ CD3+ CD4− CD8− cells in patients with progressive disease and have identified it as a potential biomarker of response, as well as identifying other significant differences in phenotypes between responders and non-responders.
Conclusion
These results are suggestive that categorisation of patients based on immune profiles may differentiate responders from non-responders to immunotherapy for solid tumors.
Introduction
Over the past decade, checkpoint inhibitors have been developed to target the immune system for improved treatment of multiple cancer types. This trajectory is apt to continue, with the success of recent clinical trials showing the effectiveness of checkpoint inhibitors. Inhibitors such as ipilimumab, nivolumab and pembrolizumab have been approved for the treatment of late-stage cancers, including lung cancer, bladder cancer, lymphoma and melanoma.1 The mechanism by which checkpoint inhibitors regulate and restore immune function and modulation is believed to be through activation and regulation of T cells.2 Clinical trials of these inhibitors have yielded a wide range of response rates. In a study of programmed cell death protein 1 (PD-1) inhibitors in Hodgkin's lymphoma, the response rate was 87%,3 while similar studies found the response rates of 18% in non-small cell lung cancer, 28% in melanoma and 27% in renal cell cancer.4 Anti-cytotoxic T-lymphocyte-associated protein 4 (CTLA-4) drugs such as ipilimumab target CTLA-4, blocking interaction with costimulatory molecules such as CD80 and CD86 on the antigen-presenting cell while allowing upregulation and T-cell activation.5 The anti-PD-1 drugs nivolumab and pembrolizumab inhibit the PD-1 protein on T cells from binding to its ligand PD-L1 on tumor or tumor-infiltrating immune cells, a process that normally results in deactivation of T cells.6 Mainly, the effects of checkpoint proteins have been studied on T cells, but their influence on other immune cell populations is less well known.
The therapeutic results with these powerful immunomodulators have been impressive but have been tempered by the lack of effect for some patients. Critically, the tumor itself can take an active role by negatively affecting immune function through checkpoint proteins by upregulation of PD-L1 on tumors7 and of checkpoint proteins on tumor-induced lymphocytes.2 The understanding of the mechanism of action in the immune system has largely been derived from mouse models8 or with in vitro controlled immune assays.7 The immune system often has both positive and negative feedback loops that may counter the antibody effects. Furthermore, it has been shown that anti-PD-1 and anti-CTLA-4 drugs specifically target subsets of CD8+ T cells in tumors, operating through distinct rather than broad mechanisms.9 Therefore, a complete understanding of all potential targets of these antibodies in patients may help illustrate the mechanisms and is a first step to a more directed use (through individualised medicine). Likewise, no method is available for identifying responders and non-responders to these inhibitors or identifying patients at risk of immune-related adverse events. The development of tools to address these issues would facilitate the optimal timing and dosing of therapies and prevent unneeded and costly treatment. Flow cytometry is the most direct method for measuring the immune system of cancer patients.
Clinical flow cytometry can be quantitative, precise and highly useful in diagnostics and prognostics. We have previously combined quantitative flow cytometry with informatics to identify novel myeloid populations,10 as well as identify patients grouped by the presence or absence of correlative phenotypes to identify the survival of cancer patients11 or survival in the neurodegenerative disease amyotrophic lateral sclerosis (ALS).12 We used this established approach to quantify the diversity and level of white blood cells expressing PD-1 and CTLA-4. In addition, we have screened neoplasms of different origins to determine in an unbiased manner whether the profile of the antibody targets in the immune system is tumor-dependent. Our findings support the use of patients' specific immune profiles to improve the selection of patients who may respond to checkpoint inhibitors regardless of tumor histology.
Results
Confirmation of CTLA-4 and PD-1 phenotypes and gating strategies
Our strategy is based on quantitative unbiased assessment of the immune system. Our approach used 10-colour multi-tube quantitative flow cytometry on whole blood.11 We sought to identify the differences in parent (major) and child (minor) populations among the cohorts before specifically looking at PD-1 and CTLA-4. The seven parent and 12 child populations were gated (Supplementary figure 1, Table 1). Each parent population was measured as a percentage of mononuclear cells and each child population as a percentage of the parent population, with the exception of granulocytes, which were measured as a percentage of CD45-positive cells. We compared percentages of the populations from each cancer cohort with the healthy volunteer (HV) cohort using a two-stage linear step-up procedure of Benjamini, Krieger and Yekutieli to identify discoveries for possible biomarkers (Figure 1). To meet the criteria for a discovery, the difference between the HV group and cohort being compared had to reach a minimum P-value of < 0.05 and a false discovery rate (FDR) with q-value of < 0.10.12 Our results identified that percentage of T cells in both the liver tumor group and the chronic lymphocytic leukaemia (CLL) group were less compared to the HV group. Percentages of both natural killer cells (NKs) and natural killer-like T cells (NKTs) were lower in the CLL cohort and that of NKT-CD8+ cells were lower in the liver tumor cohort. The CLL group had a higher percentage of B cells than the HV group but had lower lineage-negative cells, monocytes and granulocytes. Patients with glioblastoma multiforme (GBM) had fewer B cells; patients with liver tumor had more lineage-negative cells. These results are similar to the general observations found in our previous immune monitoring studies of GBM, thyroid cancer and CLL.13-15
| Cohorta | ||||||
|---|---|---|---|---|---|---|
| Populationb | HV | GBM | Liver cancer | CLL | Thyroid cancer | Referencec, d |
| Mean % CTLA-4-Pos cells | ||||||
| T cells, % MNCs | 1.82 | 1.26 | 1.14 | 6.76 e | 3.95 | Fife and Bluestone6 |
| CD4-pos T cells, % CD3 | 2.19 | 1.04 | 1.34 | 8.75 e | 4.48 | Kaufmann et al.28 |
| CD4 naïve, % CD4 | 0.32 | 0.28 | 0.95 | 0.51e | 0.52 | Jago et al.29 |
| CD4 memory, % CD4 | 3.09 | 1.28 | 1.5 | 11.46 e | 5.24 | Jago et al.29 |
| CD8-pos T cells, % CD3 | 1.23 | 1 | 0.94 | 4.86e | 2.87 | Long et al.30 |
| Memory CD8, % CD8 | 2.09 | 1.33 | 1.15 | 8.67 e | 3.87 | Long et al.30 |
| Naïve CD8, % CD8 | 0.33 | 0.43 | 0.15 | 0.55e | 1.43 | Long et al.30 |
| CD3DN, % CD3 | 0.71 | 0.46 | 0.76 | 6.59 e | 1.37 | Anand et al.31 |
| CD8CD4-pos T cells, % CD3 | 17.96 | 18.31 | 22.37 | 26.54 e | 25.94 | – |
| NK cells, % MNC | 2.87 | 2.98 | 2.85 | 16.03 e | 2.22 | Beldi-Ferchiou Caillat-Zucman32 |
| NKT cells, % MNC | 10.52 | 21.86 | 14.32 | 19.06 e | 11.67 | Yamagiwa et al.33 |
| NKT-CD8, % NK T cells | 1.72 | 3.94 | 2.39 | 7.35 e | 3.48 | – |
| B cells, % MNC | 1.16 | 0.71 | 0.58 | 0.89 | 3.69 | Steiner et al.34 |
| LIN neg, % MNC | 0.54 | 0.3 | 0.11 | … | 1.2 | Liu et al.35 |
| Monocytes, % MNC | 2.42 | 1.49 | 2.58 | 8.02 e | 2.48 | Wang et al.36 |
| Granulocytes, % CD45-pos | 6.56 | 4.96 | 3.71 | 11.44 e | 6.56 | Fujiwara et al.37 |
| Mean % PD-1-Pos cells | ||||||
| T cells, % MNC | 29.51 | 33.05 | 30.23 | 36.50 e | 28 | Fife and Bluestone6 |
| CD4-pos T cells, % CD3 | 27.8 | 27.29 | 30.49 | 33.37 e | 26.84 | Yang et al.38 |
| CD4 naïve, % CD4 | 2.5 | 2.65 | 5.01 b | 6.05 e | 2.15 | Pardoll2 |
| CD4 memory, % CD4 | 39.95 | 38.39 | 39.13 | 43.22 e | 36.12 | Foldi et al.39 |
| CD8-pos T cells, % CD3 | 33.92 | 45.46 e | 30.54 | 43.83 e | 31.72 | Shi et al.40 |
| Naïve CD8, % CD8 | 14.61 | 25.53 e | 16.38 | 29.19 e | 13.97 | Waki et al.41 |
| Memory CD8, % CD8 | 55.19 | 61.58 | 40.54 e | 55.48 | 47.61 e | Waki et al.41 |
| CD8CD4-pos T cells, % CD3 | 49.26 | 49.86 | 44.25 | 53.49 | 48.55 | Chauhan et al.42 |
| CD3DN, % CD3 | 27.27 | 27.59 | 37.04 | 48.82 e | 28.67 | Shi et al.40 |
| NK cells, % MNC | 8.8 | 13.43 | 12.81 | 22.65 e | 5.60 e | Beldi-Ferchiou and Caillat-Zucman32 |
| NKT cells, % MNC | 37.68 | 41.91 | 37.1 | 45.89 e | 34.78 | Chen et al.43 |
| NKT-CD8, % NKT cells | 34.08 | 37.29 | 30.1 | 40.49 | 29.38 | Chen et al.43 |
| B cells, % MNC | 1.16 | 2.58e | 1.1 | 22.87 e | 1.38 | Fife and Bluestone6 |
| LIN neg, % MNC | 0.21 | 0.35 | 0.2 | … | 0.2 | Liu et al.35 |
| Monocytes, % MNC | 0.19 | 0.07e | 0.21 | 4.27e | 0.13 | Chen44 |
| Granulocytes, % CD45-pos | 0.87 | 0.92 | 1 | 3.94e | 0.57e | Orozco-Uribe et al.45 |
- CLL, chronic lymphocytic leukaemia; CTLA-4, cytotoxic T-lymphocyte-associated protein 4; GBM, glioblastoma multiforme; HV, healthy volunteer; LIN neg, lineage-negative; MNC, mononuclear cell; NK, natural killer; NKT, natural killer T cell; PD-1, programmed death 1; pos, positive.
- a Bold indicates populations determined positive (5% or greater) for PD-1 or CTLA-4.
- b NKT-DP, NKT-CD4 and NKT-DN populations in all cohorts and LIN neg for the CLL cohort were not included in the analysis because they did not reach the minimum criteria for event counts.
- c Contains examples of phenotypes previously observed.
- d A dash indicates that examples were not found.
- e Value significantly (P < 0.05) higher or lower than HVs.
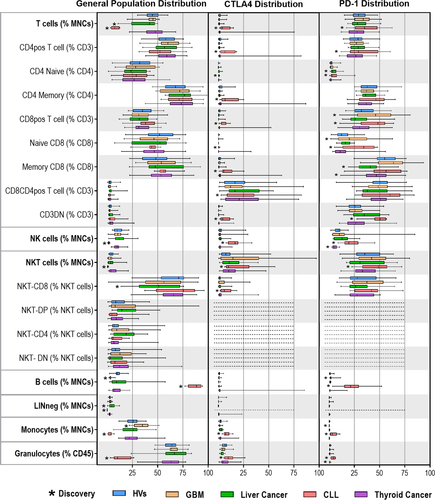
Identification of white blood cell CTLA-4+ and PD-1+ staining populations in HVs and cancer patients
We plotted each population by side scatter vs CD152 or PD-1 to determine the percentage of cells positive for each marker. To reduce false-positive results and exclude noise, we evaluated populations that had 100 events or more in the positive gates. We found that NKT CD4+CD8+ (double-positive, DP), NKT CD4+ and NKT CD4−CD8− (double-negative, DP) DN had too few events to include in this analysis. We identified CTLA-4+ or PD-1+ populations that were not present in the HVs or were statistically different compared with HV populations (Figure 1 and Table 1). We also identified CTLA-4+ DP T cells, and CTLA-4+ NKT-CD8+ cells, which had previously not been identified. Uniquely, one thyroid cancer patient was found to be an outlier with CTLA-4+ cells, while all other samples showed no indication of CTLA-4 on the measured populations (Supplementary figure 2). These results could be indicative of variability of immunity among patients, which could be identified via further study.
Hierarchical clustering of PD-1
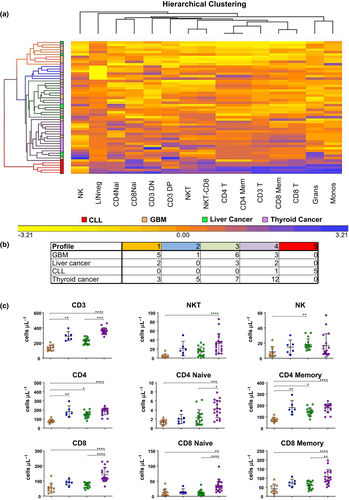
We have successfully used unsupervised hierarchical clustering to group patients into immune profiles that have correlated with survival in patients diagnosed with cancer11 and ALS.12 The immune profiles – compositions of all characteristics of the leucocyte populations in their entirety – are influenced but not determined by the cancer type. Thus, immune phenotypes, as opposed to disease phenotypes, may be used to guide immune-based therapies across diseases. Immune profiles of patients may be quite heterogeneous within a specific disease entity but may also be similar and/or shared with patients of a different disease. By clustering these values, we identified five distinct PD-1 profiles (Figure 2); clustering was not performed on CTLA-4 because of low values of expression in circulating blood cells. Profiles with fewer than five patients were not used for further analysis. Profile 1 consistently had the least amount of cells positive for PD-1 in all 19 populations. Profile 5 was composed of five CLL patients with high levels of PD-1 across all populations, making it uniquely characteristic of CLL. Profiles 2 and 3 differed in PD-1+ cells on the basis of populations, whereas in profile 4, the number of PD-1+ cells was consistently increased. One of the advantages of this approach is that it can determine whether cancer source (tumor type) determines the evolution of immunity of a patient. We note that solid tumors were spread among the immune profiles. The unique nature of profile 5 (the only leukemic profile; CLL) is likely because of the influence of the changes in other leucocytes in circulation (i.e. reduction in monocytes, T cells and granulocytes). Importantly, these data strongly suggest that there may be a finite number of immune profiles that describe PD-1 expression across solid tumors and that methods (if verified) could be applicable across tumor types without having to repeat studies for each tumor. To verify that these observations did not depend on the leucocyte counts but rather on PD-1, the same analysis was performed using the results of our TBNK10 assay (T cells, B cells and NK cells), which provided the ability to look at the same populations independent of PD-1 levels. This analytical approach failed to cluster the patients into the same profiles as those based on PD-1 (Supplementary figure 3).
Comparison of patients receiving pembrolizumab
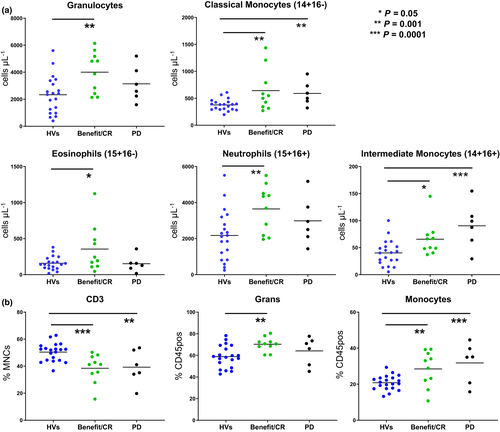
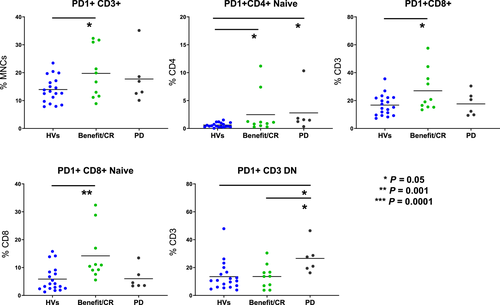
To test whether phenotypic differences could be identified among responders and non-responders to checkpoint inhibitors, pre-treatment blood samples were collected from 16 patients on pembrolizumab. Samples were analysed using both a multiparameter flow assay to measure PD-1 levels on 19 leucocyte populations and our standard TBNK assay. Absolute counts of granulocytes, classical monocytes, neutrophils and intermediate monocytes were increased (P ≤ 0.05) in patients with benefit/complete response (CR) than in HVs. Similarly, absolute counts of intermediate and classical monocytes showed the same pattern (P ≤ 0.01) in patients with progressive disease (PD) to HVs (Figure 3a). CD3 (% MNCs) was lower (P ≤ 0.01) in benefit/CR and PD groups than in HVs, while both granulocytes (% CD45-positive) and monocytes (% CD45-positive) were increased (P ≤ 0.01; Figure 3b). Patients with benefit/CR expressed more PD-1-positive T cells (PD-1+CD3+, PD-1+ naïve CD4+, PD-1+CD8+, PD-1+ naïve CD8+) compared to HVs. PD-1+CD3+ DN and PD-1+ naïve CD4+ T cells were significantly higher (P ≤ 0.05) in patients with PD than in those who received benefit/CR or HVs (Figure 4). CD3+ DN cells, independent of PD-1, have been identified and associated with systemic inflammation,16 but PD-1+ CD3+ DN cells have not been studied in cancer research or identified as a biomarker for progression of disease. However, we speculate that many of the CD3+ DN cells could be γδ T cells, which have been studied and are known to increase in PD-1 because of antigenic stimulation.17, 18 Here, we note that patients receiving pembrolizumab whose disease has progressed also have greater surface expression of PD-1+CD3+ DN than CR or HV groups. The analysis of single immune phenotypes as predictive biomarkers is fundamentally limited as rarely do a single population of leucocytes predict immune response. To that end, we hypothesised that, using hierarchical clustering to identify patients with similar immune profiles, changes pre-treatment and post-treatment should be visible that represent global changes in immunity.
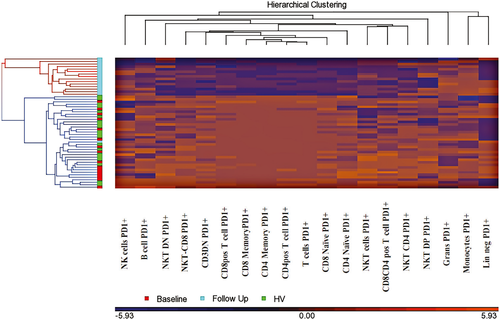
We clustered patient samples pre-treatment (n = 16) with their correlating post-pembrolizumab treatment follow-up sample (n = 16), as well as 20 HVs. When all three groups were combined and clustered, two profiles were created. Profile 1 consisted of all baseline samples, HVs and one follow-up, while profile 2 consisted purely of follow-up samples (Figure 5). Thus, this approach captured the immunological changes caused by the treatment of pembrolizumab. Reduction in PD-1 by pembrolizumab is responsible for clustering of post-treatment samples. By expanding the size of our PD-1-treated cohort, we would have the power to perform immune profiling based on patient outcomes, which we seek to do in future studies.
Discussion
Currently, immunohistochemistry of tumors is considered the standard method for measuring checkpoint inhibitors in cancer patients, but its limitations are being recognised. Tumor biopsy provides a glimpse of the tumor and disease rather than the complete clinical picture; in addition, if tissue is limited, limited assays can be performed. This method also is not ideal for longitudinal studies because of its invasive nature.19 These challenges show the value of immune monitoring of peripheral blood. Furthermore, cancers without solid tumors, such as leukaemia, or with difficult biopsies are more suited to be monitored using peripheral blood.20
Aware of the need for blood-based immune checkpoint testing, we have developed a multiparameter flow cytometry assay that allows us to measure proteins CTLA-4 and PD-1 in an unbiased manner. The use of this approach provides data on 19 different populations in peripheral blood, thereby enabling a broad look at basic immunity through leucocyte populations, as well as discovery of specific new checkpoint-related phenotypes. In the present study, we applied this methodology to a HV population and four cancer cohorts.
Differences were identified in the percentage of leucocyte populations for HVs compared with cancer patients. Such results have been observed previously, considering the altered and immunosuppressed state of cancer patients. However, these increases or decreases in basic general leucocyte populations are not necessarily mimicked when measuring CTLA-4 or PD-1 on these cells. For example, GBM patients showed no difference from HVs in their naïve CD8+ T cells, yet PD-1 was expressed on a greater number of naïve CD8+ T cells in GBM patients compared to HVs. Similarly, thyroid cancer patients had no difference in the percentage of NK cells compared to the HVs but did express less PD-1 on them. These observed changes are a reflection of the reaction of the immune system and cell activation to different cancer types.
We identified two CTLA-4+ cell populations that, to our knowledge, have not been described previously: CTLA-4+CD3+ DP T cells in HVs and four cancer cohorts, and CTLA-4+ NKT-CD8+ cells in CLL patients. It has been postulated that DP T cells and NKT cells are involved in tumor response and cytokine secretion21; hence, CTLA-4 expression is reflective of the immune system's activated status. In our analysis of CTLA-4 on thyroid patients, we noticed highly unusual results for 1 patient. CTLA-4 expression was found on all measured phenotypes of this person except naïve CD4+ T cells. We could not pinpoint an exact reason for this observation.
CTLA-4 and PD-1 differences were observed not only between HVs and cancer patients but also among the cancer cohorts themselves. The CLL cohort had the most striking outcomes. Of the 15 populations measured, 11 had positivity for CTLA-4, whereas thyroid cancer patients expressed CTLA-4 on only memory CD4+ cells and all cohorts expressed it on only DP T cells and NKT cells. These differences in the CLL cohort are most likely because of the nature of CLL as a cancer of the blood, bone marrow and lymphatic system, with the tumor microenvironment directly in the peripheral blood of the patient. Our results showed that a disease-specific approach to studying these markers has value.
Unlike in the traditional method of analysis, we approached our data in a disease-independent manner to cluster patients on the basis of their PD-1 status alone rather than cancer type. Using hierarchical clustering of the PD-1 cells µL−1 of each population, we identified five distinct groups. CLL patients grouped together, yet the distribution of the other cancer patients was independent of disease. These results indicate immunologic similarity among patients with haematologic tumors but not necessarily among those with solid tumors. This discord among patients with solid tumors could suggest that grouping them on the basis of immunity is a better approach when considering immune-based therapies.
Patients in this study came from various cancer backgrounds, and either had no prior treatment or, as in the case of GBM patients, had previously received temozolomide. The patients, as a collective, were heterogeneous in age and sex, as well as degree of progression. We recognise that these differences can be viewed as a weakness of the study. At the same time, we note that even with this variation, our assay was able to detect and classify patients on the basis of PD-1 and CTLA-4 alone.
The methodology of identification and categorisation of patients based on phenotypic immune profiles rather than cancer type and the methodology's multiple uses have been described previously.11 Emerging evidence now shows that systemic immunity is a vital component of an effective antitumor response.22 Immune profiles affect survival in both cancer and noncancer clinical settings, as seen in our previous study of ALS patients with high levels of PD-1-positive T cells, which were associated with increased survival.11, 12 This approach is likely to allow for biomarker discovery applications, immune monitoring of clinical trials, optimisation of patient selection criteria and customisation of immunotherapies to the appropriate patients. In addition, our protocol allows an understanding of checkpoint protein biology in different human contexts. For example, this methodology has been used to understand the relationship of PD-1 with other cell phenotypes. In a study of diffuse large B-cell lymphoma, this assay was used in combination with our TBNK assay and showed that PD-1-positive cell counts were inversely associated with T-cell counts.10 With similar methods and when evaluating the influence of exercise on the immune system, CD45RO memory cells were observed to express PD-1 at higher levels than naïve cells.23
Substantial effort has been put in identifying biomarkersti predicting survival in patients treated with various checkpoint inhibitors and therapeutic combinations. Research looking at protein expression, mutations, neoantigens, gene and epigenetic signatures has found markers for responders on specific cancer types. Similarly, peripheral blood immune cells have been used as indicators of outcome.24 For example, higher absolute lymphocyte, specifically eosinophil counts, and low absolute monocyte counts have been associated with survival in patients with melanoma who are being treated with ipilimumab. Similarly, we found higher absolute counts in monocytes and eosinophils in patients receiving benefit from anti-PD-1 therapy. Other studies show immune phenotyping of melanoma patients receiving anti-CTLA-4 therapy indicates response to treatment when CD4+ and CD8+ memory T cells were higher at baseline; the same was not seen in patients receiving anti-PD-1 therapy.25 Comparatively, our results also showed no difference in CD4+ or CD8+ memory T cells in patients who responded to anti-PD-1 therapy. Among the immune phenotypes of patients receiving pembrolizumab, PD-1 positivity in T cells was similar to patients with autoimmunity.14 Continuation of such studies through the use of immune monitoring may help us to better understand immune-related adverse events and aid in the prediction of patients who are susceptible.
The path to predicting responders and non-responders to checkpoint inhibitors is not well understood. We believe the best approach will use a multiparameter blood-based immune monitoring assay either alone or in combination with tumor-specific assessments. The assay sensitivity allows for the measurement of the distribution of major leucocyte populations and for the expression of checkpoint proteins CTLA-4 and PD-1 on the cell surface. Monitoring the circulating immune system has the potential to significantly impact patient care by rapidly and carefully selecting patients who will benefit from immune checkpoint inhibitor therapies. For the non-responders, importantly, alternative treatment strategies that may be of greater benefit than checkpoints may be pursued.
Methods
Patients and HVs
Peripheral blood was collected from 60 HVs and 20 patients with GBM, 10 with liver tumors (six primary liver tumors and four liver metastases), nine with CLL and 35 with thyroid cancer. The Mayo Clinic Institutional Review Board approved all study protocols. GBM patients were actively participating in a dendritic cell vaccine trial (NCT 01957956) and had temozolomide, surgery and radiation treatment before sample collection. CLL patients were newly diagnosed and had no treatment. Liver tumor patients' samples were collected at baseline, prior to the start of SBRT treatment.14, 26 The thyroid cancer group consisted of patients without active disease, with advanced but stable disease and with advanced disease soon to start its treatment. Peripheral blood was also collected from a separate group of 26 cancer patients (21 lung, four melanoma and one genitourinary) prior to being treated with pembrolizumab or atezolizumab or other checkpoint inhibitor treatment combinations and several time points following (Supplementary table 1).
Whole blood flow cytometry and gating strategies
Whole blood was stained on the day of collection using an established method for the identification of multiple cell populations by flow cytometry, along with sources for antibodies and instrument settings, and novel analysis methods that capture data on more than 120 phenotypes. Staining protocol, instrument settings, reagents and manufactures' details are all listed in Gustafson et al.10 as the protocol was followed without deviation. A 7-tube panel was used to identify a variety of leucocyte populations (TBNK lyse no wash, T cell-1, B cell, myeloid and granulocyte)10 (monocytes and T cell-2)23 although only T cell-2 and TBNK assays were used for the analysis described in this manuscript. Briefly, 100 μL of fresh whole blood was blocked for 5 min with 50 μL of mouse serum (Sigma-Aldrich, St. Louis, MO, USA; Cat #M5905) and stained with the appropriate antibodies for 15 min in the dark at room temperature. Following staining, samples were lysed for 20 min with 2 mL of VersaLyse reagent (Beckman Coulter, Indianapolis, IN, USA; Catalog #A09777) centrifuged for 5 min at 200 g and then washed with PBS-FE (PBS; Gibco; Gaithersburg, MD, USA, Catalog #14190) containing 1% albumin (Sigma-Aldrich; Catalog #A7034) and 5 mm EDTA (Sigma-Aldrich; Catalog #E7889) and fixed in 1% paraformaldehyde (Mayo Processing Laboratory, Rochester, MN, USA). Wash step was not performed on TBNK assay; rather, 100 μL Flow-Count Fluorospheres (Beckman Coulter; Catalog #B96656) were added directly and sample was collected on the flow cytometer immediately. All samples were run on a 3-laser 10-colour Gallios flow cytometer (Beckman Coulter, Chaska, MN, USA).
An extended analysis focused on T-cell phenotypes was performed using markers CD152, CD45RO, CD56, CD3, CD8, CD28, CD4 and CD45 (Supplementary table 2).23 T-cell parent populations were characterised by side scatter, forward scatter, CD45+, CD3+, CD4+, CD8+ and CD4+/CD8+ subpopulations. These populations were assessed for PD-1 and CTLA-4 positivity. Cell populations not meeting the minimum criteria of 100 events were excluded from PD-1 and CTLA-4 analyses. For histogram analyses, an HV whole blood sample was stained with the T-cell signalling panel. Histograms were generated from each of 10 antibodies (except CD45) and used to delineate mononuclear populations (defined by CD45+ SSClo/med) (Figure 6). Regions (R1 and R2) were designated for each peak of expression, including peaks with no expression (N), for each antibody.
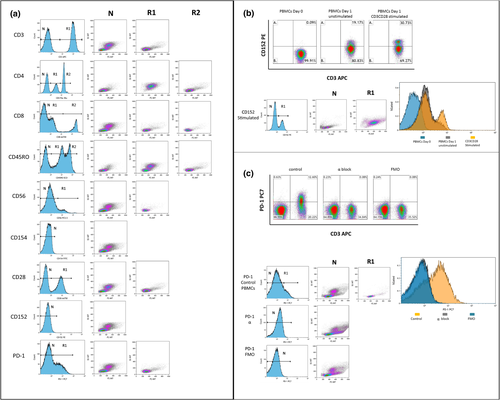
Forward scatter and side scatter density plots were created for each histogram peak.
Validation of the CD152 PE antibody was performed with isolated peripheral blood mononuclear cells (PBMCs). Cells were divided into two fractions: unstimulated cells were analysed immediately and stimulated PBMCs were cultured with CD3CD28 Dynabeads (Thermo Fisher Scientific, Waltham, MA, USA) for 24 h to increase the levels of CD152 and then were analysed (Figure 6b). The gating strategy was determined with the use of the positive CD152 population. PD-1 was similarly validated. Two conditions were used: in the first condition, PBMCs were blocked with anti-PD-1 antibody before staining; for the second condition, Fluorescence Minus One for PD-1 was performed (Figure 6c). Both samples were used to set up the gating strategy for PD-1.
Statistical analysis
Prism version 7.0 (GraphPad Software, Inc, La Jolla, CA, USA) was used for the multiple t-test comparisons and graphical representations. The approach of false discovery rate was used for the multiple t-test comparisons with the 2-stage step-up method of Benjamini et al.27 and a set false discovery rate with q-value of 10%. Multiparameter analysis and hierarchical clustering were completed as described by Gustafson et al.12 in 2017. Hierarchical clustering of PD-1 expression was performed with Partek Genomics Suite 6.6 (Partek Inc, St. Louis, MO, USA). All phenotypes were analysed except those with event counts < 100 in PD-1 and CTLA-4 analyses (NKT-DP, NKT-CD4+ and NKT-DN). B-cell counts also were excluded because they would artificially skew clustering because of high levels in the CLL cohort. The analysis was completed as described by Gustafson et al.11 in 2013. Statistical significance of the group distribution was verified with Fisher's exact test. Significance between profiles was determined with a one-way analysis of variance.
Acknowledgments
The authors are thankful for the support of this work by the Ben and Catherine Ivy Foundation, and Mayo Clinic's Center of Individualized Medicine, and Department of Laboratory Medicine and Pathology. The authors also thank Ruth Johnson for technical assistance with the processing of samples. This study was funded by various internal Mayo Clinic sources.
Conflict of Interests
MPG and ABD are inventors of technology used as a tool in this research (US Patent #20160077096, 2016). While this invention is not the target of these studies, the value may be brought to this invention by demonstrating new properties of the invention. MPG, ABD and Mayo Clinic have rights to this invention, and in the future, the invention may be licensed or sold to the benefit of the investigators or Mayo Clinic. Currently, this technology is not licensed.
Author Contributions
Svetlana Bornschlegl: Data curation; Formal analysis; Investigation; Methodology; Validation; Visualization; Writing-original draft; Writing-review & editing. Michael P Gustafson: Conceptualization; Data curation; Formal analysis; Investigation; Methodology; Validation; Visualization; Writing-original draft; Writing-review & editing. Danae Delivanis: Data curation; Writing-review & editing. Mabel Ryder: Data curation; Writing-review & editing. Minetta C Liu: Data curation; Writing-review & editing. George Vasmatzis: Data curation; Writing-review & editing. Christopher L Hallemeier: Data curation; Writing-review & editing. Sean S Park: Data curation; Writing-review & editing. Lewis R Roberts: Data curation; Writing-review & editing. Ian F Parney: Data curation; Writing-review & editing. DianeF Jelinek: Data curation; Writing-review & editing. Allan B Dietz: Conceptualization; Funding acquisition; Investigation; Methodology; Project administration; Supervision; Visualization; Writing-original draft; Writing-review & editing.
Ethics approval and consent to participate
The protocol was approved by the Mayo Institutional Review Board and conformed to the Declaration of Helsinki. All participants provided written informed consent.
Open Research
Data Availability Statement
Other data sets used and/or analysed during the current study are available from the corresponding author on reasonable request.


