Profiling of circulating serum exosomal microRNAs in elderly patients with infectious stress hyperglycaemia
Kejing Zeng, Haozhe He and Zhenjing Lv contributed equally to this work.
[Correction added on 06 December 2023; after first online publication missing sub-sections have been added.]
Abstract
Background
Early diagnosis of hospitalized elderly patients with infectious stress hyperglycaemia (ISH) is clinically important, especially under the global coronavirus disease 2019 (COVID-19) pandemic, as without timely prevention and effective treatment, it is likely to deteriorate into septic shock, thus worsening patient survival and complications. Moreover, cumulative studies have showed that patients with COVID-19 are reported to have a greater prevalence of hyperglycaemia. However, the underlying mechanism remained unknown.
Aim and method
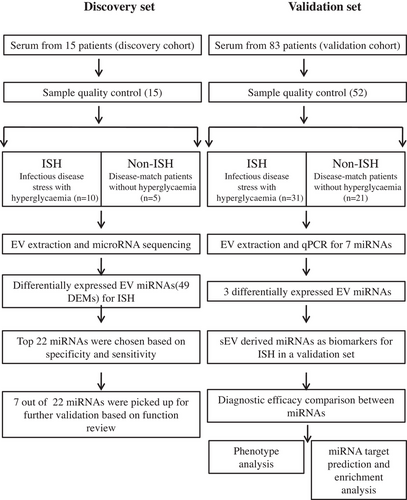
Systematic screening of specific biomarkers of serum exosome-derived microRNAs (sE-miRNAs) from ISH patient has not yet been reported. In this study, sE-miRNAs were derived from 10 elderly patients with ISH and 5 control patients with disease-match without hyperglycaemia (non-ISH). RNA sequencing identified that a total number of 49 sE-miRNAs with differential expression between ISH and control group. Of which, top 22 miRNAs ranked by sensitivity × specificity were chosen for further research. Moreover, 7 out of 22 miRNAs that related to glucose metabolism or immune disorder were picked up for further validation in an independent cohort consisting of 52 participants (31 ISH and 21 non-ISH).
Result
A validation analysis revealed that three miRNAs (hsa-miR-21-5p, hsa-miR-335-5p and hsa-miR-28-3p) were statistically up-regulated in exosomes from ISH patients. In the validation cohort and discovery cohort, the AUC of three individual miRNAs ranged from 0.73 to 0.88. A logistic model combining three miRNAs achieved an AUC of 0.96. Besides, sE-miRNAs-based signatures effectively characterized patients' poor clinical outcome. Survival curve analysis showed that hsa-miR-335-5p, hsa-miR-28-3p but not hsa-miR-21-5p, were significantly closely related to mortality, and the combination of these three miRNAs could also predict patients outcome (p < .05).
Conclusion
This study depicted the circulating exosomal miRNAs change in ISH patient, which could be used as a promising biomarker to detect ISH at an early stage and predict patients clinical outcome.
1 INTRODUCTION
Stress hyperglycaemia (SHG) has an especially high incidence and mortality in hospitalization for elderly patient particularly.1, 2 It is a series of immune-neuro-endocrine responses that appear after stress, including acute myocardial infarction, stroke, perioperative period, severe infection and so on, which mostly manifested as elevated blood glucose level and lead to related changes in body metabolism.3 Especially under infection background, such as patients with coronavirus disease 2019 (COVID-19) are reported to have a greater prevalence of hyperglycaemia.4-7 Cytokine release as a consequence of severe infection may precipitate the onset of metabolic alterations by affecting glucose homeostasis, which leads to abnormalities in glycometabolic control, insulin resistance (IR) and β cell dysfunction in patients with infection even without any pre-existing history or diagnosis of diabetes. Stress hyperglycaemia seriously affects the stability of the body's internal environment, which cause a profound impact on metabolism and immune function, thereby affecting the patients’ prognosis.2, 8 Stress hyperglycaemia is associated with an increased risk of in-hospital mortality regardless of whether the patients have diabetes background or not.1, 9 It is suggested that COVID-19-associated new-onset hyperglycaemia may predispose patients to long-term hyperglycaemia, worse clinical outcomes and clinical scores, prolonged hospital stays higher demand for oxygen support or positive-pressure ventilation.10 Therefore, early identification of stress hyperglycaemia, exploration of its mechanism and precise management are the focus areas that urgently need attention and have become an important public issue of health concern.
Inflammation is one of the main causes of stress hyperglycaemia, especially infectious stress hyperglycaemia (ISH), which are able to predictable deterioration to septic shock, and the fatality rate is as high as 70%–80%.1, 11 Moreover, 95% of sepsis patients have abnormal glucose metabolism and severe IR, and the exact molecular mechanism is not yet clear.1 Intensive insulin therapy (IIT) is currently the main method for the treatment of stress hyperglycaemia.12-14 However, due to the body's IR and stress state, IIT is not effective in counteract hyperglycaemia, which often leads to undesirable glucose fluctuations, and the risk of hypoglycaemia is greatly increased, which showed no benefit in the medium and long-term survival rate.15 Therefore, it is important to explore the underlying mechanism of ISH and reveal its molecular pathways and make effort to explore safe and effective therapeutic targets.
Exosomes are small extracellular vesicles (sEVs) secreted by cells and are present in several kinds of body fluids, such as blood, urine, breast milk and ascites.16 Exosomes contain a variety of molecules that exhibit biological activity, such as mRNAs, miRNAs, lncRNAs, proteins and lipids, of which to some extent reflect the states and types of their cells of origin.17 As the protection of the membrane, the enclosed miRNAs are more stable and will not be degraded by RNase that presented in biofluids. Thus, exosomes are emerging as non-invasive biomarkers for diagnosis, prognosis and response to treatment.18-21
MicroRNAs (miRNAs) are endogenous 21–23 nt small non-coding RNAs capable of controlling gene expression through post-transcriptional regulation.22 MiRNAs could degrade complementary target mRNAs in an RNA-induced silencing complex dependent manner, which is essential in embryo development,23 oncogenesis,19 immune regulation24, 25 and other biological processes. MiRNAs had been identified as exosome-encapsulated form in many biofluids, suggesting the potential of developing circulating miRNAs as biomarkers of cancer and metabolic diseases.22 The previous studies proposed that miRNAs were usually be packaged into exosome that secreted by adipose tissue macrophages and transferred to insulin-target cell and exert robust effects on cellular insulin action and overall glucose homeostasis.26
Due to these advantages, exosomal miRNAs are emerging as promising biomarkers for different kinds of diseases.27-35 However, the biogenesis of circulating exosomal miRNA is of high heterogeneity, which could derive from different cells.27 There is growing evidence that suggests the potential role for sEVs in early detection of many diseases.22, 28-35 However, systematic screening of serum sEVs derived elderly ISH patients’ biomarkers has not yet been reported.
In this study, we detected and screen the total miRNA profile of circulating serum sEVs-enriched fractions in early ISH patients paired with infectious individuals without stress hyperglycaemia (non-ISH) by a next-generation sequencing method. We characterized several sEVs-derived miRNAs, and their combinations could largely distinguish ISH patients from control to some extent. Furthermore, we validated those biomarkers in an independent clinical validation cohort, so as to evaluate their performance to predict negative clinical outcome, including septic shock and death. The significance of our study showed that exosomal miRNAs were able to identify patients with ISH and predict the poor clinical outcome.
2 MATERIALS AND METHODS
2.1 Patients information and sample collection
A total number of 10 infectious disease-related stress hyperglycaemia patients (ISH) with random blood glucose >11.13 who hospitalization at the department of intensive care unit (ICU), Sun Yat-sen Memorial Hospital of Sun Yat-sen University (Guangzhou, China), between June 2020 and September 2021 were enrolled in this study along with 5 control normoglycaemia patients (non-ISH) for biomarker discovery. Additional 83 participants were enrolled for validation, and 52 participants (31 ISH and 21 non-ISH) were finally enrolled after sample quality monitoring. This study was approved by the ethics committee of Sun Yat-sen Memorial Hospital of Sun Yat-sen University (Ethical approval SYSEC-KY-KS-2021-189). Peripheral blood samples from individuals were collected in EDTA tubes following a regular venipuncture procedure on the first day of admission to ICU, before accept any antibiotics, insulin or parenteral nutrition intervention. After centrifugation at 3000 × g for 15 min at 4°C, the serum was aspirated and stored at −80°C refrigerator before use.
2.2 Exosome isolation
A volume of 2 mL serum was collected from each patient, and each sample was under the quality inspection before further detection. The exosomes were isolated by SEC (size exclusion chromatography) methods as described previously with minor modifications.36, 37 Briefly, 1 mL of 0.8 μm-filtered serum was 1.5-fold diluted with PBS and further purified using Exosupur columns (Echobiotech, China). The samples were then eluted with further 0.01 M PBS, and a volume of 2 mL eluate fractions were collected according to the manufacturer's instructions. Fractions were concentrated to 200 μL by 100 kDa molecular weight cut-off Amicon Ultra spin filters (Merck, Germany).
2.3 Exosomal protein biomarkers quantification
sEV protein quantification was detected by Pierce BCA Protein Assay Kit (Thermo Scientific, Product No. 23225) according to the product manual. sEVs-enriched fraction sample and 10 μL of each standard were pipetted into 96-Well plates, respectively, and then 200 μL of the WR were added to each well and mixed plate thoroughly by a plate shaker for 30 s. Then the plate was incubated in thermostat at 37°C for 30 min. The absorbance at 562 nm on the plate reader was measured. A standard curve was calculated and used to determine the protein concentration of each sEVs-enriched fraction sample.
2.4 Nanoparticle tracking analysis (NTA)
Exosome-enriched suspension with concentrations between 1 × 10⁷/mL and 1 × 10⁹/mL was examined using the ZetaView PMX 110 (Particle Metrix, Meerbusch, Germany), and a 405 nm laser were equipped to detect the size and quantity of particles isolated. Moreover, a 60-s duration video was taken with a frame rate of 30 frames/s, and particle movement was analysed using nanoparticle tracking analysis (NTA) software (ZetaView 8.02.28).
2.5 Transmission electron microscopy (TEM)
A volume of 10 μL sEVs-enriched solution was placed on a copper mesh and incubated at room temperature for 1 min. The sEVs-enriched fraction was contrasted by uranyl acetate solution for 1 min after washing with sterile distilled water. The sample was then dried for 2 min under incandescent light. The copper mesh was observed and photographed under a transmission electron microscope (H-7650, Hitachi Ltd., Tokyo, Japan).
2.6 Western blot analysis
Required concentration sodium dodecyl sulfonate (5× SDS) buffer was used to denatured the sEVs-enriched supernatant, and then they were subjected to western blot analysis (10% SDS-polyacrylamide gel electrophoresis; 50 μg protein/lane) using rabbit or mouse polyclonal antibody CD9 (60232-I-Ig, Proteintech, Rosemont, IL, USA), HSP90 (60318-I-Ig, Proteintech, Rosemont, IL, USA), TSG101 (sc-13611, Santa Cruz, CA, USA) as EV characteristic markers and calnexin (10427-2-AP, Promega, Madison, WI, USA) as EV negative marker.
2.7 Total RNA isolation and RNA analyses
MiRNeasy Serum/Plasma Advanced Kit (Qiagen, cat. No. 217204) was used for total RNA extraction and purification for serum sEVs-enriched fractions according to standard protocol. RNA degradation and contamination were monitored on 1.5% agarose gels. The RNA Nano 6000 Assay Kit of the Agilent Bioanalyzer 2100 system (Agilent Technologies, CA, USA) was utilized for RNA concentration and purity.
2.8 Library building and sequencing
For small RNA libraries, a total amount of 2.5 ng RNA per sample was used as input material for the RNA sample preparations. Next for sequencing libraries, which were generated using QIAseq miRNA Library Kit (Qiagen, Frederick, MD, USA), the following manufacturer's protocols and index codes were added to attribute sequences to each sample. Reverse transcription (RT) primers with unique molecular indices (UMIs) were introduced to analyse the quantification of miRNA expressions during cDNA synthesis and PCR amplification. At last, library quality was assessed on the Agilent Bioanalyzer 2100 and qPCR. The clustering of the index-coded samples was performed on acBot Cluster Generation System using TruSeq PE Cluster Kit v3-cBot-HS (Illumina, San Diego, CA, USA) according to the manufacturer's instructions. After cluster generation, the library preparations were sequenced on an Illumina NovaSeq 6000 platform, and paired-end reads were generated at EchoBiotech Co. Ltd., Beijing, P. R. China.
2.9 Quantification and differential expression analysis of miRNA
Clean reads were aligned by software Bowtie with sequences in databases, including Silva, Rfam, GtRNAdb and Repbase, respectively. Reads with more than 10%N, low quality, length >32 nt/<16 nt, or trimming 3ʹ adapter from the end of reads (no mismatch) were filtered. After filtering unwanted sequences, such as transfer RNA (tRNA), ribosomal RNA (rRNA), small nuclear RNA (snRNA) and small nucleolar RNA (snoRNA), remaining reads were then compared with miRNAs from miRbase and Human Genome (GRCh38) to identify known miRNAs as well as the prediction of brand new miRNAs. Expression matrices of quantified UMI counts of miRNAs were generated according to the mapping results of miRDeep2, which was used to calculate TPM. Then the TMM methods in edgeR were used to normalize the TPM of miRNA.
2.10 Adipose tissue miRNAs-related experimental protocol
2.10.1 RNA Extraction
Total RNA was extracted from samples using TRIzol-based RNA extraction method. Moreover, the RNA degradation and contamination were monitored on 1% agarose gels. RNA purity was checked using the NanoPhotometer spectrophotometer (IMPLEN, CA, USA). RNA concentration was measured using Qubit RNA Assay Kit in Qubit 2.0 Fluorometer (Life Technologies, CA, USA). RNA integrity was assessed using the RNA Nano 6000 Assay Kit of the Bioanalyzer 2100 system (Agilent Technologies, CA, USA).
2.10.2 Library preparation for transcriptome sequencing
A total amount of 3 μg RNA per sample was used as input material for the RNA sample preparations. Sequencing libraries were generated using NEBNext Ultra RNA Library Prep Kit for Illumina (NEB, USA) following manufacturer's recommendations, and index codes were added to attribute sequences to each sample. Briefly, mRNA was purified from total RNA using poly-T oligo-attached magnetic beads. Fragmentation was carried out using divalent cations under elevated temperature in NEBNext First Strand Synthesis Reaction Buffer (5×). First strand cDNA was synthesized using random hexamer primer and M-MuLV Reverse Transcriptase (RNase H-). Second strand cDNA synthesis was subsequently performed using DNA Polymerase I and RNase H. Remaining overhangs were converted into blunt ends via exonuclease/polymerase activities. After the adenylation of 3′ ends of DNA fragments, NEBNext Adaptor with hairpin loop structure was ligated to prepare for hybridization. In order to select cDNA fragments of preferentially 250–300 bp in length, the library fragments were purified with AMPure XP system (Beckman Coulter, Beverly, USA). Then 3 μL USER Enzyme (NEB, USA) was used with size-selected, adaptor-ligated cDNA at 37°C for 15 min followed by 5 min at 95°C before PCR. Then PCR was performed with Phusion High-Fidelity DNA polymerase, Universal PCR primers and Index (X) Primer. At last, PCR products were purified (AMPure XP system), and library quality was assessed on the Agilent Bioanalyzer 2100 system.
2.10.3 Clustering and sequencing
The clustering of the index-coded samples was performed on a cBot Cluster Generation System using TruSeq PE Cluster Kit v3-cBot-HS (Illumia) according to the manufacturer's instructions. After cluster generation, the library preparations were sequenced on an Illumina platform, and 150 bp paired-end reads were generated.
2.11 Target gene prediction and GO/KEGG pathway enrichment analysis
For each miRNA with differential expression between ISH and control, its potential target genes predicted using multiMiR R package (version 2.3.0) and the target genes predicted by at least three databases (software) or verified by at least one experiment were selected as the prediction results. Moreover, gene ontology (GO) enrichment analysis of the target genes of differentially expressed miRNAs was implemented by the topGO R packages. KEGG pathway enrichment was analysed by a python program KOBAS.
2.12 Quantification of miRNA expression with qPCR
The same amount of Caenorhabditis elegans cel-39-3p miRNA was spiked into each sEV sample as an external calibration for RNA extraction, RT and miRNA amplification. The total RNA from sEVs was extracted using miRNeasy Serum/Plasma Advanced Kit (Qiagen, cat. No. 217204) according to the manufacturer's protocol. The total RNA was then reverse transcribed to synthesize cDNA using PrimeScript RT reagent Kit (Perfect Real Time) (TAKARA, RR037A). The abundance of target gene expression was detected by TaqMan probe using real-time qPCR. A volume of 2 μL of cDNA was used as the template for each PCR reaction. The sequences of primers and probes are shown in Table S1. All samples were normalized by the initial biofluid input volume used for RNA extraction and calibrated by the spike-in cel-39-3p to eliminate the minute bias caused by different RNA isolation efficiencies and PCR efficiencies among samples.
2.13 Statistical analysis
Differences in the comparison of baseline data were using Wilcoxon test. Differential expression analysis between groups was performed using Wilcoxon test for baseline data the edgeR R package (3.12.1). p-Value ≤.05 and |log2(fold change) | >0.585 were assigned as differentially expressed miRNA. Diagnostic accuracy of candidate miRNAs or their combinations was assessed by receiver operating characteristic (ROC) curves analysis, and the area under the ROC curve (AUC) was also calculated. VennDiagram, heat map and ggplot2 were used for the visualization of results.
3 RESULTS
3.1 Clinical characteristics
In this study, we recruited a discovery cohort of 15 patients and a validation cohort of 52 out of 83 patients, of which 31 patients’ samples were excluded due to haemolysis or incomplete data. First cohort included 10 ISH patients and 5 disease-match non-ISH, whereas the validation cohort included 31 ISH patients and 21 non-ISH (NC). The workflow of the study is shown in Figure 1. The participants’ demographic and clinical information of age, gender, glucose, biochemical marker and hospitalization day are summarized in Table 1. There was no statistically significant difference between the ISH and control groups with respect to age, white blood cell count (WBC), absolute neutrophils and lymphocyte count (LY), C-reactive protein (CRP), length of hospital stay and APACHII score (p > .05).
| Group | non-ISH | ISH | Standardize diff. | p-Value |
|---|---|---|---|---|
| Female | 14 (58.33%) | 12 (27.91%) | ||
| Male | 10 (41.67%) | 31 (72.09%) | ||
| Age | 65.26 ± 16.09 | 66.02 ± 15.67 | 0.05 (−0.46, 0.56) | .854 |
| RBG | 7.61 ± 1.20 | 11.93 ± 3.40 | 1.70 (1.11, 2.28) | <.001 |
| WBC | 11.67 ± 4.85 | 16.44 ± 10.82 | 0.57 (0.05, 1.09) | .065 |
| NEU | 10.12 ± 4.77 | 14.25 ± 9.83 | 0.53 (0.01, 1.06) | .064 |
| LY | 0.88 ± 0.46 | 1.10 ± 0.94 | 0.30 (−0.22, 0.81) | .298 |
| CRP | 94.47 ± 85.92 | 148.67 ± 111.71 | 0.54 (0.02, 1.06) | .095 |
| Hospitalized days | 12.32 ± 13.56 | 14.18 ± 13.09 | 0.14 (−0.43, 0.71) | .627 |
| APCHEII | 23.35 ± 7.77 | 26.64 ± 7.93 | 0.42 (−0.10, 0.94) | .117 |
- Abbreviations: APACHII score, Acute Physiology and Chronic Health Evaluation; CRP, C-reactive protein; LY, lymphocyte count; NEU, absolute neutrophils; RBG, random blood glucose; WBC, white blood cell count.
3.2 Patients’ serum exosome-derived microRNAs (sE-miRNAs)
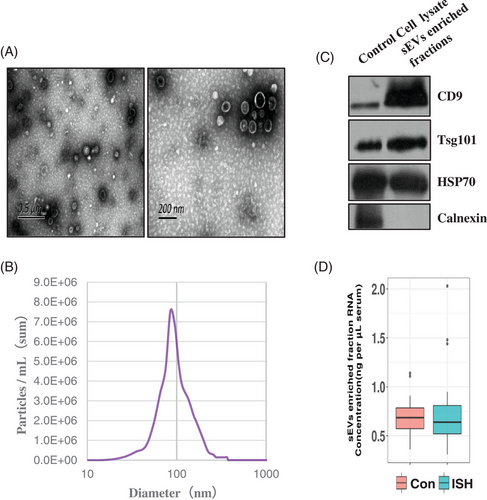
The serum exosomes vesicles (sEVs) were extracted from the ISH patients and controls by ultracentrifugation, and the morphology and sizes distribution of sEVs were evaluated by transmission electron microscopy (TEM) and NTA. TEM and NTA analysis showed that sEVs were oval or bowl-shaped with a size range between 80 and 200 nm (Figure 2A,B). Moreover, sEV markers CD9, TSG101 and HSP70 were all detected in the sEVs isolated from the serum (Figure 1C). On the contrary, calnexin, a negative marker of sEVs, was not detectable in our isolated sEVs-enriched fraction samples (Figure 2C). Besides, the protein levels of the sEVs-enriched fraction samples were also evaluated, and an sEV-associated protein concentration of 238.471 μg/mL serum was reported. Total RNA isolated from sEVs-enriched fractions was analysed and quantitated. No significant difference was identified in the RNA concentration of sEVs-enriched fractions (ng/mL plasma) between ISH patients and controls (Figure 2D).
3.3 Comparison of serum exosome-derived microRNAs (sE-miRNAs) signatures between ISH patients and non-ISH controls in the discovery cohort
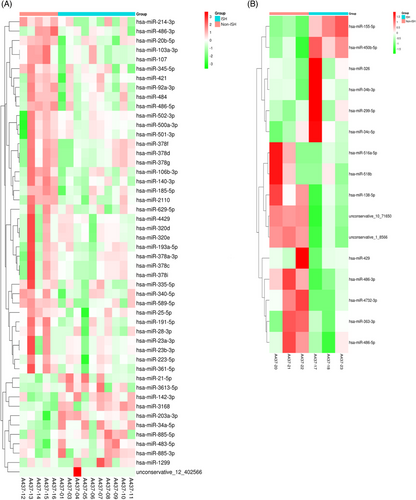
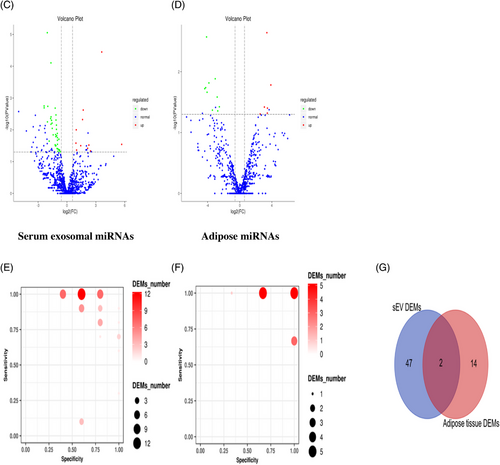
To get a global profile of the sEVs-enriched fraction-derived miRNA from the ISH patients, we first tested 15 samples (10 ISH patients and 5 controls) in the testing set by miRNA sequencing. For each sample, no less than 6.17 M clean reads were generated. A total of 1220 out of 1500 known miRNAs were detected by sequencing. A total of 276 miRNAs with median TPM >10 were included for the subsequent analysis, so as to avoid bias caused by miRNAs with relatively low expression levels. In differentially expressing miRNA (DEMs) analysis (|log2(FC)| >0.585, p < .05), 11 miRNAs were found up-regulated (with 1 unknown miRNA), and 38 down-regulated in ISH patients than controls with 1 unknown miRNA. Perform hierarchical clustering analysis on the screened differentially expressed miRNAs, and the clustering results are shown in Figure 3A (serum). The difference in the expression levels of miRNAs in two group samples and the statistical significance can be viewed through the volcano plot (Figure 3B, serum). We calculated the specificity and sensitivity of each DEM in the testing set (Figure 3C, serum). Most candidate miRNAs displayed a specificity of 0.6–1.0 and a sensitivity of 0.8–1.0 (Table 2).
| #ID | p-Value | Log2FC | Sensitivity | Specificity | Sen × Spec |
|---|---|---|---|---|---|
| hsa-miR-20b-5p | 1.534E − 02 | −1.0617 | 1 | 0.8 | 0.8 |
| hsa-miR-140-3p | 7.858E − 05 | −1.6622 | 1 | 0.8 | 0.8 |
| hsa-miR-185-5p | 4.922E- − 03 | −1.1396 | 1 | 0.8 | 0.8 |
| hsa-miR-486-5p | 9.674E − 03 | −1.0909 | 1 | 0.8 | 0.8 |
| hsa-miR-2110 | 7.124E − 03 | −1.0911 | 1 | 0.8 | 0.8 |
| hsa-miR-500a-3p | 5.023E − 03 | −1.6045 | 1 | 0.8 | 0.8 |
| hsa-miR-142-3p | 9.995E − 03 | 0.9660 | 0.9 | 0.8 | 0.72 |
| hsa-miR-484 | 2.860E − 02 | −0.9871 | 0.9 | 0.8 | 0.72 |
| hsa-miR-21-5p | 2.622E − 02 | 0.9336 | 0.8 | 0.8 | 0.64 |
| hsa-miR-335-5p | 1.297E − 02 | −0.9996 | 0.8 | 0.8 | 0.64 |
| hsa-miR-3613-5p | 4.345E − 02 | 1.0002 | 0.8 | 0.8 | 0.64 |
| hsa-miR-103a-3p | 1.970E − 02 | −0.8379 | 1 | 0.6 | 0.6 |
| hsa-miR-107 | 1.989E − 02 | −0.8378 | 1 | 0.6 | 0.6 |
| hsa-miR-203a-3p | 4.750E − 03 | 1.6204 | 1 | 0.6 | 0.6 |
| hsa-miR-361-5p | 8.833E − 06 | −2.0405 | 1 | 0.6 | 0.6 |
| hsa-miR-92a-3p | 4.905E − 02 | −0.6964 | 1 | 0.6 | 0.6 |
| hsa-miR-106b-3p | 2.075E − 03 | −1.2227 | 1 | 0.6 | 0.6 |
| hsa-miR-501-3p | 4.424E − 03 | −1.6974 | 1 | 0.6 | 0.6 |
| hsa-miR-486-3p | 1.764E − 02 | −0.9894 | 1 | 0.6 | 0.6 |
| hsa-miR-483-5p | 3.166E − 02 | 1.4324 | 0.9 | 0.6 | 0.54 |
| hsa-miR-191-5p | 3.406E − 03 | −1.1420 | 1 | 0.4 | 0.4 |
| hsa-miR-28-3p | 4.173E − 02 | −0.8461 | 1 | 0.4 | 0.4 |
We further collected adipose tissue from severe infection stress hyperglycaemia (ISH) patients who underwent limb amputation surgery. Based on microarray miRNAs gene chip analysis, we analysed the differentially expressed microRNAs profiles in adipose tissue from severe infection amputation-induced hyperglycaemia patients (n = 3) and adipose tissue from the control group, who received hip replacement surgery with normoglycaemic (n = 3). Small RNA sequencing of 6 samples was completed, and 1293 miRNAs were detected, including 1250 known miRNAs and 43 newly predicted miRNAs. Through quality control, the average Clean Data per sample is 15.09 M. A total number of 16 DEMs were detected, of which 6 miRNAs were found up-regulated, and 10 down-regulated (with 2 unknown miRNAs) in ISH patients when compared with controls. The clustering results of differentially expressed miRNAs are shown in Figure 3A (adipose). The difference in the expression levels of two groups miRNAs can be found in the volcano plot (Figure 3B, adipose). We also calculated the specificity and sensitivity of each DEM in the testing set (Figure 3C, adipose).Compared with differentially expressed miRNAs from fat tissue data, there were 2 DEMs (2/49) shared between those two analyses, both are down-regulated (Figure 3D), indicating hsa-mir-486-5p and hsa-mir-486-3p, indicating that they may derive from fat tissue (Figure S1A).
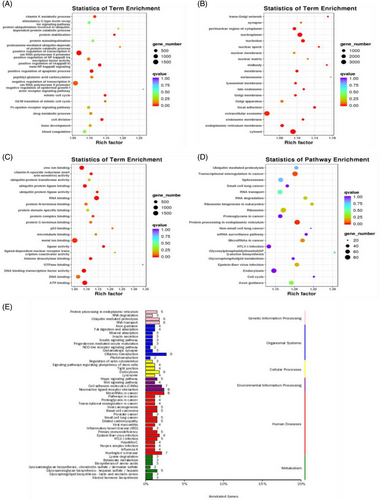
Additionally, in an attempt to reveal the potential function of the serum exosomal miRNAs that were showed up-/down-regulated in ISH patients, we analysed the potential impact of those miRNAs on protein-coding mRNAs. Bioinformatics miRNA target database analysis revealed that 17683 mRNAs were targeted by those DEMs, which were selectively enriched in insulin signalling pathway, insulin secretion, protein procession in endoplasmic reticulum, primary immunodeficiency, fat digestion and absortion pathways, endocytosis, lysosome, cell adhesion molecules (7) (Figure 4A–E). Adipose tissue's bioinformatics miRNA target database analysis results are shown in Figure S2A–D.
3.4 EV-associated characteristic verification of candidate miRNAs
Among all DEMs, we selected 7 out of 22 miRNAs that with abundant and stable expression for further validation based on previous literature review and the verification of their EV-associated characteristics. Namely, hsa-miR-140-3p, hsa-miR-486-5p, hsa-miR-21-5p, hsa-miR-335-5p, hsa-miR-28-3p, hsa-miR-191-5p and hsa-miR-28-3p were previously reported existing in diabetes and obesity-related diseases and functioning in inflammation and glucose metabolism regulation pathway (Table 3).
| #ID | NC. Ave |
NC. Median |
AB.Ave |
AB. Median |
p-Value | Log2FC | SN | SP | AUC | SN × SP |
Disease _name |
PMID |
|---|---|---|---|---|---|---|---|---|---|---|---|---|
| hsa-miR-140-3p | 861.18 | 708.48 | 256.92 | 240.64 | 7.86E − 05 | −1.66217 | 1 | 0.8 | 0.9 | 0.8 | Heart diseases | 30308506 |
| hsa-miR-486-5p | 62633.51 | 67602.06 | 30064.96 | 26739.27 | .009673 | −1.09094 | 1 | 0.8 | 0.88 | 0.8 | N/A | N/A |
| hsa-miR-21-5p | 3432.94 | 3690.4 | 6091.24 | 4652.95 | .026216 | 0.933574 | 0.8 | 0.8 | 0.82 | 0.64 | T2DM | 20651284 |
| hsa-miR-335-5p | 259.34 | 184.97 | 118.83 | 99.53 | .012969 | −0.99962 | 0.8 | 0.8 | 0.82 | 0.64 | Obesity | 26223376 |
| hsa-miR-486-3p | 188.46 | 218.95 | 101.78 | 105.01 | .017635 | −0.98935 | 1 | 0.6 | 0.7 | 0.6 | N/A | N/A |
| hsa-miR-191-5p | 5532.41 | 3624.58 | 2341.58 | 2088.66 | .003405 | −1.14197 | 1 | 0.4 | 0.82 | 0.4 | T2DM | 20651284 |
| hsa-miR-28-3p | 176.63 | 112.78 | 92.63 | 77.16 | .041728 | −0.84606 | 1 | 0.4 | 0.74 | 0.4 | Immunodeficiency | 21224041 |
3.5 sE-miRNAs as biomarkers of ISH patient in a validation set
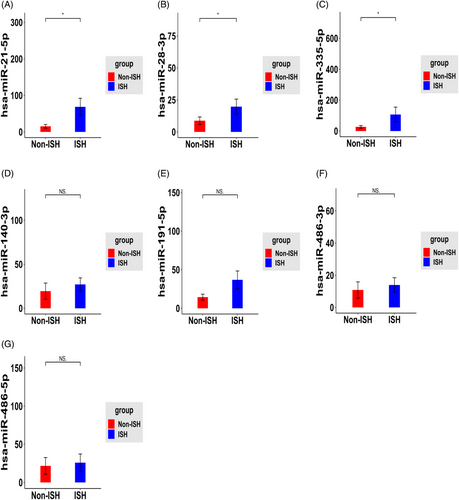
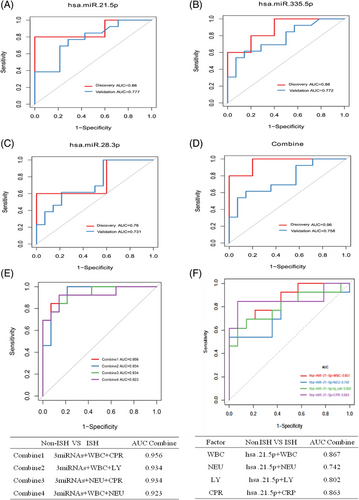
To validate the specificity of these seven sE-miRNAs for ISH patients found in the discovery set, expressions of these seven miRNAs were measured by RT-qPCR in the validation set of 52 subjects. Primers’ design was summarized in Table S1. As shown in Figure 5, hsa-miR-21-5p, hsa-miR-335-5p and hsa-miR-28-3p were showed significant up-regulated in serum exosome from ISH patients group by using U6 as an internal calibration when compared with control groups (Figure 5). To verify the potential of miRNA expression, ROC analysis was performed, and AUC (Area Under Curve) was calculated both in discovery and validation set.
Hsa-miR-28-3p, hsa-miR-335-5p and hsa-miR-21-5p exhibited an AUC of 0.76, 0.88 and 0.88 close to the AUC (0.90) calculated from the discovery set (Figure 6A–C). On the other hand, in the validation set, these three miRNAs achieved an AUC of 0.731, 0.772 and 0.777, respectively, which were lower than the AUC calculated from the discovery set (Figure 6A–C). However, integrating three candidate miRNAs could achieve a higher AUC of 0.96 in discovery set, whereas these are limited improvements in validation set with AUC of 0.758 (Figure 6D). Additionally, by using a logistic model, we combined all those candidate miRNAs together with clinical examination index and obtained much improved performance compared with single individual miRNA. Notably, three miRNAs plus WBC and CPR exhibited an AUC of 0.956 (Figure 6E), and hsa-miR-21-5p alone plus WBC or CRP exhibited an AUC of 0.86 (Figure 6F). In summary, three miRNAs, especially hsa-miR-21-5p, provided promising AUC values for discriminating between ISH patients from controls.
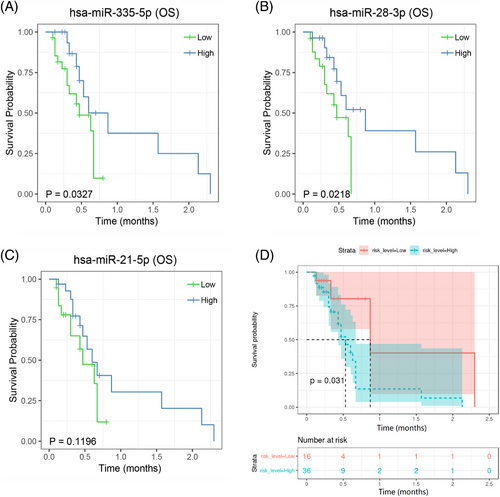
To assess the clinical significance of miRNA expression, an ISH survival assay was performed on the validation cohort of 52 patients. Kaplan–Meier analysis showed that patients with high two miRNAs (hsa-miR-28-3p and hsa-miR-335-5p) expression in their serum exosomes had significantly shorter survival than patients with low miRNA expression did (Figure 7A,B). But not for hsa-miR-21-5p (Figure 7C), which indicating that hsa-miR-28-3p and hsa-miR-335-5p may take considerable responsibility for patients’ poor clinical outcome. Combined three miRNAs together still showed significantly shorter survival when compared to patients with low miRNAs expression (Figure 7D).
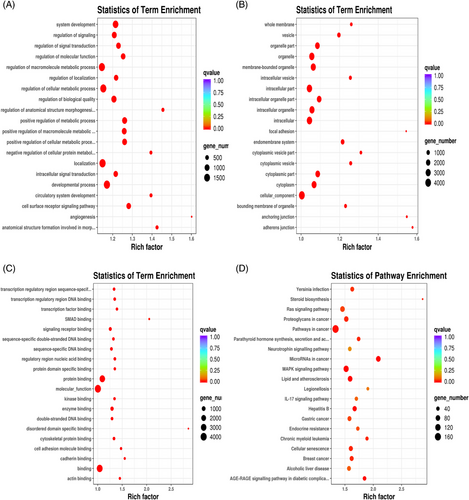
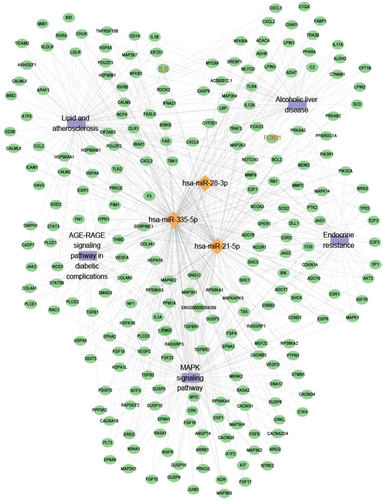
Bioinformatics miRNA target database (multiMIR) analysis revealed that 4618 mRNAs were targeted by hsa-miR-28-3p, hsa-miR-335-5p and hsa-miR-21-5p, which were selectively enriched in signals of MAPK signalling pathway, endocrine resistance, lipid and atherosclerosis, AGE-RAGE signalling pathway in diabetic complication, metabolic process as well as protein binding or molecular function (Figures 8 and 9).
In conclusion, our study suggested that ISH patients retained specific serum exosome-derived miRNAs profile compared with non-ISH patients. Our study depicted the circulating exosomal miRNAs change in ISH patient, which could be used as a promising biomarker to detect ISH at an early stage and predict patients’ clinical outcome. Of which hsa-miR-21-5p proposed a new promising biomarker category of ISH patients, whereas hsa-miR-28-3p and hsa-miR-335-5p play an important role on patients’ poor clinical outcome.
4 DISCUSSION
Claude Bernard first proposed the concept of SHG in 1877,38 and stress hyperglycaemia usually refers to transient hyperglycaemia during illness and is generally restricted to patients without previous evidence of diabetes.3 However, both physical and psychological stimulation factors are able to cause stress state, and the identification of such patients is complex. No guidelines so far specifically define stress hyperglycaemia. According to American Diabetes Association (ADA)39 and Lancet paper on stress hyperglycaemia review,3 we propose two diagnostic categories of stress hyperglycaemia according to the ADA consensus definition (fasting glucose >7 mmol/L or random glucose >11·1 mmol/L without evidence of previous diabetes) and pre-existing diabetes with the deterioration of preillness glycaemic control. So stress hyperglycaemia was supposed to be diagnosed when peripheral blood sugar is higher than the diagnostic criteria irrespective of whether a patient has pre-existing diabetes or not.3
Stress hyperglycaemia remains a major health emergency issue in our clinical practice especially in-hospital ICU, affecting hundreds of millions of people worldwide.40 It is reported that infection such as COVID-19 significantly increased rate of new-onset hyperglycaemia. Surprisingly, 46% of COVID-19 patients showed hyperglycaemia during hospitalization.10 Among patients who exhibited new-onset hyperglycaemia at hospital admission for COVID-19, persistent hyperglycaemia continued to be observed in the following 6 months in nearly 35% of patients, and 2% of patients were finally diagnosed. Moreover, studies using primary human islets demonstrated that pancreatic β cells are highly permissive to SARS-CoV-2 infection through ACE2. Interestingly, COVID-19 also induces a cytokine storm, an exaggerated immune response with a broad spectrum of cytokine production that establishes a systemic proinflammatory milieu, which may eventually lead to IR and β cell hyperstimulation and death.10 COVID-19 infection may also enhance the pre-existing proinflammatory status observed in type 2 diabetes, thus worsening patient survival and complications. In conjunction with its much-dreaded complications (e.g. sepsis and septic shock), it substantially reduces the quality of life, increases mortality as well as medical burden among patients.41 Over the years, oxidative stress and inflammation have been highlighted as key players in the development and progression of stress hyperglycaemia and its associated complications.42, 43 However, the underlying mechanism for stress hyperglycaemia caused by the most common reason, infection in particular, remains unknown.
Infection leads to profound alterations in whole-body metabolism, which is characterized by the marked acceleration of glucose, fat and protein. The hyperglycaemia is generally caused by peripheral IR and alterations in hepatic glucose metabolism. MiRNAs of serum exosomes have emerged as biomarkers for many diseases, due to their high stability.22 MiRNAs have been linked to factors associated with inflammation disorder44 and glucose metabolism disfunction45, 46 especially under stress condition. In this study, we aimed to identify serum exosomal miRNAs as prognostic markers associated with inflammation-related stress hyperglycaemia (ISH) in aged hospitalized patients. Exosomal miRNAs might serve as endocrine and paracrine messengers that facilitate communication between donor cells and tissues with receptor cells or target tissues, thereby potentially having important roles in metabolic organ-cross-talk. In our study, we focus primarily on alterations in whole-body metabolic response to inflammatory stress, and the interactions between the endocrine response to infection and serum exosomal miRNAs change.
Here in our study, RNA sequencing identified a total number of 49 serum exosomal-derived miRNAs with differential expression between ISH and control group in discovery set. Furthermore, compared with differentially expressed miRNAs from adipose tissue data and serum exosome, there were two DEMs (2/49) shared the same pattern, both are down-regulated (Figure 3D), indicating that hsa-mir-486-5p and hsa-mir-486-3p may derive from adipose tissue (AT). Adipose tissue-derived exosomal miRNAs play an important role in glucose metabolism. Carlos Castaño47 found that obesity changes the miRNA profile of plasma exosomes in mice, including increases in miR-122, miR-192, miR-27a-3p and miR-27b-3p. Importantly, treatments of lean mice with exosomes isolated from obese mice cause glucose intolerance and IR. Riccarda Granata48 observed differential expression of miRNAs in extracellular vesicles (Evs) from healthy and inflamed adipocytes (AT), as well as alteration in signalling pathways and expression of β cell genes, adipokines and cytokines in recipient β cells. Their in vitro results suggest that adipocyte-derived EVs may influence β cell fate and function. As for our study, both miR-486-3p and miR-486-5p, unexpectedly, had no statistical difference in the clinical validation (Figure 5F,G), indicating that they may not play a key role in the pathogenesis of ISH. On the other hand, tissue in situ exosome49, 50 instead of total organ should also be taken into consideration for exosome origin verification, but due to clinical sampling and ethical restrictions, more systematic and in-depth tracer experiments are needed in the future.
Moreover, 49 DEMs, including hsa-mir-486-5p, hsa-hsa-mir-486-3p, hsa-hsa-miR-140-3p, hsa-hsa-miR-21-5p, hsa-hsa-miR-335-5p, hsa-hsa-miR-191-5p and hsa-hsa-miR-28-3p, in particularly, were finally selected for clinical large sample validation based on literature review, which were related to glucose metabolism and inflammatory dysfunction. Three miRNAs, including hsa-hsa-miR-21-5p, hsa-hsa-miR-335-5p and hsa-hsa-miR-28-3p, were showed significantly up-regulated in ISH group when compared with control in validation set. As there are gender differences in the baseline data between the two groups, which may act as a confounding factor, for the sake of rigor, we re-examined our data to confirm that whether sex alone or itself can cause differences in miRNA expression or not. It showed that there was no statistical difference between males and females patients when it came to these three miRNAs (Figure S3), indicating that these three miRNAs indeed play a certain role in stress hyperglycaemia regardless of sex.
Literature reviews of these three miRNAs function are summarized as follows. Qin51 provided evidence that miR-335-5p enhanced IR through VASH1-mediated TGF-β signalling pathway in gestational diabetes mellitus (GDM) mice, which provides more clinical insight on the GDM treatment. Another findings provided evidence that miR-335-5p aggravates type 2 diabetes by inhibiting SLC2A4 expression, and miR-335-5p and SLC2A4 as potentially effective therapeutic targets for patients with T2DM.52 Moreover, hsa-miR-335-5p appeared to be involved in T2DM by potentially regulating the expression of various candidate genes, including procollagen C-endopeptidase enhancer 2, connective tissue growth factor and family, which might also be used in the molecular diagnosis and targeted therapy of T2DM.53 Eliasson54 reported that the expression of miR-335 negatively correlated with secretion index in human islets of individuals with prediabetes. Overexpression of miR-335 in human EndoC-βH1 and in rat INS-1 832/13 cells (OE335) resulted in decreased glucose-stimulated insulin secretion. As for miR-21-5p and miR-28-3p research, Abulsoud55 found that serum levels of miR-148a-5p and miR-21-5p were higher in metabolic syndrome (MetS) patients than in healthy controls; consequently, these serum miRs can serve as novel biomarkers for diagnosis and prognosis of MetS. Xia56 found that miR-21 is down-regulated in the serum and placenta of GDM patients compared to normal pregnant women. In the case of IR, miR-21-5p knock-down promoted glucose uptake, but no significant effect was found under physiological condition. Syhan’ study57 had measured the circulating levels of cytokines and miRNAs in lean and obese humans with prediabetes. The result reveals that a number of circulating cytokines and miRNAs deregulated in subjects with obesity, prediabetes and T2DM. Specifically, cytokines IL-6, IL-8, IL-10, IL-12 and SFRP4, as well as miRNAs miR-21, miR-28-3p, miR-150, miR-155 and miR-223, significantly changed across the diabetes spectrum and were associated with measures of pancreatic islet β cell function and glycaemic control, and their data suggested that changes in circulating miRNAs and cytokines may have clinical utility as biomarkers of prediabetes. CORDIOPREV study58 showed that patients with low levels of miR-29a, miR-28-3p and miR-126 and high plasma levels of miR-150 at baseline showed a higher risk of developing T2DM after the consumption of the Med diet.
Combined with previous literature reports and our research, hsa-miR-28-3p, hsa-miR-335-5p and hsa-miR-21-5p play an important role in both glucose metabolism and inflammation-related diseases. It is worth mentioning that miRNAs which are able to master (NF-κB)-driven inflammatory pathways were called inflammamiRs.59 Relevant evidence suggesting that circulating inflammamiRs, along with IL-6, can measure the degree of inflammaging.60
Previous study had showed that interleukin-6 (IL-6) is necessary for stress hyperglycaemia,10 which mediates metabolic reprogramming behaviour of hyperglycaemia under acute stress.61 Stress-inducible IL-6 is produced from brown adipocytes in a beta-3-adrenergic-receptor-dependent fashion. During stress, endocrine IL-6 is the required instructive signal for mediating hyperglycaemia through hepatic gluconeogenesis, so as to anticipate and fuel ‘fight or flight’ responses.61 This adaptation comes at the cost of increasing mortality to a subsequent inflammatory challenge. These findings provide a mechanistic understanding of the adaptive purpose of IL-6 as a stress hormone coordinating systemic immunometabolic reprogramming.
Moreover, our supplementary data also show that there was a significant correlation between IL-6 level and blood glucose on ISH patients (Figure S4A). Moreover, when we tracked and monitored continuously in one of the patients, we found that glycaemia levels fluctuate in sync with IL-6 levels (Figure S4B). The results further suggested that stress induced IL-6 is important for hyperglycaemia. However, the underlying mechanism for stress induced IL-6-related hyperglycaemia remains unclear.
Previous study implicated that forkhead box protein O (FOXO) transcription factors in the liver were crucial in stress-induced hyperglycaemia,which acted as promoters of altered glucose homeostasis.62 Specifically, FOXO activity was found up-regulated in stress-induced hyperglycaemia, and loss function of FOXO, including subtype of FOXO1, 3 and 4, in the liver attenuated hyperglycaemia and alleviated hyperinsulinemia, which ameliorated insulin sensitivity.63, 64
Mechanistically, the loss of FOXO transcription factors mitigated the stress-induced hyperglycaemia response by suppressing lipolysis in adipose tissue indirectly and altering gene expression and glycogenolysis in the liver directly. It is worth noting that reductions were associated with decreased IL-6, TNF-α and increased FGF21, suggesting that cytokines (such as IL-6) and FOXO-regulated hepatokines contribute to the stress-induced hyperglycaemia response.62
Here, we further used sequence alignment analysis to predict the target genes of these three miRNAs, and it was very exciting to found that both hsa-miR-335-5p and hsa-miR-21-5p had several conserved binding sites with 3′UTR of IL-6 or the FOXO1 (forkhead box O1) (Figure S4C), which implicated that hsa-miR-335-5p and hsa-miR-21-5p may excert effect on transcriptional level on IL-6 or FOXO, both of which were acted as a predominant driver of stress-induced hyperglycaemia through means that include cross-talk between the liver and adipose, highlighting a novel mechanism underlying acute hyperglycaemia and IR in stress.
In summary, our multi-level analyses uncovered and identified three miRNAs that were up-regulated in ISH which may serve as biomarker for stress hyperglycaemia and as key orchestrators promoting aggressiveness in ISH. In particularly, serum exosomal hsa-miR-21-5p might relate to poor clinical outcome, and patients with high expression may deteriorate to septic shock. Further research is needed on the biological functions and mechanisms of these miRNAs and their function on mediating the IR during infection stress-induced hyperglycaemia. Moreover, few therapeutic options currently exist to treat ISH safely so far,65 and these three miRNAs may serve as potential therapeutic targets and offer substantial promise in expanding treatment options for patients with ISH. Finally, more research is needed to translate these findings into a human clinical practice.
AUTHOR CONTRIBUTIONS
K.Z. and J.T. as well as G.X.designed the whole project, K.Z. and Z.L.with H.H.aided in conceiving the hypothesis, designed and performed the experiments, analyzed the data, and prepared the manuscript. G.W., Y.S.K., contributed to the analysis and discussion as well as language polishment. This work was also partially supported by M.L., W.W., H.S., H.L., B.C. for sample collection, clinical data analysis as well as data presentation.
ACKNOWLEDGEMENTS
We are grateful to Dr. Jin, Tianru from University of Toronto Banting and Best Diabetes Research Center (BBDC) and Dr. Xu, aimin from University of Hong Kong for their consultation. Our work was also performed under the technical support by EchoBiotech Co., Ltd., Beijing, China. This work was supported by grants from the National Natural Science Foundation of China (81902004, 52203206) and Basic and Applied Basic Research Foundation of Guangdong Province (2023A1515012575, 2023A1515012193) to K.Z and H.H.; Medical research project of Foshan Health Bureau (20210072) to Z.L.; National Key-Area Research and Development Program of China (2021YFC2009400) to J.T.; Basic and Applied Basic Research Foundation of Guangdong Province (2021A1515110091) and Natural Science Foundation of Shenzhen Municipality (JCYJ20220530144605012) to H.H.
CONFLICT OF INTEREST STATEMENT
No potential conflict of interest was reported by the authors.
ETHICS APPROVAL
This study was approved by the ethics committee of Sun Yat-sen Memorial Hospital of Sun Yat-sen University (Ethical approval SYSEC-KY-KS-2021-189).


