Pax3 overexpression induces cell aggregation and perturbs commissural axon projection during embryonic spinal cord development
Funding information: Institute of Anatomy I, Jena University Hospital, Germany; National Natural Science Foundation of China; 31440049; Science and Technology Innovation Talents Support Program of Henan Universities; 14HASTIT032, 162300410134.
Abstract
Pax3 is a transcription factor that belongs to the paired box family. In the developing spinal cord it is expressed in the dorsal commissural neurons, which project ascending axons contralaterally to form proper spinal cord–brain circuitry. While it has been shown that Pax3 induces cell aggregation in vitro, little is known about the role of Pax3 in cell aggregation and spinal circuit formation in vivo. We have reported that Pax3 is involved in neuron differentiation and that its overexpression induces ectopic cadherin-7 expression. In this study we report that Pax3 overexpression also induces cell aggregation in vivo. Tissue sections and open book preparations revealed that Pax3 overexpression prevents commissural axons from projecting to the contralateral side of the spinal cord. Cells overexpressing Pax3 aggregated in cell clusters that contained shortened neurites with perturbed axon growth and elongation. Pax3-specific shRNA partially rescued the morphological change induced by Pax3 overexpression in vivo. Our results indicate that the normal expression of Pax3 is necessary for proper axonal pathway finding and commissural axon projection. In conclusion, Pax3 regulates neural circuit formation during embryonic development. J. Comp. Neurol. 525:1618–1632, 2017. © 2016 Wiley Periodicals, Inc.
Vertebrate Pax transcription factors (proteins containing a DNA-binding motif termed the paired box) act as regulators of pattern formation and play essential roles during early development and organogenesis. The functions of different Pax genes are largely conserved throughout vertebrate evolution (Monsoro-Burq, 2015). Pax genes are required for orchestrating proper morphological development of various tissues and organs, as demonstrated by the analysis of the wildtype or targeted mutations of these genes (Dahl et al., 1997; Wiggan et al., 2002). Pax3 is a member of the Pax subfamily that is expressed in various tissues during embryogenesis; its role is particularly well investigated during embryonic myogenesis (Daston et al., 1996; Galli et al., 2008; Joven et al., 2013; Zalc et al., 2015). Moreover, it has been shown that mouse inner ear components with melanogenic fates require Pax3 function (Kim et al., 2014). Pax3 protein is involved in regulating cell aggregation and mesenchymal condensation in vitro (Wiggan et al., 2002). Together with Endoglin, Pax3 plays a role in embryonic angiogenesis (Young et al., 2016). Pax3 mutations in the human are associated with Waardenburg syndrome (type I and type III; Borycki et al., 1999). Pax3 regulates the expression of glial fibrillary acidic protein (GFAP) in the brain glioma stem cells and affects their proliferation and differentiation (Su et al., 2016). In the nervous system, Pax3 regulates the patterning and differentiation of the dorsal neural tube and neural crest (Degenhardt et al., 2010; Monsoro-Burq, 2015).
In the early neural tube, Pax3 and its homolog Pax7 are expressed in its dorsal part, i.e., in the alar plate. Later in development, Pax3 becomes more broadly expressed in the brain and spinal cord (Goulding et al., 1991; Agoston et al., 2012). Pax3-mutant mice are characterized by exencephaly, defects in myogenesis, and abnormal differentiation of neural crest cells (Epstein et al., 1991; Conway et al., 1997). Double mutations for Pax3 and Pax7 cause severe exencephaly and spina bifida, as well as defects in spinal commissural neurons (Mansouri and Gruss, 1998). In the developing chicken, Pax3 and Pax7 both are involved in the expression regulation of Meis homebox 2 (Meis2) in the dorsal mesencephalic vesicle (Agoston et al., 2012). Pax3 activity is regulated by hippo signaling in premigratory neural crest cells (Manderfield et al., 2014), and it cooperates with Zic1 to induce neural crest development and differentiation (Milet et al., 2013). Ectopic Pax3 expression in osteogenic Saos-2 cells results in the formation of cell aggregation with epithelial characteristics (Wiggan et al., 2002). We have reported that Pax3 is involved in neuron differentiation and its overexpression induces ectopic expression of cadherin-7 (Lin et al., 2016). We also observed that the axons in Pax3-overexpressing regions seem abnormal and do not project properly compared to the wildtype (Lin et al., 2016).
Spinal commissural neurons are a major class of projection neurons that are located within a dorsal region (dI1 and dI2) of the developing spinal cord (Imondi and Kaprielian, 2001); they stereotypically extend axons ventrally in parallel to the lateral edge of the spinal cord, and then grow ventromedially toward the floor plate when reaching the motor neuron column (Bovolenta and Dodd, 1990). After crossing the midline (floor plate) and entering the marginal zone, they are arranged within highly organized longitudinal tracts to project to distinct targets, thus establishing connections between the two symmetric halves of the nervous system (Imondi and Kaprielian, 2001; Arakawa et al., 2008; Sakai and Kaprielian, 2012). Both Pax3 and Pax7 are expressed in the dI1 and dI2 commissural neurons (Lin et al., 2016). However, it is unknown how Pax3 contributes to spinal pattern formation and the axonal projections of commissural neurons in the developing spinal cord.
In the present study, we changed the expression of Pax3 in the developing spinal cord and found that Pax3 overexpression induced cell aggregation in vivo. Pax3 overexpression also perturbed the contralateral projection of commissural axons. Thus, cells overexpressing Pax3 did not extend their axons into the proper pathway. Knocking down of Pax3 with specific shRNA did not significantly induce cell aggregation or grossly abnormal axon projections. We were able to rescue the morphological change that results from Pax3 overexpression by Pax3 shRNA. Our results suggest that normal expression of Pax3 is necessary for proper axon pathway finding and commissural axon projection. We conclude that Pax3 is involved in the spinal cord morphogenesis and spinal–brain circuit formation during nervous system development.
Materials and methods
Eggs and embryos
The animal experiments were performed according to the National Institutes of Health Guide for the Care and Use of Laboratory Animals and similar institutional regulations of Jena University Hospital. Experiments were designed to minimize the number of embryos used and their suffering.
For the experiments, we obtained fertilized eggs of White Leghorn chicken (Gallus gallus) from a local farm. Eggs were incubated in a forced-draft incubator (Ehret, Emmendingen, Germany) at 65% humidity and 37.5°C. The in ovo electroporation procedure (see below) was performed with eggs at 2–2.5 days of incubation (E2–E2.5; stages 12–16, according to Hamburger and Hamilton, 1951). We collected the GFP-positive embryos at about E2.75 (E2.5 + 6h, stage 19), E3 (E2.5 + 12h, stage 20), E3.25 (E2.5 + 18h, stage 21), E3.5 (E2.5–3.5 or E2.5 + 1d, stage 22), E4 (E2.5–4 or E2.5 + 1.5d, stage 24), E4.5 (E2.5–4.5 or E2.5 + 2d, stage 25), E5 (E2.5–5 or E2.5 + 2.5d, stage 26), E6 (E2.5–6 or E2.5 + 3.5d, stage 28), or E7 (E2.5–7 or E2.5 + 4.5d, stage 31), and fixed them in 4% formaldehyde (FA) on ice overnight. At each stage, at least five embryos were examined. Following fixation, the specimens were immersed in HEPES-buffered salt solution (18% sucrose). To embed the specimens, we used TissueTec O.C.T. compound (Science Services, München, Germany). Specimens were frozen in liquid nitrogen and stored at −80°C, as described by Lin et al. (2008, 2016).
In ovo electroporation
Developing chicken embryos were electroporated in ovo at E2 (stage 12) to E4 (stage 24), as described (Luo et al., 2006). In brief, capillary glass pipettes were pulled on a microelectrode puller (PUL-100 Micropipette Puller, WPI, Berlin, Germany) from glass tubes of 1.0 mm diameter (TW100F-4, WPI). For plasmid injection, they were used through a mouthpiece (A5177, Sigma, St. Louis, MO). Solution that contained pCAGGS-GFP plasmid (at a final concentration of 0.5 μg/μl) served as a control. Pax3 expression vector was a kind gift from Dr. Dorothea Schulte (Max Planck Institute for Brain Research, Frankfurt, Germany). pGPU6-GFP-neo-Pax3-shRNA (plasmid-based shRNA) was purchased from Kangwei (Abgent, Jiangsu, China). The shRNA sequence specific for Pax3 was GAAGCTCGAGTTCAGGTTTG. To visualize the injection site, we added Fast Green (0.1%, Sigma) to the solution. Immediately after injection, the electrodes for in ovo electroporation (CUY 610-P2.5, NepaGene, Chiba, Japan) were placed at the lumbar level on both sides of the embryo and electric pulses of 18V (six pulses, 60 ms pulse length, 100 ms intervals in each case) were applied with an electroporator (CUY 21, NepaGene). GFP expression in the embryos was visualized under a fluorescence stereomicroscope (Leica MZFLIII, Bensheim, Germany). We selected successfully transfected embryos 6 hours (h), 12h, 18h, 1 day (d), 1.5d, 2d, 3d, and 4d after electroporation.
Spinal cord open-book preparations
We prepared open-book preparations of whole-mount chicken spinal cord. At stages earlier than E4, GFP-positive embryos were obtained at 6h, 12h, 18h, and 1d after electroporation. After isolating the spinal cords, we slit them along the dorsal roof and spread them onto glass slides for direct exploration. For photography, the spread spinal cords were covered with a glass slide.
For embryos at E4 and later, the spinal cord open-book preparation was carried out following the protocol by Avraham et al. (2010). Briefly, the candidate embryo was fastened with pins on a prepared Petri dish coated with glass cement. Next, a longitudinal incision was made along the roof plate and both sides of the spinal cord from hindbrain to the tail, and the floor plate was detached from the tissue carefully. Then the spinal cord was cut transversally at the hindbrain to separate it from the body. The separated spinal cord was transferred into another dish with 4% paraformaldehyde (PFA), and held with pins. After incubating at room temperature for 1 hour, phosphate-buffered saline (PBS) was used to wash the spinal cord 3 times for 5 minutes each. Finally, the spinal cord was transferred in a square made with nail polish on a slide. One to two drops of mounting media were added to the embryo before covering it with coverslip. The slides were kept in the dark at 4°C.
In situ hybridization
Digoxigenin-labeled sense and antisense cRNA probes for chicken Pax3 (Lin et al., 2012, 2016) and 12 members of chicken classic cadherins were synthesized in vitro with T7 and SP6 RNA polymerases, according to the manufacturer's instructions (Roche, Mannheim, Germany) and depending on the direction of the insert in the plasmid. The sequences and probe synthesis information for chicken N-cadherin (Ncdh), R-cadherin (Rcdh), Cadherin-6 (Cdh6), Cadherin-7 (Cdh7), Cadherin-8 (Cdh8), Cadherin-9 (Cdh9), Cadherin-10 (Cdh10), Cadherin-11 (Cdh11), Cadherin-12 (Cdh12), Cadherin-18 (Cdh18), Cadherin-19 (Cdh19), and Cadherin-20 (Cdh20) were provided in our previous publications (Lin et al., 2010, 2014, 2016). A sense probe served as a negative control. For in situ hybridization, we obtained 18–20 μm-thick transverse cryostat sections. The in situ hybridization procedure was modified after the protocol by Lin et al. (2010). After in situ hybridization, we counterstained some sections with dye Hoechst 33258 (Molecular Probes, Eugene, OR) to visualize the cell nuclei.
Immunostaining
Cryostat sections adjacent to those used for in situ hybridization were immunostained, as described (Luo and Redies, 2004). Briefly, sections were postfixed for 30 minutes in 4% FA dissolved in ice-cold Hepes-buffered salt solution (140 mM NaCl, 5 mM KCl, 100 mM Hepes, 5 mM glucose, 0.4 mM Na2HPO4, and 0.04 mM phenol red, supplemented with 1 mM MgCl2 and 1 mM CaCl2, pH7.4; all reagents from Merck, Darmstadt, Germany). The sections were then washed in Tris-buffered saline (TBS; 150 mM NaCl, 500 mM Tris, pH 7.4, 1 mM CaCl2 and MgCl2) and preincubated in blocking solution (TBS, 5% skimmed milk powder, 0.3% Triton X-100) for 60 minutes at room temperature followed by washing. We applied primary antibody overnight at 4°C, and incubated with appropriate Cy3-labeled secondary antibodies (Jackson ImmunoResearch, West Grove, PA) for 60 minutes at room temperature. Cell nuclei were visualized with dye Hoechst 33258.
Mouse monoclonal antibody against Pax3 was obtained from the Developmental Studies Hybridoma Bank (cat. no. pax3, RRID:AB_528426; generated by Dr. Charles P. Ordahl [Williams and Ordahl, 1994]). To generate this antibody, the cDNA region that corresponded to amino acids 298–481 of the C-terminal region of quail Pax3 was cloned by polymerase chain reaction (PCR) into the E. coli expression vector (Joven et al., 2013). Venters et al. (2004) confirmed that the Pax3 antibody stains a single band of about 60 kDa on western blots of extract from E3 chicken neural tube and notochord. In addition, the expression pattern of Pax3 protein obtained in the present study was similar to that reported previously for in situ hybridization with Pax3 mRNA probe (Lin et al., 2012) and for Pax3 protein (Lin et al., 2016).
Image and statistical analysis
We viewed and photographed all sections under a transmission light and fluorescence microscope (Olympus BX40, Hamburg, Germany), which was equipped with a digital camera (Olympus DP70). Some of the sections and open-book preparations were visualized and photographed under a confocal laser-scanning microscope (SP5, Leica Microsystems). With Photoshop software (Adobe, Mountain View, CA), we adjusted contrast and brightness in the images so that the figures displayed the staining patterns optimally. For double-labeled sections, we used the same computer program to superimpose the digital images of one stain onto the corresponding images of the other stain from the same section.
The fluorescence intensity of the medial longitudinal commissural projection fibers (mlc) and of the intermediate longitudinal commissural projection fibers (ilc), the size of the aggregated cell clusters and the length of axons or neurites were measured with ImageJ software (free software from imagej.net). Analytic data are presented as mean ± SD for at least three independent experiments in each case. Student's t-test was used to analyze the significance of differences between GFP alone (control) and Pax3 overexpression. P < 0.05 was considered a significant difference.
Results
Pax3 overexpression induces cell aggregation in the developing spinal cord
Previously, we successfully overexpressed and knocked down the expression of the transcription factor Pax3 and found that Pax3 and its homolog Pax7 interact reciprocally in the developing chicken spinal cord (Lin et al., 2016). In the present study, we extend this finding and show that Pax3 overexpression in ovo induces cell aggregation in the developing spinal cord (Fig. 1B,E,F; compare with the control in Fig. 1A). This result is consistent with the in vitro finding that Pax3 overexpression results in cell aggregation in both human Saos-2 osterosarcoma cells and Rh30 rhabdomyosarcoma cells (Wiggan et al., 2002). The cell aggregation induced by Pax3 overexpression is partially rescued by Pax3-specific shRNA (Fig. 1C). The inhibition of Pax3 expression was shown at the mRNA level (arrow in Fig. 1G) compared to the wildtype (Fig. 1H) and at the protein level (Fig. 1L–O). The overexpression of Pax3 was detected both at the mRNA level (Fig. 1I) and at the protein level (Fig. 1J,K).
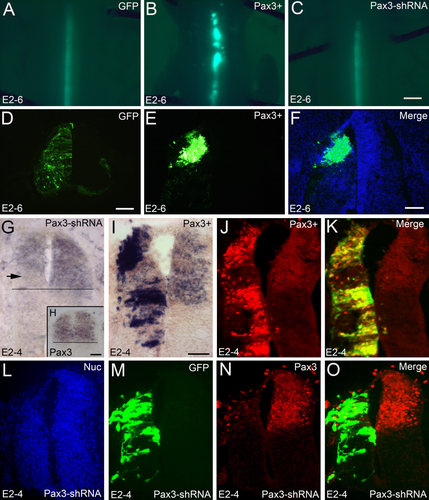
Pax3 overexpression induces cell aggregation in the developing spinal cord. In ovo electroporation was performed at E2 (2 days' incubation) and the positive embryos were collected at E4 (G–O) and at E6 (A–F). A–C are overviews of the positive area after GFP (control) electroporation (A), Pax3 overexpression (B), and rescue with Pax3-specific shRNA (C). D–F are the sections for the control electroporation (GFP alone; D), Pax3 overexpression (E), and the merge of Pax3 overexpression and Hoechst nuclear staining (F). G–I show in situ hybridization results with Pax3 antisense probe for Pax3 inhibition with shRNA (G), the normal Pax3 expression pattern (H, insert in G), and Pax3 overexpression (I). J,K show Pax3 overexpression detected at the protein level, and K is the merge of J and the GFP staining of the same section. L–O show results from Pax3 inhibition with shRNA (Pax3-shRNA) detected by Pax3 antibody (N). L is the Hoechst nuclear staining (Nuc) and O is the merge of N and the GFP staining (M) of the same section. The horizontal lines in G,H (insert in G) mark the ventral boundary of normal Pax3 expression. The arrow in G shows the area of Pax3 expression that is inhibited by specific Pax3 shRNA. Scale bars = 1 mm in C (for A–C); 100 μm in D,F (for D–F); 50 μm in H,I (for G,I–O). [Color figure can be viewed at wileyonlinelibrary.com]
Cell aggregation induced by Pax3 overexpression is stage-dependent
To further analyze how Pax3 overexpression induces cell aggregation, we performed in ovo electroporation at different developmental stages, such as at E2 (Fig. 2D–F), E3 (Fig. 2G–I) and E4 (Fig. 2J–L). GFP-positive embryos were collected at E6. Compared to the control (Fig. 2A–C), the cell aggregation into balls is very strong when in ovo electroporation was performed at E2 (arrows in Fig. 2F) and E3 (arrows in Fig. 2I), although it is a little weaker at E3 than at E2 (Fig. 2D–I, M). However, there was little or no cell aggregation when in ovo electroporation was performed at E4 (Fig. 2J–M). This result suggests that the induction of cell aggregation by Pax3 overexpression is a stage-dependent phenomenon in the developing spinal cord.
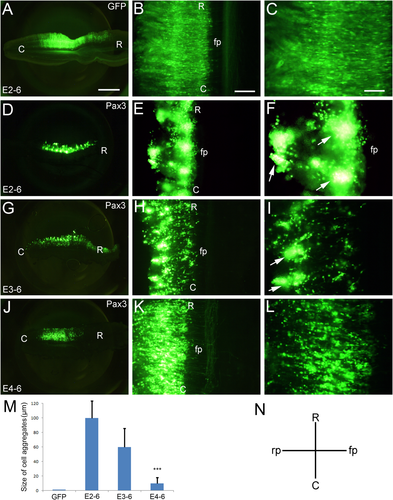
Cell aggregation induced by Pax3 overexpression is stage-dependent. In ovo electroporation was performed at E2 (2 days' incubation), E3 and E4, and the GFP-positive embryos were collected at E6. All panels show open-book preparations. (A–C) Electroporation of GFP alone (control). (D–L) Pax3 overexpression at E2 (E2–6; D–F), E3 (E3–6; G–I), and E4 (E4–6; J–L). M shows a statistical analysis for the size of the cell aggregates (μm) for samples electroporated at different developing stages, as indicated. N is a scheme showing the direction of the sections. The error bars represent means ± SEM (n = 5). ***Significantly different from E4–6 to E2–6 and E3–6, P < 0.01. C, caudal; fp, floor plate; R, rostral; rp, roof plate. Arrows in F and I indicate the cell aggregates. Scale bars = 1 mm in A (for A,D,G,J); 200 μm in B (for B,E,H,K); 100 μm in C (for C,F,I,L). [Color figure can be viewed at wileyonlinelibrary.com]
We also quantified the size of the cell aggregates after Pax3 overexpression. As a result, we observed that the size of the aggregates is smaller at E2–6 than at E3–6 (Fig. 2D–M). After Pax3 overexpression, cell aggregates not only occur in the dorsal regions of the spinal cord, but also in the ventral regions. There was no difference between the dorsal and the ventral regions when the electroporation was carried out at E2 (Fig. 2D–F). However, when the electroporation was performed at E3 and later, the cell aggregations preferentially located in more dorsal regions (Fig. 2G–L), which suggests that Pax3 regulates cell fate differentially in ventral and dorsal spinal regions.
Time course of the cell aggregation induced by Pax3 overexpression
Next, we studied the time course of cell aggregation after electroporation of Pax3 at E2.5 (Fig. 3). Positive embryos were collected at 6h (E2.5 + 6h, Fig. 3A–D), at 12h (E2.5 + 12h, Fig. 3E–H), at 18h (E2.5 + 18h, Fig. 3I–L), at 1d (E2.5 + 1d, Fig. 3M–P), at 1.5d (E2.5 + 1.5d, Fig. 3Q–T), and at 2d (E2.5 + 2d, Fig. 3U–X) after electroporation, respectively. A comparison to the control (GFP alone; Fig. 3A,B,E,F,I,J,M,N,Q,R,U,V) revealed that Pax3-overexpressing cells start to aggregate soon after electroporation (at 12h, Fig. 3E–H). Distinct cell aggregates can then be observed until at least E4.5 (2d after electroporation, Fig. 3I–X).
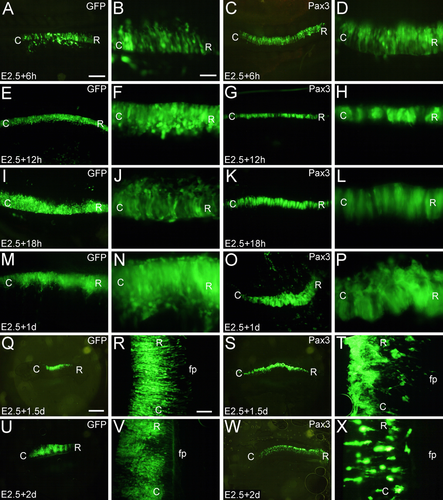
Time course of cell aggregation induced by Pax3 overexpression. In ovo electroporation was performed at E2.5 (two days' incubation), and the positive embryos were collected at 6h (E2.5 + 6h, A–D), 12h (E2.5 + 12h, E–H), 18h (E2.5 + 18h, I–L), 1 day (E2.5 + 1d, M–P), 1.5 days (E2.5 + 1.5d, Q–T), and 2 days (E2.5 + 2d, U–X) after in ovo electroporation. A,B,E,F,I,J,M,N,Q,R,U,V show results for electroporation with GFP alone (controls), and C,D,G,H,K,L,O,P,S,T,W,X for Pax3 overexpression. The panels in the second and fourth columns show magnifications of the panels in the first and third column, respectively. C, caudal; fp, floor plate; GFP, green fluorescence protein; R, rostral. Scale bars = 500 μm in A (for A,C,E,G,I,K,M, O); 1 mm in Q (for Q,S,U,W); 100 μm in B (for B,D,F,H,J,L,N,P), and in R (for R,T,V,X). [Color figure can be viewed at wileyonlinelibrary.com]
Pax3 overexpression perturbs commissural axon projection
In the wildtype, dI1 and dI2 commissural neurons extend axons that project through the floor plate (fp) to the contralateral side where they form two axon tracts, the medial longitudinal commissural tract (mlc) and the intermediate longitudinal commissural tract (ilc in Fig. 4A,B). However, when Pax3 is overexpressed and most positive cells form aggregates (see above), only a few axons cross through the fp and form a thin mlc fiber bundle but no ilc (Fig. 4C,D). As expected, Pax3-specific shRNA partially rescues the cell aggregation induced by Pax3 overexpression, and most of positive axons are able to cross the fp to form both the mlc and the ilc (Fig. 4E,F), although the two tracts are not as prominent as in the control (electroporation of GFP alone; Fig. 4A,B,G). We conclude that Pax3 overexpression perturbs commissural axon projections in the developing spinal cord.
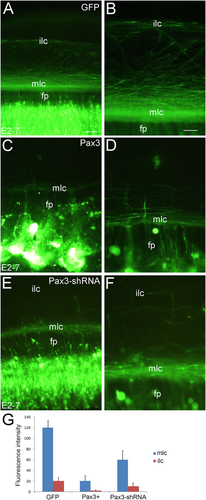
Pax3 overexpression perturbs commissural axon projection in the developing spinal cord. In ovo electroporation was performed at E2 (2 days' incubation) and the positive embryos were collected at E7, then the spinal cord open-book was carried out. A,B: GFP alone as a control. C,D: Pax3 overexpression which perturbs axon projection through the floor plate. E,F: Pax3-specific shRNA which partially rescues the perturbation of Pax3 overexpression. B,D,F are higher magnification of the regional area in A,C,E, respectively. G: Statistical analysis for the difference of the mlc and the ilc between Pax3 overexpression (Pax3+) and control (GFP) samples, and the error bars represent means ± SEM (n = 5). fp, floor plate; ilc, intermediate longitudinal commissural axons; mlc, medial longitudinal commissural axons. Scale bars = 100 μm in A (for C,E); 50 μm in B (for D,F). [Color figure can be viewed at wileyonlinelibrary.com]
To assess the morphological changes that are induced by Pax3 overexpression along the transfected spinal cords, we obtained complete rostrocaudal series of sections. These series confirmed the presence of the cell aggregates and the perturbed axon projections (Fig. 5). Compared to the control (GFP alone; Fig. 5A1–8 and A4a–7a), the Pax3-overexpressing spinal cord shows large cell aggregates (arrows in Fig. 5B4–8 and B4a–7a), a weak mlc and almost no ilc (Fig. 5B1–8 and B4a–7a). Pax3-specific shRNA partially rescued this phenotype (data not shown).
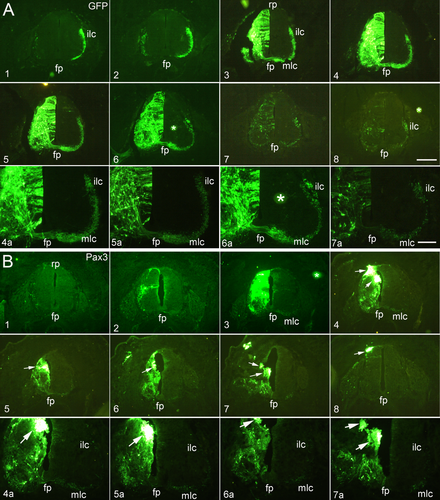
Rostrocaudal series of transverse sections through the developing spinal cord after electroporation of GFP alone (control; A1–8 and A4a–7a), and Pax3 overexpression (B1–8 and B4a–7a). A4a–7a and B4a–7a are higher magnifications of panels 4–7 in A,B, respectively. In ovo electroporation was performed at E2.5 (2.5 days' incubation) and the positive embryos were collected at E6. fp, floor plate; ilc, intermediate longitudinal commissural axons; mlc, medial longitudinal commissural axons; rp, roof plate. Scale bar = 200 μm in A8 for A1–8 and B1–8; 100 μm in A7a for A4a–7a and B4a–7a. [Color figure can be viewed at wileyonlinelibrary.com]
Relation of cell aggregation and axon elongation with Pax3 overexpression
To study whether there is a relation between cell aggregation and the lack of axon extension in the Pax3-overexpressing cells, we analyzed the electroporated areas of the spinal cords at a higher magnification. Figure 6 compares representative neurons with their extending axons in the wildtype (arrows in Fig. 6A–C) and the considerably shortened processes that were observed after Pax3 electroporation (arrows in Fig. 6D–G). The confocal series of sections in Figure 7 demonstrates that the orientation of the axons is parallel in the control experiment, in agreement with the projection pattern in the wildtype (Figs. 7A1–9,Aa; 8A,B). When Pax3 is overexpressed, the axon outgrowth is perturbed (Fig. 7B1–9,Bb) and the cell processes are often seen to extend towards the cell aggregates (arrows in Figs. 7C1–9,Cc; 8C,D). Additionally, the shape of cell that express Pax3 ectopically is rounder (Figs. 6D–F; 8C,D) and the axons are much shorter (Fig. 8C,D) compared to the control (Fig. 8A,B,E). Many of the Pax3-overexpressing positive cells and their processes (arrows in Fig. 8C,D) remain in close contact with each other in common aggregates (Figs. 7, 8).
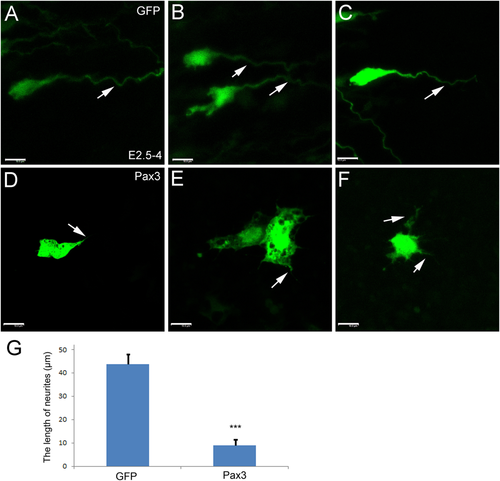
Pax3 overexpression perturbs neuronal axon growth. In ovo electroporation was performed at E2.5 (incubation for 2.5 days) and the positive embryos were collected at E4. The single cells were photographed under a confocal fluorescence microscope. (A–C) Cells electroporated with GFP alone (control). (D–F) Pax3-overexpressing neurons. Arrows in A–C show the growing axons, and in A–F the short processes of Pax3-overexpressing cells. G: A statistical analysis for the difference in length of the ascending axons (neurites) of Pax3 overexpressing cells (Pax3) and control (GFP) neurons. The error bars represent means ± SEM (n = 10). ***Significantly different from Pax3 overexpression group to GFP control group, P < 0.01. Scale bars = 10 μm. [Color figure can be viewed at wileyonlinelibrary.com]
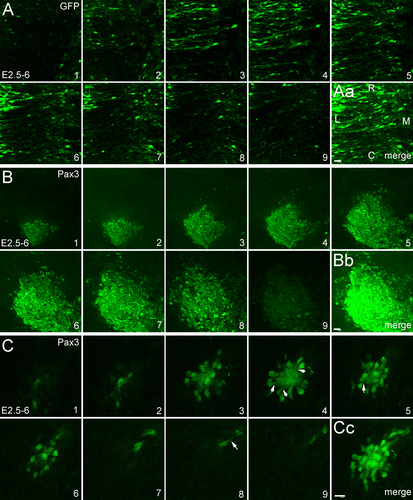
The morphology of Pax3-overexpressing cells and their aggregation in the developing spinal cord. In ovo electroporation was performed at E2 (incubation for 2 days) and the positive embryos were collected at E6. The GFP-positive area was photographed under a confocal fluorescence microscope. The series of panels show sequential 5 μm-thick optical slices from image stacks with a total of 40 μm thickness. The images merged from each stack are shown in A', B', and C', respectively. (A1–9) Electroporation of GFP alone (control). (B1–9) Pax3 overexpression. (C1–9) High magnification of a cell aggregate that overexpresses Pax3. The sections are from lumbar region of the spinal cord and the orientation is shown in A' for all panels. Arrows in C4, C5 and C8 point to short processes that extend in the direction of the aggregate. C, caudal; L, lateral (roof plate); M, midline (floor plate); R, rostral. Scale bars = 20 μm in A' for A1–9; in B' for B1–9; 10 μm in C' for C1–9. [Color figure can be viewed at wileyonlinelibrary.com]
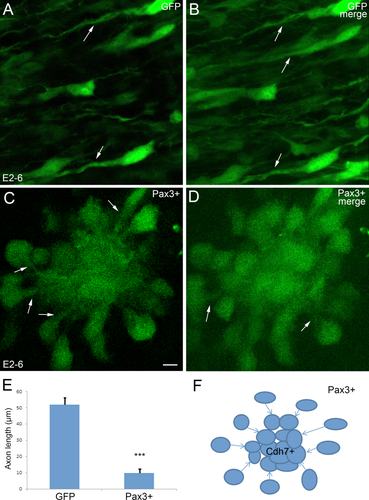
GFP-positive neurons at a higher magnification (confocal microscopy). In ovo electroporation was performed at E2 (2 days' incubation) and the positive embryos were collected at E6. GFP alone as a control (A,B) and Pax3 overexpression (C,D) are compared. B,D show merges of a 40 μm-thick stack of optical sections. A,C are single optical sections from each stack. Arrows in A–D show the axons. E: A statistical analysis of the difference in axon length between Pax3 overexpressing (Pax3+) neurons and control (GFP) neurons. The error bars represent means ± SEM (n = 20). ***Significantly different from Pax3 overexpression group to GFP control group, P < 0.01. F: A schematic model of how the Pax3-overexpressing cell might aggregate by following their leading axons that extends towards the cell aggregate. Scale bar = 5 μm in C for all panels. [Color figure can be viewed at wileyonlinelibrary.com]
It is known that Pax3 overexpression upregulates the ectopic expression of Cdh7 in the developing spinal cord (Lin et al., 2016). Cadherins are cell adhesion molecules that mediate cell adhesion and cell aggregation. In addition to Cdh7, we therefore analyzed the expression of all known classic cadherins in chicken (Fig. 9; Cdh19 is not shown because it was totally negative). After Pax3 overexpression, Cdh7, but none of the other classic cadherins, is upregulated (arrows in Fig. 9A,E).
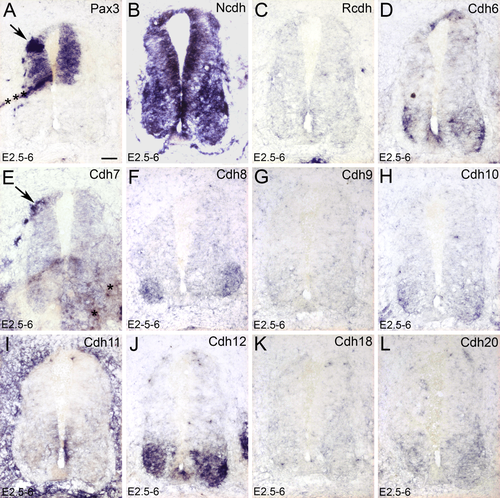
The expression of different classic cadherins after Pax3 overexpression detected by in situ hybridization. In ovo electroporation was performed at E2.5 (2.5 days' incubation) and the positive embryos were collected at E6. A–L: The expression of Pax3 (A), Ncdh (B), Rcdh (C), Cdh6 (D), Cdh7 (E), Cdh8 (F), Cdh9 (G), Cdh10 (H), Cdh11 (I), Cdh12 (J), Cdh18 (K), and Cdh20 (L). Arrows in A and E point to the area of Pax3 overexpression. Scale bar = 100 μm in A for all panels. [Color figure can be viewed at wileyonlinelibrary.com]
Discussion
During central nervous system (CNS) development, Pax3 and its homolog, Pax7, play important roles in embryogenesis and the establishment of regional identity (Relaix et al., 2005, 2006; Thompson and Ziman, 2011). Both Pax3 and Pax7 are expressed at the dorsal edges of the early neural plate during neural tube closure (Basch et al., 2006; Agoston et al., 2012). In later chicken embryos, similar to other vertebrates, Pax3 is strongly expressed in the dorsal part of the spinal cord, where overexpression of Pax3 and Pax7 induces the ectopic expression of cadherin-7 (Cdh7), but perturbs its endogenous expression (Lin et al., 2016). This finding suggested that Pax3 is involved in cell adhesion and patterning of the developing spinal cord. Cells of the dorsal neural tube give rise to sensory neurons and interneurons (Goulding et al., 1991), as well as neural crest cells, all of which require Pax3 and Pax7 (Bang et al., 1997; Basch et al., 2006; Thompson et al., 2008). It has been reported that Pax3 regulates cell aggregation and cell phenotypic mesenchymal-epithelial transition in vitro (Wiggan et al., 2002). However, little is known about whether Pax3 regulates cell adhesion and axon pathway finding also in vivo. In the present study, we investigated the expression regulation of Pax3 in vivo, and show, for the first time, that Pax3 overexpression induces cell aggregation and perturbs the projection of commissural axons in the developing chicken spinal cord, as discussed in more detail in the following sections.
Pax3 induces cell aggregation
In vitro, Pax3 regulates cell adhesion and epithelial cell morphogenesis. A similar mechanism may explain the developmental defects that arise when Pax3 activity is abnormal in vivo (Wiggan et al., 2002). During neural tube development, Pax3 promotes and/or maintains cadherin-mediated intercellular adhesion, as well as the epithelial architecture of neuroepithelial cells (Yang and Trasler, 1991; Wiggan et al., 2002). In our study, Pax3 overexpression induced cell aggregation in the developing spinal cord (Figs. 6, 8). As an explanation of this finding, we propose that Pax3-overexpressing cells recognize each other, possibly by extending short processes, and aggregate (Fig. 8F). This mutual recognition may be mediated by the expression of homologous cell adhesion molecules, such as cadherins. Our previous study demonstrated that Pax3 overexpression induces ectopic expression of Cdh7 (Lin et al., 2016). Here we found no effects on the expression of other classic cadherins (Fig. 9), which suggests that Pax3 may interact specifically with Cdh7. Accordingly, the aggregation of Pax3-overexpressing cells may be mediated by the expression of the adhesion molecule Cdh7 (Redies and Takeichi, 1996).
It is known that Pax3 is essential for early neural crest progenitor formation (Olaopa et al., 2011) and is also involved in driving cell migration and differentiation during neural crest development (Nakazaki et al., 2009; Milet et al., 2013). Consistent with these findings, we observed that Pax3 overexpression induces the differentiation of neural progenitor into neurons (Lin et al., 2016) and guides the migration of these cells into large cell aggregates (Figs. 7, 8). MicroRNA-27b overexpression downregulates the expression of Pax3, interferes with progenitor cell migration, and results in premature differentiation (Crist et al., 2009). In the future, it would be of interest to investigate whether microRNAs can regulate Pax3 expression also in the developing spinal cord.
Pax3 not only contributes to diverse cell lineages during embryonic development, but it is also important in tumorigenesis. For example, there is higher PAX3 protein expression in neuroblastoma cells where Pax3 is related to the oncogenic characteristics of these cells (Fang et al., 2014). While Pax3 overexpression induces cell aggregation in the developing spinal cord, it remains unknown at present whether overexpression of Pax3 may also result in tumor formation at a later stage.
Commissural axon projection requires normal Pax3 expression
Most dorsal spinal commissural neurons project their axons across the midline and then turn rostrally to continue along the medial longitudinal commissural tract, which is located adjacent to the floor plate and contributes to the ventral funiculus. However, a subset of the axons leaves the ventral funiculus to project into the lateral funiculus, where they form the intermediate longitudinal commissural axons (Bovolenta and Dodd, 1990; Imondi and Kaprielian, 2001; Kadison and Kaprielian, 2004; Sakai and Kaprielian, 2012). Molecular mechanisms that regulate neural circuit formation in the developing spinal cord have been investigated in several studies. For example, during midline crossing, spinal cord commissural axons become responsive to Semaphorins and Slits. Chemoattractants (such as Netrin-1 and Shh) and chemorepellents (such as bone morphogenetic proteins), which are secreted by cells in the floor plate and roof plate, respectively, guide them to the ventral midline (Parra and Zou, 2010; Sakai and Kaprielian, 2012; Sakai et al., 2012). In the vertebrate spinal cord, the Robo-Slit guidance system mediates the relative positioning of the longitudinal axon tracts (Long et al., 2004; Jaworski et al., 2010; Sakai et al., 2012).
We showed that the expression of both Pax3 and Pax7 is repressed by secreted Shh in the dorsal spinal cord (Lin et al., 2016). In the present study, we therefore asked whether Pax3 also induces the commissural axons to project along the ventral and lateral funiculus in the developing spinal cord. Our results provide evidence that Pax3 is indeed required for proper axon projection of commissural axons. Pax3 overexpression and inhibition both repress the projection of commissural axon across the midline, although the effect of Pax3 inhibition is much weaker than that of overexpression.
As a possible explanation for the perturbed commissural axon projection, we found that Pax3 overexpression significantly shortened the outgrowing neurites (Figs. 6, 8), and the Pax3-positive cells make contact with each other through their shortened neurites (Figs. 7, 8). Moreover, we have previously shown that Pax3 overexpression induces Cdh7 ectopic expression (Lin et al., 2016). The preferentially homotypic binding mechanism that characterizes classic cadherins may induce the Pax3/Cdh7-positive cells to recognize each other with their shortened neuritis and to migrate toward each other to form common cell aggregates (see above; Fig. 8). The growing axons may then be unable to escape the adhesive environment of the aggregates, which may lead to perturbed commissural projections. However, this explanation remains hypothetical because the exact molecular mechanism by which the Pax3-overexpressing cells recognize each other and promote cell aggregation remains unclear. Alternatively, the inhibition of Pax3 may also have an effect on the balance between ascending and descending pathways, which was shown to be crucial for neural circuit formation of the developing mouse spinal cord (Kamiyama et al., 2015; Jiang et al., 2016).
Pax3 regulates cell aggregation and axon projection in a dosage-dependent and stage-dependent manner
In a previous study, Chalepakis et al. (1994) demonstrated that an alteration of the spatiotemporal expression of Pax3 results in abnormalities of tissue and organ development in a dosage-dependent manner. In our study, Pax3-specific shRNA rescued the result from Pax3 overexpression, but only in part, which is consistent with a dosage-dependent effect of Pax3 expression (Chalepakis et al., 1994). Pax3 inhibition alone did not result in abnormalities similar to those seen with Pax3 overexpression. Possibly, other molecules can functionally replace Pax3. For example, it is known that Pax3 and Pax7 share similar expression patterns and interact with each other in the developing nervous system (Agoston et al., 2012; Lin et al., 2016). It has been suggested that Robo mediates N-cadherin-dependent fasciculation and regulates the formation of the ventral and lateral funiculi in the developing spinal cord (Sakai et al., 2012).
The inhibition of funiculus formation by Pax3 is stage-dependent. After E4, Pax3 overexpression no longer induces cell aggregation, but it still affected commissural axon projection. This result suggests that the general pattern of Pax3-positive cells has formed before E4 during spinal cord development, but axon growth can be perturbed at later stages.
Acknowledgments
We thank Dr. Schulte for Pax3 plasmid. We thank Ms. Schreiber for expert technical assistant and members of the laboratory for discussion and critical reading of the article.
Conflict of interest
The authors declare that they have no known conflicts of interest associated with this publication.
Roles of authors
J.L. performed most of the experiments. S.F. and C.Y. attended experiments and data analysis. J.L. and C.R. designed the study and wrote the article. All authors approved the final version of the article.


