Rod-cone crossover connectome of mammalian bipolar cells
Abstract
The basis of cross-suppression between rod and cone channels has long been an enigma. Using rabbit retinal connectome RC1, we show that all cone bipolar cell (BC) classes inhibit rod BCs via amacrine cell (AC) motifs (C1–6); that all cone BC classes are themselves inhibited by AC motifs (R1–5, R25) driven by rod BCs. A sparse symmetric AC motif (CR) is presynaptic and postsynaptic to both rod and cone BCs. ON cone BCs of all classes drive inhibition of rod BCs via motif C1 wide-field GABAergic ACs (γACs) and motif C2 narrow field glycinergic ON ACs (GACs). Each rod BC receives ≈10 crossover AC synapses and each ON cone BC can target ≈10 or more rod BCs via separate AC processes. OFF cone BCs mediate monosynaptic inhibition of rod BCs via motif C3 driven by OFF γACs and GACs and disynaptic inhibition via motifs C4 and C5 driven by OFF wide-field γACs and narrow-field GACs, respectively. Motifs C4 and C5 form halos of 60–100 inhibitory synapses on proximal dendrites of AI γACs. Rod BCs inhibit surrounding arrays of cone BCs through AII GAC networks that access ON and OFF cone BC patches via motifs R1, R2, R4, R5 and a unique ON AC motif R3 that collects rod BC inputs and targets ON cone BCs. Crossover synapses for motifs C1, C4, C5, and R3 are 3–4× larger than typical feedback synapses, which may be a signature for synaptic winner-take-all switches. J. Comp. Neurol. 527:87–116, 2019. © 2016 The Authors The Journal of Comparative Neurology Published by Wiley Periodicals, Inc.
All sensory, motor, homeostatic, and cognitive neural systems switch processing from one mode to another based on external or internal cues. Such events often display winner-take-all behaviors, evidenced by rapid alternation between and sustained dominance of specific channels under different stimulus conditions (Blake, 1989; Yuille and Grzywacz, 1989; Ashby et al., 1998; Davis, 2006; Kurt et al., 2008; Oster et al., 2009). Winner-take-all networks have a predicted network topology of lateral inhibition between parallel excitatory processing streams (Blake, 1989; Bogacz, 2007; Kurt et al., 2008), but the discrete synaptic partners in such networks have never been directly observed in any complex neural system.
Mammalian vision routinely engages a prototypical winner-take-all switch: reversibility between high amplification rod photoreceptor-based night vision that harvests limited photons for nocturnal, subterranean, or benthic navigation, and cone photoreceptor-based day vision that exploits abundant photons to build fast, color-coded movies of the world. Vision must span nearly six log units of flux between starlight and sunlight at zenith (Alpern, 1978; Warrant and Johnsen, 2013) and adjust to fast variations in the daily sinusoidal light curve from arising from cloud cover, canopies, water layers, caves, or burrows. In particular, all animals must transit prolonged mesopic epochs in which potentially confounding rod and cone signaling events coexist (Fig. 1A). Fast inhibitory interactions between rod and cone networks are critical at these times (Stabell and Stabell, 1998, 2002; Buck, 2004). But where might these interactions occur?
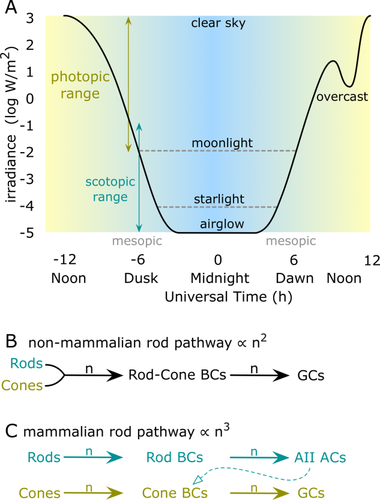
Rod-cone vision over the daily light curve. A: The light curve (black) for a temperate latitude fluctuates through overlapping photopic and scotopic ranges. Nocturnal floors set by lunar phase, latitude, and overcast dynamics can create mesopic ranges of a few to many hours. B: In nonmammalians, rod signals are collected by mixed rod-cone bipolar cells (BCs) that directly drive ganglion cells (GCs), resulting in two-stage excitatory amplification for rods (n2). C: In mammals, rod signals collected by rod BCs are aggregated by AII amacrine cells (ACs) and redistributed into the cone BC chain, resulting in three-stage excitatory amplification (n3) targeting GCs. n, amplifying glutamatergic synapse. Light curves are generalized from open access insolation datasets (e.g., http://www.ncdc.noaa.gov).
Nonmammalian retinas (Fig. 1B) use mixed rod-cone bipolar cells (BCs) for scotopic encoding and the net gain of the glutamatergic path from rods to ganglion cells (GCs) is n2, the product of each step of an approximate synaptic gain where n > 1 (see Marc et al., 2013). There is no strong evidence for fast rod-cone suppression in those species. In fact, there is evidence to the contrary. Both physiologic (Raynauld et al., 1979) and ecologic (Hobson, 1975; Munz and MacFarland, 1977) evidence shows that teleost fishes undergo a protracted mesopic rod-cone transition in which apparent loss of photoreceptor signaling may occur, creating a visual dead zone associated with habitat avoidance. In mammals (Fig. 1C), rod and cone signals are largely separated into distinct BCs, with rod signals later recombined in GCs. The rod signal is aggregated by AII glycinergic amacrine cells (GACs) into cone BC axon terminals in the inner plexiform layer (IPL), with a net gain for the rod to GC path of n3. This massively higher gain could have played a key role in the increasing diversification of mammals via opportunistic habitat invasion in the Cretaceous terrestrial revolution (Meredith et al., 2011). But this increase in gain must logically have involved compensatory fast switching between channels to be adaptive. As discrete rod and cone excitatory channels are restricted to the retina, where the only possible rod-cone lateral inhibition comes from horizontal cells (HCs) in the outer plexiform layer (OPL) and ACs in the IPL, our search was initially anatomical. Rod-cone coupling (Hornstein et al., 2005) and low levels of rod-cone mixing via bipolar cells (Pang et al., 2009) in the OPL offer no obvious mechanism for suppression, although there is excellent psychophysical evidence for rod-cone additivity driven by coupling or mixing (Buck, 2014). What mechanisms might account for the fast, narrow-field rod-cone cross-suppression observed in human psychophysics (Ingling et al., 1977; Thomas and Buck, 2006)? Cone suppression of rod sensitivity is perceptually most effective with transient stimuli (Ingling et al., 1977), consistent with the fast ionotropic GABAergic or glycinergic inhibition (Marc, 2004; Eggers and Lukasiewicz, 2006; Chávez and Diamond, 2008; Chávez et al., 2010; Moore-Dotson et al., 2015) . Since the IPL is a dense neuropil packed with inhibitory GABAergic amacrine cells (γACs) and GACs, we hypothesized that at least some key rod-cone lateral inhibitory networks reside therein.
Locating specific subnetworks embedded in larger-scale architectures is challenging because they could be widely spaced and sparsely connected. Indeed, since they had never been observed anatomically, we expected them to be rare. Classical imaging methods and black-box systems inference have long proven unable to find them (Marc et al., 2012, 2013) but their existence can clearly be inferred from physiological data (Chávez and Diamond, 2008). Using high-throughput automated transmission electron microscope imaging combined with molecular markers (Anderson et al., 2009, 2011b) and new network graph exploration tools, we quantitatively traced complete crossover networks in rabbit Retinal Connectome 1 (RC1), a cylindrical volume of IPL spanning 0.25 mm (Anderson et al., 2011b). We used both targeted tracing using the rod BC network as an anchor and high-density network graph queries to search RC1 for the elusive lateral inhibitory connections between rod and cone channels. We discovered γACs and GACs that form basic cone BC → rod BC “C” motifs, rod BC → cone BC “R” motifs, and one symmetric cone ⇄ rod “CR” motif: all lateral inhibitory network motifs. Importantly, these motifs engaged all identifiable classes of cone BCs.
MATERIALS AND METHODS
Connectomics volume RC1
Our connectome methods, tissue sampling, and analytical techniques have been described previously in detail (Anderson et al., 2011a, 2011b; Lauritzen et al., 2012; Marc et al., 2013, 2014b) and only essential points are expanded here. Connectome volume RC1 is an open-access, transmission electron microscopy (TEM)-based, ultrastructural rabbit retina volume based on 371 serial 70–90-nm-thick sections, capstoned and intercalated with optical sections containing small molecule signals for cell classification (Anderson et al., 2011a, 2011b). The volume was acquired from an anesthetized light-adapted female Dutch Belted rabbit (Oregon Rabbitry, OR) after 90 minutes of photopic light stimulation at 3 Hz square wave, 50% duty cycle with a 3 yellow – 1 blue pulse sequence (detailed in Anderson et al., 2011b) in the presence of ≈13–16 mM intravitreal AGB based on an estimated ocular volume of 0.8–1.0 ml computed from the rabbit schematic eye (Hughes, 1972). All protocols were in accord with Institutional Animal Care and Use protocols of the University of Utah, the ARVO Statement for the Use of Animals in Ophthalmic and Visual Research, and the Policies on the Use of Animals and Humans in Neuroscience Research of the Society for Neuroscience. The epoxy resin bloc was sectioned in the horizontal plane at 70–90 nm onto polyvinyl formal resin coated gold slot grids for TEM and onto array slides for optical imaging and probing with anti-hapten IgGs targeting small molecules (Marc et al., 1995; Marc and Jones, 2002; Lauritzen et al., 2012): 1-amino-4-guanidobutane (B100R, RRID AB_2532053), aspartate (D100R, RRID AB_2341093), GABA (YY100R, RRID AB_2532061), glycine (G100R, RRID AB_2532057), glutamate (E100R, RRID AB_2532055), glutamine (Q100R, RRID AB_2532059), or taurine (TT100R, RRID AB_2532060), all from Signature Immunologics (Torrey, UT); Table 1. All markers have been previously published (Anderson et al., 2009, 2011b) and are part of the dataset used to quantitatively classify cells. Small molecule signals were visualized with silver-intensification of 1.4 nm gold granule-conjugated goat antirabbit IgGs (Nanoprobes, Yaphank, NY, Cat. no. 2300, no RRID), imaged (8-bit 1388 pixel × 1036 line frames), mosaicked, aligned to the TEM volume, and classified (Marc and Jones, 2002; Anderson et al., 2009). Each TEM section was imaged at 2.18 nm resolution with over 1,000 image tiles per section stored in 16- and 8-bit versions, as well as image pyramids of optimized tiles for web visualization with the Viking viewer (Anderson et al., 2011a, 2011b). Neural networks in RC1 are annotated with the Viking viewer, and explored via graph visualization of connectivity and 3D renderings as described previously (Anderson et al., 2011a) and detailed below. The volume contains over 1.28M annotations, 104 rod BCs, > 190 validated cone BCs, and ≈300 ACs.
| Reagent | CAT# | RRID | Source | Dilution |
|---|---|---|---|---|
| anti-AGBa IgG | B100R | AB_2532053 | Signature Immunologics, Torrey, UT | 1:100 |
| anti-L-aspartate IgG | D100R | AB_2341093 | Signature Immunologics, Torrey, UT | 1:100 |
| anti-L-glutamate IgG | E100R | AB_2532055 | Signature Immunologics, Torrey, UT | 1:100 |
| anti-glycine IgG | G100R | AB_2532057 | Signature Immunologics, Torrey, UT | 1:100 |
| anti-L-glutamine IgG | Q100R | AB_2532059 | Signature Immunologics, Torrey, UT | 1:100 |
| anti-taurine IgG | TT100R | AB_2532060 | Signature Immunologics, Torrey, UT | 1:100 |
| anti-GABA IgG | YY100R | AB_2532061 | Signature Immunologics, Torrey, UT | 1:100 |
- a 1-amino-4-guanidobutane.
Cell classification
Analysis of independent molecular, morphologic, and connectivity feature spaces yields robust cell classification. Using molecular markers (Marc et al., 1995; Kalloniatis et al., 1996) and excitation mapping with 1-amino-4-guanidobutane (Marc, 1999a, 1999b; Marc and Jones, 2002), every neuron with a soma in RC1 can be classified using isodata clustering (Marc and Jones, 2002) and/or principal components mapping (Anderson et al., 2009) essentially without error as a horizontal cell, OFF cone BC, ON cone BC, rod BC, narrow-field GAC, wide-field γAC, GC, or Müller cell (Anderson et al., 2009, 2011b). Many crossing processes in RC1 originating from GCs and ACs outside the volume traverse one or more intercalated GABA, glycine, 1-amino-4-guanidobutane, or taurine channels, which often allows direct biochemical classification (Marc et al., 2013, 2014a, 2014b). More important, each molecular classifier uniquely maps onto the distinctive morphologies of each class of cells in 3D (including fine-scale stratification in the inner plexiform layer) and unique collections of network motifs accessed by each. Molecular mapping essentially presegments the connectome into cell classes and each can be efficiently mined for features. The detailed classification of cone BCs is beyond the scope of this article, but in general we have tried to merge our classifications (Lauritzen et al., 2012) with those of MacNeil et al. (2004). There are at least seven ON cone BCs (CBb3, CBb3n, CBb4, CBb4w, CBb5, CBb6, CBbwf) and five OFF cone BCs (CBa1, CBa1w, CBa2, CBab2-3/4/5) based on axonal arbor size, molecular signature, excitation mapping response, stratification, in-class and cross-class homocellular coupling patterns, and adherens junctions patterns. Following MacNeil et al. (1999), we classify most ACs as wide-field (wf) cells with arbors approaching or exceeding the size of the sample volume, or narrow-field (nf) with small 50–100 μm diameter arbors. Wide-field cells or processes traversing the volume can often be identified as GABA + but so far none are glycine+. Narrow-field cells with somas in the volume can be identified as glycine + but so far none are GABA+. We revert to the simple terminology of denoting the dominant GABA + ACs that receive both rod BC input and provide feedback synapses as AI γACs rather than the S1/S2 terminologies based on serotonin uptake patterns (Vaney, 1986, 2004; Sandell et al., 1989) or the classic “A17” terminology derived from Golgi-impregnated cat retina (Kolb et al., 1981). Our data currently support the AI γAC superclass as a single-motif population and the significance of our findings for the specific S1/S2 classes will be the subject of other articles and briefly addressed in the Discussion.
Mining networks
Candidate rod-cone crossover networks in RC1 were visualized and annotated by initiating tracing at every one of the 104 mapped rod BCs in RC1 and tracing outward in Viking (connectomes.utah.edu, RRID:SCR_005986) from individual amacrine cell (AC) synapses on the rod BC axon and axon terminal to determine the identity of the AC processes (e.g., exclusively rod BC or cone BC-driven). As the volume has become densely annotated, it has become more practical to search the RC1 database for novel connections using network graph tools and database queries. All resources are publicly accessible via Viking and a range of graph and query tools at connectomes.utah.edu. All cells in this article are numerically indexed to their locations, network associations, and shapes. The data shown in every TEM figure can be directly accessed via Viking with a library of *.xml bookmarks available at marclab.org/crxo. Each cell index number in the RC1 database can be entered into many different software tools for analysis, visualizations, or queries: Viking, Network Viz, Structure Viz, Info Viz, Motif Viz (all Viz tools are based on the GraphViz API at graphviz.org, developed by AT&T Research, RRID SCR-002937), and VikingPlot developed by the Marclab; and VikingView developed by the University of Utah Scientific Computing and Imaging Institute. Further, the Viking database supports export of networks and cell morphology for the network graph visualization application Tulip (tulip.labri.fr) developed by the University of Bordeaux, France; cell morphology for import into Blender (Blender.org, RRID SCR-008606); and network queries Microsoft SQL and Microsoft Excel with the Power Query add-in to use the Open Data Protocol (OData.org) to query connectivity features. In fact, a great deal of motif quantification requires computational graph visualization. At present, the RC1 volume database contains over 1.3 million high-quality annotations and a graph of all connections contains 12,519 nodes (vertices, cell processes) and 26,540 directed edges (connections: ribbon synapses, conventional synapses, gap junctions, etc.). Visualizing, organizing, pruning, and classifying these networks requires the algorithmic sophistication provided by Tulip 4.8 to aid network mining, which we augment with regex (regular expression) based Python plug-ins for network queries developed by the University of Utah Scientific Computing and Imaging Institute (https://github.com/visdesignlab/TulipPaths). We used the Python regex implementation Python (https://docs.python.org/2/library/re.html). Tulip-formatted networks can be directly exported from our connectome databases with a web query tool at connectomes.utah.edu and all data used in this article can be accessed via the current *.tlpx file at marclab.org/crxo/RC1-20160515-nw-ALL_hops_1.tlpx. It is also provided as supplemental file RC1-20160515-nw-ALL_hops_1.tlpx. The characterizations of motifs happens through two processes: directed tracing or incidental tracing and algorithmic discovery in Tulip or via database queries, which is the penultimate goal of most connectomics analyses. Each directed tracing motif is counted as a consolidated instance owned by a source cell; incidental tracing motifs are counted as regex instances (single motifs) owned by a target. For example, the motif CBb51 > YAC1 > RB1, RB2, RB3 represents one consolidated motif but 3 regex instances. Consolidated motifs are discovered by directed tracing and tabulated as such (Tables 2, 3, and Supplemental S1). Single motifs are discovered by regex queries and represent the density of pathways available for analysis. A typical 3-node regex query might be: node 0 = CBa.*, edge 0 = Ribbon Synapse, node 1 = .*, edge 1 = Conventional, node 2 = YAC Ai, edge 2 = Conventional, node 3 = Rod BC; where CBa.* captures all classes of CBa BCs, .* captures all cells postsynaptic to the CBa BCs that make conventional synapses onto AI γACs (YAC Ai) targeting rod BCs. This query captures all single instances of motifs C4 + C5. A sample output is provided at marclab.org/crxo/RC1-CBa=null-YACAi-RB.txt, and captures 809 C4 + C5 instances. Less the 91 directed consolidated counts, this represents the regex entry of 718 in Table 3. Statistical analysis of network motifs features includes network combinatorics, conventional parametric (t-test), and nonparametric statistics (Kolmogorov–Smirnov).
| Motif | Definitions | Features |
|---|---|---|
| C1 |
Non-AI γACs targeting rod BCs. All C1 motifs are R1 motifs. n = 152 validated, 43 as γ+, 109 as wide-field. |
γACs, ON layer, wide-field, monostratified, electron lucent varicose / beaded processes, thin interbead connections (50-100 nm), often very straight unbranched trajectories crossing the volume. |
| C2 |
GACs targeting rod BCs. All C2 motifs are R2 motifs. n = 13 validated as G+. |
GAC, ON layer, narrow-field, diffusely stratified, electron gray irregularly beaded processes, complex curved trajectories, never spans the volume. |
| C3 | γACs lacking BC input & targeting rod BCs. n = 6 validated as γ+. | γAC, wide-field, bistratified (ON/OFF layers) electron lucent, thin beaded processes, nearly spans the volume. |
| C4 | OFF γAC targeting rod AI γACs. All C4 motifs are R4 motifs. n = 85 validated, 32 as γ+, 53 as wide-field. | γAC, OFF layer, wide-field, monostratified, electron lucent varicose processes, often thin interbead connections (50-100 nm), often straight trajectories crossing the volume. |
| C5 |
OFF GAC targeting rod AI γACs. All C5 motifs are R5 motifs. n = 4 validated as G+. |
GAC, OFF layer, narrow-field, diffusely stratified, electron grey, irregularly beaded processes, always complex curved terminal trajectories, never spans the volume. |
| C6 | AI γACs driven by CBb6 cells targeting rod BCs. n = 65 validated as γ+. | γACs, ON layer, wide-field, monostratified, electron lucent thick non-beaded microtubule-rich processes, large rod layer varicosities, wavy trajectories crossing the volume. |
| CR | ON γACs that source & target rod & ON cone BCs. n = 2 validated as γ+. | γAC, ON layer, wide-field, monostratified, electron lucent processes, large branches spanning the volume. |
| R1 | ON γACs providing feedback to ON cone BCs. Some R1 motifs are also C1 motifs. n = 389 validated as γ+. | γACs, ON layer, wide-field, monostratified, electron lucent varicose / beaded processes, thin interbead connections (50-100 nm), often straight trajectories crossing the volume. |
| R2 | ON GACs providing feedback to ON cone BCs. Some R2 motifs are also C2 motifs. n = 70 validated as G+. | GAC, ON layer, narrow-field, diffusely stratified, electron gray irregularly beaded processes, complex curved trajectories, never spans the volume. |
| R3 | Non-AI ON γACs sourcing rod BCs & targeting ON cone BCs. n = 4 validated as γ+. | γAC, ON layer, wide-field, monostratified, electron lucent, varicose / beaded, often very thick processes (250 nm), often straight trajectories crossing the volume. |
| R4 | OFF γACs providing feed-back to OFF cone BCs. Some R4 motifs are C4 motifs. n = 110 validated as γ+. | γAC, OFF layer, wide-field, monostratified, electron lucent varicose processes, often thin interbead connections (50-100 nm), often straight trajectories crossing the volume. |
| R5 | OFF GACs providing feedback to OFF cone BCs. Some R5 motifs are also C5 motifs. n = 40 validated as G+. | GAC, OFF layer, narrow-field, diffusely stratified, electron gray irregularly beaded processes, complex curved trajectories, never spans the volume. |
| R25 | ON/OFF GACs providing feedback to ON & OFF cone BCs. n = 4 validated as G+. | GAC, mid-IPL layer, narrow-field, monostratified stratified, electron gray irregularly beaded processes, complex curved trajectories, never spans the volume. |
| Motif ACs | Signal class | Rod BC target | Rod BC source | CBb target | CBb source | AC nested | CBa target | CBa source | AI γAC target | N | Motif ACs |
|---|---|---|---|---|---|---|---|---|---|---|---|
| C1 | γAC | X | X | X | X | 152 | C1 | ||||
| C2 | GAC | X | X | X | X | 13 | C2 | ||||
| C1+C2 | regex | X | X | X | X | 153 | C1+C2 | ||||
| C3 | γAC | X | X | X | 6 | C3 | |||||
| C3 | regex | X | X | X | 27 | C3 | |||||
| C4 | γAC | X | X | X | X | 85 | C4 | ||||
| C5 | GAC | X | X | X | X | 4 | C5 | ||||
| C4+C5 | regex | X | X | X | X | 718 | C4+C5 | ||||
| CR | γAC | X | X | X | X | X | 2 | CR | |||
| C6 | regex | X | X | CBb6 | 65 | C6 | |||||
| 1225 | ∑ C | ||||||||||
| R1 | γAC | via AII | X | X | X | 389 | R1 | ||||
| R2 | GAC | via AII | X | X | X | 70 | R2 | ||||
| R1 + R2 | ND | via AII | X | X | X | 2362 | R1 + R2 | ||||
| R3 | γAC | X | X | X | X | 4 | R5 | ||||
| R4 | γAC | via AII | X | X | X | X | 110 | R3 | |||
| R5 | GAC | via AII | X | X | X | X | 43 | R4 | |||
| R4 + R5 | ND | via AII | X | X | X | X | 289 | R3 + R4 | |||
| R25 | GAC | via AII | X | X | X | X | X | 4 | R25 | ||
| R25 | regex | 270 | R25 | ||||||||
| 3541 | ∑ R | ||||||||||
| 4766 | ∑ C+R | ||||||||||
| AI | γAC | X | X | CBb6 | 826 | AI | |||||
| AII | GAC | X | CBb6 | X | X | X | 2197 | AII | |||
| 3023 | ∑ A | ||||||||||
| 7789 | ∑ M |
- Filled black cells = functional contact; filled gray cells = Rod BCs sourced through AII ACs; open cell = no functional contact. γAC and GAC C motifs are consolidated instances (see Materials and Methods) counted from direct Viking reconstructions. Regex, R, AI, and AII AC motifs are regex instances counted from Tulip motif searches. ∑C sum of all C motif validated / consolidated paths and regex paths. ∑R sum of all R motif validated / consolidated paths and regex paths. ∑C+R sum of all C and R motif validated / consolidated paths and regex paths. ∑A sum of all AI and AII paths. ∑M sum of all motif paths. Paths labeled “regex” are the additional motif paths found by regex search.
Image preparation
As previously described (Anderson et al., 2009, 2011b; Lauritzen et al., 2012), TEM images in this article were imported from volume tiles in the RC1 Viking display in most cases or remapped in Adobe Photoshop CS6 Extended (adobe.com) with gamma 1.3 to soften contrast. Some images were sharpened with an unsharp mask with a kernel of 1–3 pixel radius (2–6 nm). A few synapses were illustrated by merging serial sections to provide a single view of an entire complex. Colored overlays used the TEM gray-scale brightness combined with the hue and saturation of the overlay as described by Anderson et al. (2011a). Three-dimensional renderings of annotated cells were generated in Vikingplot and Vikingview. Network graphs were displayed in Tulip and networks illustrated in OmniGraffle (omnigroup.com/omnigraffle). All our raw images and *.psd files with all layers are available at marclab.org/crxo.
RESULTS
The initial framework for our analysis was the basic rod pathway. Mammalian cone photoreceptor signals are split into several classes of ON and OFF cone BCs (MacNeil et al., 2004), which then synaptically transfer these polarities to ACs and GCs. In contrast, there is only one class of rod BC. Although it does not synapse on GCs, most mammalian GCs exhibit both rod and cone signals (except in the pure-cone primate fovea). This is achieved largely through the AII GAC pathway that collects rod BC signals and injects them into ON and OFF cone BCs in a re-entrant loop (Strettoi et al., 1990, 1992; Marc et al., 2013). ON and OFF cone BCs are also electrically coupled within superclasses (ON::ON, OFF::OFF) but rod BCs are not. Thus, we started tracing crossover networks starting from rod BCs.
We performed two types of directed mapping: wide mapping in which we identified examples of crossover motifs that repeat across many cells, and deep mapping of all synapses on a small set of cells to determine the approximate numbers of synapses and motifs per cell. This is very labor-intensive and we can achieve only about 250,000 annotations annually (≈1,000/workday) with our small team. But as the annotation of the volume for other cells was growing in parallel, it became possible to search network graph space with regex queries for crossover motifs.
We describe 13 distinct motifs that mediate rod-cone crossover: six motifs that mediate cone suppression of rods (motifs C1-C6); six motifs that mediate rod suppression of cones (motifs R1-5; R25); and one dual motif where cones and rods can suppress each other (Motif CR). Table 2 provides a definition of each motif, its neurochemical identity, and distinctive ultrastructural and meta-scale attributes. Table 3 provides a basic connectivity grid for each motif and a tabulation of the instances documented in the volume. Importantly, and unlike other datasets, connectomes are live datasets and these tabulations will increase nearly daily. The tabulations presented here are from analyses complete as of 25 May 2016. As we will detail below, we used regex-enabled database queries to find all instances of motifs in our volume. So far RC1 contains 1,225 C motifs, 3,541 R motifs, and 3,023 motifs associated with classical AI and AII networks with rod BCs. Most of these were discovered by automated regex queries and a subset mapped by directed tracing (325 C motifs, 620 R motifs) to extract complex features such as molecular signatures, process size and topology, and details of motif instances (Table 2). Some motifs are very abundant in total regex instances, reflecting the density of cells, processes, and coverage factors (C1, C2, C4, C5, R1, R2, R4, R5, R25) where others appear rare due to their very large dendritic fields, low densities of somas, and apparently low coverage factors (C3, C6, R3, CR). This does not mean they are ineffective. For example, γAC 18282 is one of four instances of motif R3 and has a large, heavily branched arbor spanning the entire connectome volume. While it collects from only a single rod BC (as do other R3 cells), it heavily inhibits 13 cone BCs (Table S1). Further, RC1 contains only a fraction of the cell's arbor (estimated to be 4–8× larger), so it will capture more rod BCs at roughly 1/10 its cone target load. So while sparse, it clearly could be potent. Table 3 summarizes the connective paths of all motifs, the number of consolidated instances (see Materials and Methods) derived from direct tracing/visualization and the number of regex instances (see Materials and Methods) derived from incidental tracing. The latter number is always much larger and reflects the fact that future connectomics analyses of large datasets will depend on algorithmic discovery, validated by direct tracing or visualization of subsets. We present our results in several broad sections: 1) a characterization of each motif architecture; 2) exploration of network motifs in the RC1 dataset; 3) a description of motif weights.
The RC1 dataset is a 0.25-mm diameter cylinder of rabbit retina that spans the retinal inner nuclear layer to the ganglion cell layer. We started our search by tracing synaptic connections outwards from 104 rod BCs in RC1 (Fig. 2) and the specific rod ACs they drive: wide-field AI γACs (>50 distinct major AI γAC arbors traversing RC1 and 12 AI γAC somas and arbors contained within RC1) and narrow-field AII GACs (39 cells contained in RC1). Each rod BC axon spans about 25 μm (Fig. 2A) and the convex hull of the axonal field forms an incomplete packing with extensive gaps (Fig. 2B). This is quite different from the over 200–300 cone BCs (split into ≈12 classes) where axonal fields form sheets coupled by gap junctions (Fig. 3A) and their shapes, best analyzed as star domains (rather than arbitrary convex hulls or Voronoi domains), generate highly efficient tilings of the synaptic plane (Fig. 3B). Thus cone BCs are defined as patches of coupled cells when we consider crossover motifs.
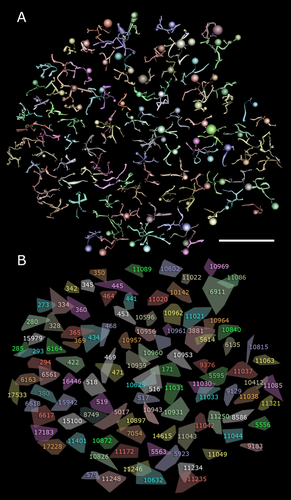
The rod bipolar cell array in RC1. A: VikingView renderings of 104 rod BC axonal fields in the volume. B: The convex hull for every rod BC axonal field and each cell's index number. Scale bar = 50 μm in A.

A fragment of a cone BC array in RC1 defining a coupled path. A: Five coupled CBb5 bipolar cells and their index numbers. B: Constrained star domains for CBb5 cells cover more territory than rod BC convex hulls. Scale bar = 20 μm in A.
Motifs C1 and C2: ON cone BC → AC → rod BC
Two class C motifs (C1, C2) driven by ON cone BCs are directly presynaptic but never postsynaptic to rod BCs. For these, and all following motifs, specific class definitions and cell attributes are summarized in Tables 2 and 3. Specifically, any non-AI γAC that targets rod BCs is a C1 motif AC. C1 motifs employ wide-field γACs with dendritic arbor diameters ≈0.5 mm or greater, while C2 motifs employ narrow-field GACs with dendritic arbor diameters ≈0.1 mm or smaller. Figure 4 shows a selection of processes and motifs sufficient to contact every rod BC in volume RC1 once, with either γAC C1 or GAC C2 motifs. Such a selection is formally termed a “spanning tree” in graph theory, where each cell represents a network graph node, and there are many such trees in RC1. As we shall see below, each rod BC likely receives 10–20 C motifs, so a complete display of structures supporting all the spanning trees would be extremely dense. Although many C1 γACs span the volume and their somas originate outside it, many are classifiable as γACs when they traverse GABA-labeled reference slices in RC1 (Anderson et al., 2011b; Lauritzen et al., 2012; Marc et al., 2013). Those that do not cross GABA-reference slices can also be grouped as C1 motifs because they exhibit ultrastructurally unique beaded processes with distinct prolate spheroid varicosities characteristic of wide-field γACs; smooth, straight interbead connecting segments as thin as 65 nm (unlike AI processes that are coarse, microtubule-rich, and very ropey rather than varicose); and/or are glycine-negative at glycine-labeled reference slices; and exit the volume in a straight trajectory like other wide-field γACs.
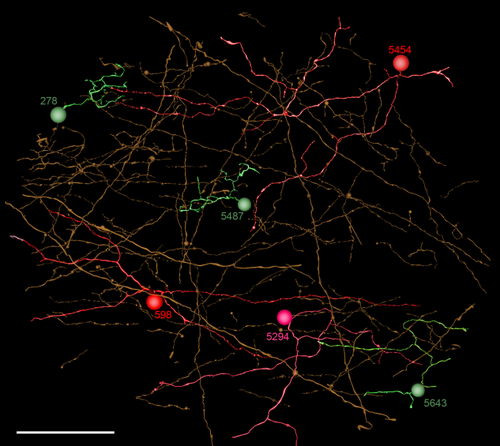
A set of inhibitory processes forming a network minimum spanning tree for C motifs in RC1. Each process represents an element that forms an inhibitory synapse on one rod bipolar cell. Warm colors denote GABAergic cells including three GABAergic somas (598, 5294, 5454); greens are glycinergic cells (278, 5487, 5643). Scale bar = 50 μm.
Motif C1 instances are by far the most common (n = 152 validated cases, Tables 2, 3, S1) and in most cases arise from γAC processes that traverse the entire volume, emanating from somas outside the volume. Only a few γACs associated with C motifs have their somas within the volume, consistent with the idea that C1 ACs are wide-field cells. Wide-field ON γAC processes are driven directly by ON cone BCs, such as the class CBb3n cell 6120 (Fig. 5A,B) that form feedback synapses onto ON cone BCs (Fig. 5C) either in-class or cross-class, and synapse directly on rod BC axon terminals via characteristic beaded processes (Fig. 5D). Importantly, all ON cone BC classes drive C1 γACs (Table S1). Our 152 instances of intentionally traced C1 motifs involves 394 ON cone BC contact instances: 36 CBb3, 119 CBb3n, 21 CBb4, 84 CBb4w, 105 CBb5, and 28 CBb6 cells. Our total consolidated + regex motif contacts exceed 1,000 and increases daily as more annotations are added. Only one instance of C1 contact with a wide-field ON cone BC (CBbwf) has been found. There are only two CBbwf cells yet identified in the volume. Complete tracing of all AC inputs to five rod BCs (cells 516, 517, 518, 519, 10625) revealed that at least 10 class C1+C2 motifs impinge on each rod BC axonal arbor (12 ± 4 motifs, mean ± 1 standard deviation [SD], n = 5 rod BCs; extracted from 227 cell contacts and 428 synapses), suggesting that RC1 likely contains 1,000–2,000 of these motifs (see below: Exploration of network motifs). The net synaptic gain of this motif is n2p (Fig. 5E), where n represents a canonical glutamate ribbon synapse; p is a sign-inverting, anion-mediated inhibitory synapse; the cone → ON cone BC → AC chain has a net gain of n2; the AC → rod BC step has a net gain of p; and the total chain has a gain of n2p (Marc et al., 2013). The distance between ON cone BCs and their nearest rod BC target inhibited by a C1 motif ranged from as small as 10 μm to the full RC1 volume diameter of 0.25 mm. In between, the C1 ACs contact other ACs and cone BCs. It appears that C1 crossover motifs are not constrained to be close to their target rod BCs.
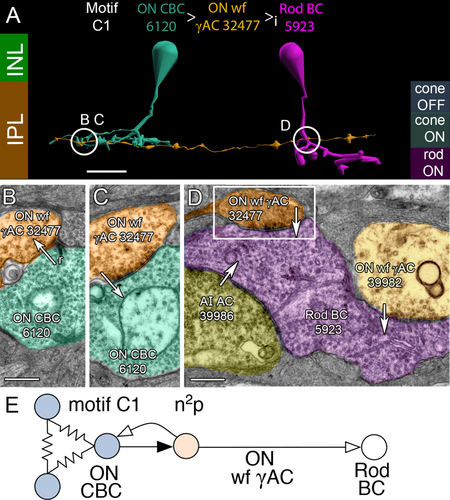
Motif C1. A: Direct inhibition between an ON cone BC (CBC 6120, cyan) and a rod BC cell (Rod BC 5923, magenta) mediated by a wide-field (wf) GABAergic AC process (γAC 32477, orange). Symbols: > sign-conserving glutamate synapse; >i sign-inverting GABA or glycine synapse. Circles and letters mark locations of ultrastructure in following panels. Guides for anatomic (left) and functional layers (right). B: Ribbon synapse (r, arrow) from ON CBC 6120 to ON wf γAC 32477. C: Conventional synapse (arrow) from ON wf γAC 32477 to ON CBC 6120. D: Composite of synapses (arrows) onto Rod BC terminal 5923 from AI AC 39986, and motif C1 ACs 39982 and 32477 (box). E: Motif C1 diagram. A patch of coupled (resistor symbols) ON CBCs are presynaptic via sign-conserving synapses (black arrows) and postsynaptic via sign-inverting synapses (white arrows) to an ON wf γAC, which is in turn presynaptic (but not postsynaptic) to rod BCs. The net glutamatergic gain of the C1 chain from cones → ON CBCs → ON wf γAC is n2, assuming each roughly similar stage has a gain n. Inhibitory gain is p. The total gain is n2p. See Marc et al. (2013). Scale bars = 20 μm in A; 500 nm in B–D.
C2 motifs are mediated by narrow-field ON GACs (Fig. 6), some resembling flag ACs (MacNeil et al., 1999) with irregular, lobular processes and electron-dense cytoplasm. Such GACs are usually completely contained within the RC1 volume. This embeds rod BCs in small fields (≈0.1 mm diameter) of ON cone BC-initiated glycinergic inhibition (Fig. 6A,B). Amacrine cells participating in C2 motifs (n = 13) are rarer than ACs participating in C1 motifs. This is expected since the ratio of γAC to GAC processes in the rabbit inner plexiform layer is ≈4. It may be that such ACs do not tile the retina fully. A regex query of RC1 shows that all C2 motif paths found so far make either one (13 cases) or two synapses (one case). We thus estimate that every rod BC receives only one or two C2 motif synapses. But the scope of C motif input to rod BCs is quite nicely illustrated by Figure 6C, where four different C-motif contacts are present in a single section: two C1 contacts (cells 39998, 31702), one C2 contact (cell 278), and one CR contact (cell 31700). The net synaptic gain of the C2 motif is n2p (Fig. 6D).
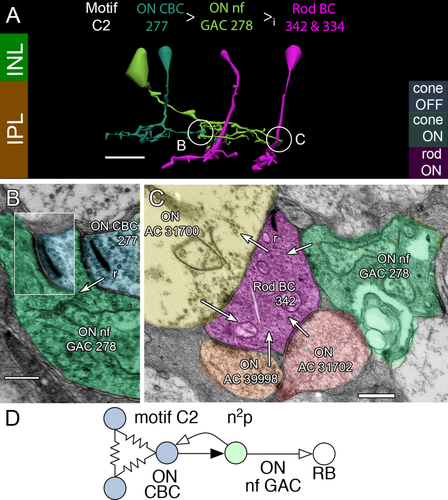
Motif C2. A: Direct inhibition between an ON CBC (278, cyan) and rod BCs (342, 334, magenta) mediated by a narrow-field (nf) glycinergic amacrine cell (GAC, green). B: Ribbon synapse (r, arrow) from ON CBC 277 to ON nf GAC 278. Inset shows a clear postsynaptic gap in a serial section. C: Conventional synapses from multiple motif C cells onto rod BC 342. D: Motif C2 diagram. Conventions as in Fig. 1. Scale bars = 20 μm in A; 200 nm in B,C.
Motifs C3, C4, and C5: OFF cone BC → AC → AC → rod BC
Depolarization of ON cone BCs by light would lead to hyperpolarization of rod BCs in the single-stage AC inhibitory motifs C1 and C2. But light hyperpolarizes OFF cone BCs, so single-stage OFF channel inhibition would be unable to antagonize rod BC light responses and would instead add to them. But none of the single-stage, cone BC-driven motifs of rod BCs found (n = 164) originates with OFF cone BCs alone. Instead, OFF cone BCs inhibit rod BCs with two-stage inhibitory motifs that concatenate ACs, so rod BCs are likely inhibited when OFF cone BCs are hyperpolarized by light. Two of these motifs (C4,C5) specifically target AI ACs with the result that cones can access C motif pathways to drive inhibition through every AC synapse on every rod BC terminal.
Motif C3 (n = 6) engages a remarkable but sparse network. OFF cone BCs drive both narrow-field OFF GACs (Fig. 7A,B) and wide-field OFF γACs (not shown) that form the total synaptic input to bistratified γACs in the OFF IPL (Fig. 7C). We have not discovered any BC input to these bistratified γACs. Since our connectomics resolution (2 nm) in the projection TEM images of volume ensures that we do not miss any synapses (Marc et al., 2014b) and since γAC 5281 is largely contained within the RC1 volume, it appears that it truly lacks any BC input. Motif C3 bistratified γACs are then presynaptic to ON cone BCs (Fig. 7D), multiple rod BCs (e.g., Fig. 7E), and other ACs and ganglion cells (not shown) in the ON layer. The bistratified γACs are wide-field cells that likely spike; thus, each may inhibit a large patch of rod BCs. Cell 5281 makes inhibitory synapses onto five rod BCs (cells 516, 518, 10625, 10959, 10960) but receives input from none of them. In addition, cell 5281 is unusual among ACs in receiving somatic synapses from other ACs. Figure 7F shows the soma of γAC 5281 at section 061 in the volume, which is labeled for GABA signals (Anderson et al., 2011b) and also shows two synaptic boutons. Figure 7G,H summarizes the four synapses that target the soma. Two are definitely GABA + (tracing through CMP sections) and the others are likely glycinergic. The net gain for the C3 motif is n2p2 (Fig. 7I). We have identified six candidate motif instances in RC1 and estimate that each rod BC receives one or two such contacts.
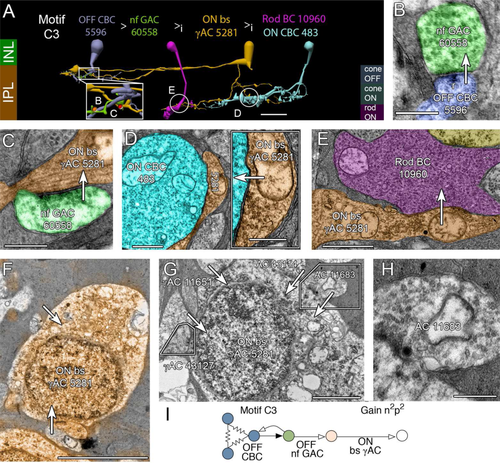
Motif C3. A: Disynaptic inhibition between an OFF cone CBC (steel) and a rod BC (10960, magenta) mediated by a narrow-field (nf) glycinergic amacrine cell (GAC, green) and a bistratified (bs) γAC (orange) that only receives inhibitory input. The bs γAC is also presynaptic to ON CBCs (cyan). B: OFF CBC 5596 driving nf GAC 60558. C: Conventional synapse from nf GAC 60558 to bs γAC 5281. D: ON bs γAC targeting ON CBC 483. Inset, enlarged synapse. E: ON bs γAC targeting rod BC 10960. F: GABA channel signal (orange) superimposed on the soma of ON bs γAC surrounded by gray Müller cells. Arrows indicate dendro/axosomatic synapses. G: A composite of three sections to visualize four dendro/axosomatic synapses (11651, 11683, 43130, 43114) onto AC 5281. Polygons denote spliced sections. H: Enlargement of synapse from AC 11683. I: Motif C3 diagram. Conventions as in Fig. 1. The gain for disynaptic chains is n2p2. Scale bars = 20 μm in A; 500 nm in B,C, inset in D, H; 1000 nm in D,E; 5 μm in F,G.
Motif C4 was a completely unexpected inhibitory path (Fig. 8), and is the OFF paramorph of ON motif C1. In this motif, wide-field γACs (n = 86) target the proximal OFF-layer zones of AI AC dendrites in ring-like clusters (Fig. 8A,B). Each AI AC receives ≈60–100 such synapses (cell 591 n = 118, cell 4943 n = 108; cell 5303 n = 68; cell 4850 n = 75; cell 308 n = 75). The true mean is likely a supremum (i.e., closest to the maximum value) rather than a simple arithmetic average of the sample, as the cells with lower numbers of synapses have distal processes that leave the edges of the volume. Most of the instances we have been successful in tracing (Fig. 8C) are driven by OFF cone BCs (n = 41 cases involving 53 ribbon contacts), and/or provide OFF cone BC inhibition (n = 48 cases involving 72 AC synapses), suggesting they are driven exclusively by OFF BCs both inside and outside the volume or through untraced branches. One example was found to be presynaptic and another postsynaptic to ON cone BCs and it is possible that these untraced branches arise from ON-OFF ACs. The bias for OFF over ON input to AI ACs through the disynaptic inhibitory path is at least 9:1 however. Motif C4 synapses onto AI ACs are also among the very largest inhibitory synapses in the retina, with presynaptic areas of 2 μm2 or more in some cases (Fig. 8D). All target AI cells were validated by mapping their rod BC connectivity (Fig. 8A,E,F). The net gain for the C4 motif is n2p2 (Fig. 8G).
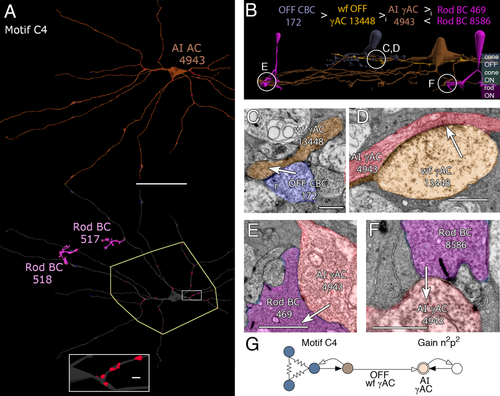
Motif C4. A: Top, AI AC 4943 in orange, the target of motif C4. Bottom, reflected image in gray with all AC postsynaptic densities (PSDs) in red. The polygon circumscribes the cell's OFF sublayer dendrites. Two of the input/target rod BCs (517, 518 magenta) of the AI AC define the ON sublayer dendritic zone. Rectangular inset shows clustered PSDs. B: Path from OFF CBC 172 (steel) to OFF wf γAC 13448 (orange) to AI γAC 4943 (red) to rod BCs 469 (shown, magenta) and 8586 (not shown). C: OFF CBC 172 to OFF wf γAC 13448 ribbon synapse. D: Giant conventional synapse from OFF wf γAC 13448 to AI γAC 4943. The image is the fusion of two adjacent slices. E: Small conventional synapse from AI γAC 4943 to rod BC 469. F: Ribbon synapses from rod BC 8586 to AI γAC 4943. G: Motif C4 diagram. Conventions as in Fig. 1. Scale bars = 50 μm in A; 1000 nm in A, inset, C–E; 500 nm in F.
Motif C5 is the OFF paramorph of ON motif C2 and uses OFF cone BC-driven narrow-field GACs to target AI γACs (Fig. 9A-C; n = 4). We have fewer of these since the OFF layer is positioned between our glycine + slices and few processes successfully traversed deeper for validation. Thus, it is very likely that they are far more common than we can currently document, as there are >700 regex instances of C4 + C5 motifs. Every identified AI γAC in the volume has been shown to have multiple C4-like and C5-like synapses on its OFF-layer dendrites proximal to the soma, meaning that both fine-grain glycinergic and coarse-grain GABAergic suppression converge on AI ACs. Tabulations of every synapse onto AI γACs (e.g., cell 4943) reveals that motif C4 + C5 inhibitory synapses outnumber the AI cell's rod BC excitatory inputs in the volume by 9:1. AI γAC 4943 contacts 11 rod BCs in the volume and receives 12 ribbon synapses. It also receives 108 inhibitory synapses in the OFF layer and itself makes 29 feedback synapses onto rod BCs. There are no AI γACs that lack this massive crossover inhibitory drive.
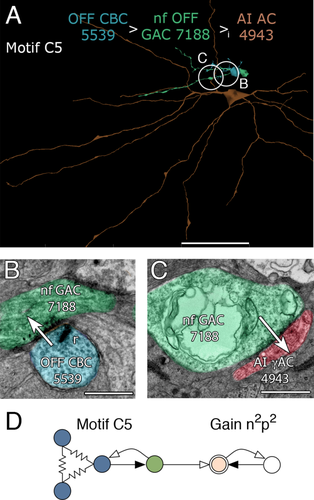
Motif C5. A: AI AC 4943 (orange), the target of motif C5 cells OFF CBC 5539 (steel) and nf OFF GAC 7188 (green). B: Ribbon synapse from OFF CBC 5539 to nf GAC 7188. C: Giant conventional synapse from OFF nf GAC 7188 to AI γAC 4943. D: Motif C5 diagram. Conventions as in Fig. 1. Scale bars = 50 μm in A; 500 nm in B; 1000 nm in C.
Motif CR: Cone BC ↔ AC ↔ Rod BC
This motif is rare compared to the other C motifs. We have only found two instances and it is the only bidirectional motif we have discovered (Fig. 10A): presynaptic and postsynaptic to rod BCs (Fig. 10B) and ON cone BCs (Fig. 10C,D). Its synaptic gain is n2p in either direction (Fig. 10E). All somas appear to originate outside the volume.
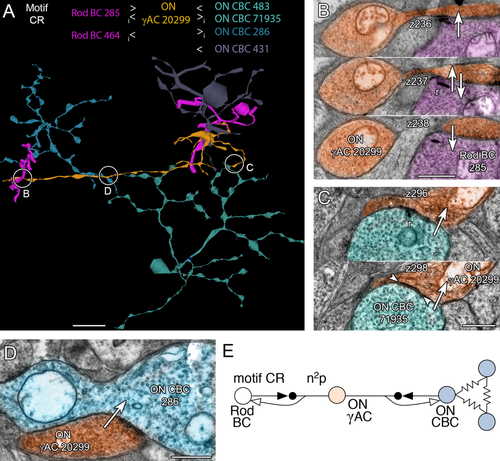
Motif CR, dual rod-cone inhibition through a single γAC. A: Rod BCs (285, 464, magenta) presynaptic and postsynaptic to a γAC process (20299, orange) that is also presynaptic and postsynaptic to an array of ON CBCs (286 steel, 71935 cyan, 483 and 431 not shown). B: A serial section run showing ON γAC 20299 postsynaptic to ribbon synapse (z236), both presynaptic and postsynaptic (z237), and presynaptic (z238) to rod BC 285. C: A serial section pair showing a synaptic ribbon from ON CBC 71935 to ON γAC 20299 (z296) and the extensive PSD of ON γAC 20299 (z298). D: ON γAC 20299 presynaptic to ON CBC 286. E: Motif CR. Conventions as in Fig. 1. Note that the gain is symmetrical. Scale bars = 10 μm in A; 1000 nm in B–D.
Motifs R1, R2, R4, R5: Rod BC → AC → AC → cone BC
The main rod → cone suppression motifs are logical extensions of networks we already know well. Part of the motivation for considering them is based on the fact that rod suppression of cones has a distinct spatial scale (Ingling et al., 1977; Buck, 2004) consistent with the size of interaction zones we see in RC1. Four rod BC to cone BC suppression motifs (R1, R2, R4, R5) engage AII GACs, which form sign-conserving gap junctions with most ON cone BCs and conventional glycinergic inhibitory synapses with most OFF cone BCs, thereby gaining access to most cone BC channels.
Due to this differential connectivity, AII GACs drive ON and OFF cone BCs with opposite polarity. AII GACs are also postsynaptic but never presynaptic to rod BCs, thereby capturing rod pathway excitatory signals and injecting them antagonistically into ON and OFF cone BCs. Via the rod BC → AII GAC → ON and OFF cone BC pathways, motifs R1, R2, R4, and R5 could inhibit all classes of cone BCs with high gains. Motifs R1 and R2 and the R paramorphs of motifs C1 and C2 use AII GACs via ON cone BC coupling to indirectly access cognate cone wide-field γAC pathways that inhibit distant fields of ON cone BCs (Fig. 11) and cone narrow-field GAC pathways that inhibit near fields of ON cone BCs (Fig. 12). All cone BC-driven γACs form these motifs, including motif C1 and non-C1/C2 cone feedback ACs that do not target rod BCs (the majority, as shown below). Similar sets of motifs, R4 and R5 (paramorphs of C4 and C5), use AII GAC glycinergic inhibition of OFF cone BCs to access cognate cone γAC pathways that inhibit distant fields of OFF cone BCs (Fig. 13) and cone GAC pathways that inhibit near fields of OFF cone BCs (Fig. 14). In total, we have mapped 3,541 R motif instances emanating from 39 AII GACs in RC1, initiating in 143 CBb and 97 CBa cells then connected to surrounding BCs via AC contacts. Each instance should be immensely potent at inhibiting surround cones as a single fully mapped cone bipolar cell, e.g., CBb5 593, can drive at least 200–300 distinct AC processes from its 194 synaptic ribbons (Lauritzen et al., in preparation).
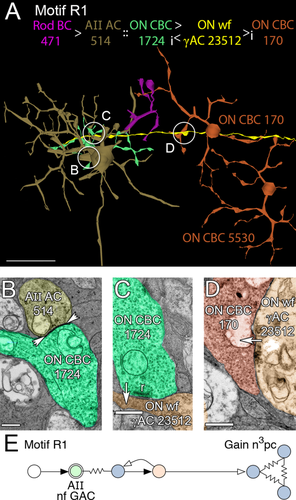
Motif R1. A: Path through a rod BC (471, magenta) presynaptic to an AII AC (514, gold, synapse not shown), in turn coupled to an ON CBC (1724, green). ON wf γAC 23512 (yellow) is postsynaptic to ON CBC 1724 and presynaptic to a patch ON CBCs through CBC 170 (copper). B: A gap junction (arrowheads) between AII AC 514 and ON CBC 1724. C: Parallel section through a ribbon synapse from ON CBC 1724 to ON wf γAC 23512. D: Synapse from ON wf γAC 23512 to ON CBC 170. E: Motif R1. Conventions as in Fig. 1. Note that the gain is increased by a factor of n over C motifs due to the additional bipolar cell synapse, and modified by the resistive coupling gain c. Scale bars = 50 μm in A; 500 nm in B–D.
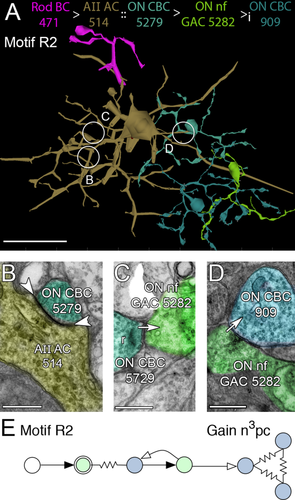
Motif R2, the glycinergic variant of motif R1. A: Path through rod BC 471 to AII AC 514, coupled to ON CBC 5279 (cyan), then presynaptic to ON nf GAC 5282 (yellow green) which is ultimately presynaptic to ON CBC 909 (blue). B: A gap junction (arrowheads) between AII AC 514 and ON CBC 5279. C: Parallel section through a ribbon synapse from ON CBC 5729 to ON nf GAC 23512. D: Synapse from ON nf GAC 23512 to ON CBC 909. E: Motif R2. Conventions as in Figs. 1 and 11. Scale bars = 50 μm in A; 500 nm in B–D.
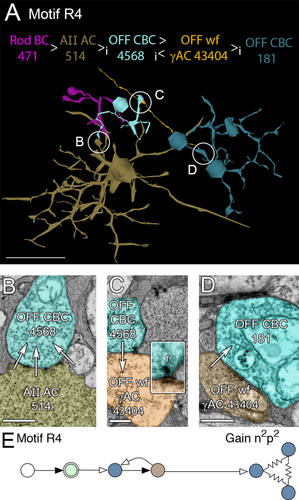
Motif R4, the OFF variant of motif R1. A: Path through rod BC 471 to AII AC 514, presynaptic to OFF CBC 4568 (cyan), then presynaptic to OFF wf γAC 43404 (orange) which is ultimately presynaptic to OFF CBC 181 and patch of coupled OFF CBCs. B: A glycinergic synapse cluster (arrows) between AII AC 514 and OFF CBC 4568. C: Dot ribbon synapse from OFF CBC 4568 to OFF wf γAC 43404. Inset, dot ribbon synapse enlarged 2.5×. D: Synapse from OFF wf γAC 43404 to OFF CBC 181. E: Motif R4. Conventions as in Fig. 1. Scale bars = 50 μm in A; 500 nm in B–D; 200 nm for the inset in C.
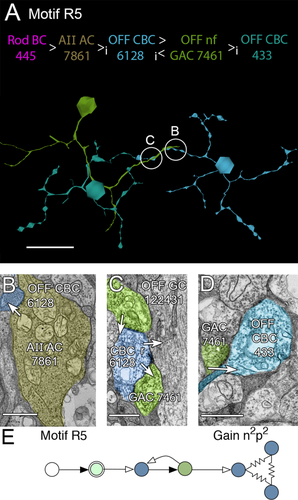
Motif R5, the glycinergic variant of motif R3. A: Path through rod BC 445 (not shown) to AII AC 7861 (not shown), presynaptic to OFF CBC 6128 (blue), then presynaptic to OFF nf GAC 7461 (green) which is ultimately presynaptic to OFF CBC 433 (cyan). B: A glycinergic synapse between AII AC 7861 and OFF CBC 6128. C: Ribbon synapse from OFF CBC 6128 to OFF nf GAC 7461 (green, lower segment); conventional synapse from OFF nf GAC 7461 (green, upper segment) to OFF CBC 6128. D: Synapse from OFF nf GAC 7461 to OFF CBC 433. E: Motif R5. Conventions as in Fig. 1. Scale bars = 50 μm in A; 500 nm in B–D.
Motif C6: ON cone BC CBb6 → AI γAC → rod BC
While it is generally thought that rod ACs only get ribbon input from rod BCs, it turns out that both AI γACs and AII GACs are also driven by sparse, wide-arbor CBb6 BCs (Marc et al., 1999a). This creates a massive pathway for cone inhibition of rod BCs via the AI γAC path. We do not show these data here as they have previously been published.
Motif R3: Rod BC → AC → cone BC
After uncovering the large-scale inhibition of rod BCs by nearby cone BCs, it became clear that patches of cone BCs might also be inhibited by adjacent rod BCs via a unique path. We discovered motif R3, analogous to motif C1 and its network dual (Fig. 15). Motif R3 ACs (n = 4) are very large caliber, wide-field γACs postsynaptic to a single or few rod BCs and many (up to 17) ON cone BCs, but presynaptic only to ON cone BCs (13 in one case) and other ACs. In particular, cell 18282 spans the entire RC1 volume and makes no synapses onto the many rod BCs it encounters, despite opportunities afforded by extensive membrane apposition. Motif R5 cells capture only sparse rod BC inputs (Fig. 15), but they are so large that they are likely spiking neurons that could spread signals as wide as their dendritic fields (>0.5 mm in diameter). If so, a few rod BCs could suppress 60–100 cone BCs over a square millimeter of retina. Like the other ON channel C motifs, the R1 motif has a gain of n2p (Fig. 15E). Thus, not all rod BCs need to drive R3 motifs to be effective, consistent with the joint distribution model proposed by Lauritzen et al. (2012).
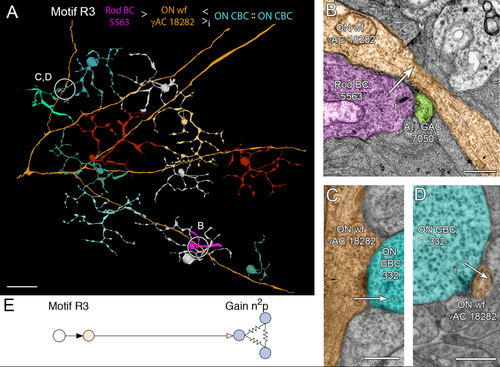
Motif R3, the rod variant of motif C1. A: Path through rod BC 5563 (magenta) to ON wf γAC 18282 (orange), presynaptic to a large collection of ON CBCs, exemplified here by ON CBC 332 (cyan). B: A ribbon synapse from rod BC 5563 onto ON wf γAC 18282 and AII GAC 7050. C: Conventional synapse from ON wf γAC 18282 to ON CBC 332. D: A ribbon synapse from ON CBC 332 onto ON wf γAC 18282. E: Motif R3. Conventions as in Fig. 1. Scale bars = 50 μm in A; 500 nm in B–D.
Motif R25 Rod BC → AII GACs → ON & OFF CBCs → ON-OFF GACs → ON CBCs
As part of an independent investigation and network exploration with Tulip, it became clear that there is a diverse collection of monostratified, narrow-field GACs that preferentially stratify near the middle of the IPL and collect inputs from both ON and OFF CBCs. As noted in Lauritzen et al. (2012), stratification is not a definitive way to predict the polarities of ACs or GCs. We have identified four classes of narrow-field, monostratified ON-OFF GACs (ON-OFF GACs 1–4) whose have arbors roughly the same dimensions as CBC axonal arbors (Fig. 16A). However, each cell has a different bias for inputs vs. outputs and cell 906 (Class 1) collects both ON and OFF BCs inputs but has a quantitative bias for targeting ON CBCs. Indeed, cell 906 arborizes in mid-IPL between the ON and OFF layers of the IPL (Fig. 16B), collects from OFF CBCs that are driven by AII GAC lobular synapses (Fig. 16C,D), and is presynaptic to CBb3 ON CBCs (Fig. 16E). Unlike the other ON-OFF GACs (Classes 2–4, which will be described more completely in future publications), the Class 1 cell 906 collects input from CBb5 ON CBCs (Fig. 16F,G), which are heavily coupled to AII GACs (Fig. 16H). The input from CBb5 cells comes not from GAC 906 dendrites dipping into the deep ON layer, but rather from rather crossing axonal ribbons (see Lauritzen et al., 2012). CBb classes vary in their coupling to AII GACs, so there may be asymmetries in the potential for rod drive between sources and target cells: the crossover permitted by Class 1 ON-OFF GACs may allow rod-rich cone BC pathways to inhibit rod-poor pathways in rabbit. The gain of this pathway is n3pc, like motifs 2 and 5. Of course it is not at all clear what role the OFF signal might play, but it is possible that it is not as important in rod suppression of cones as it is ON-OFF crossover to correct for signal rectification in GCs (Werblin, 2010).
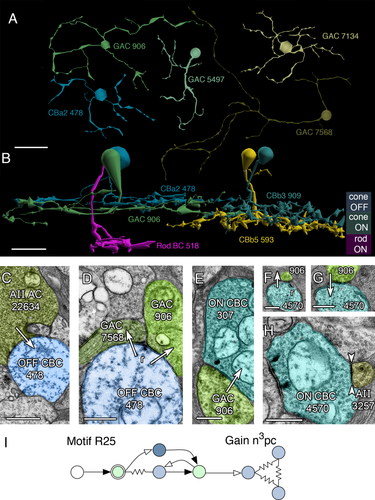
Motif R25, the ON-OFF variant of motifs R2 and R5. A: Four monostratified ON-OFF GACs (906, 5497, 7134, 7568) and CBa2 478. B: Stratification of GAC 906 compared to rod BC 518, CBa2 478, CBb3 90 and CBb5 593. C: Glycinergic synapse from AII AC 22634 to OFF CBC 478. D: Ribbon synapse from OFF CBC 478 to GACs 906 (class 1) and 7568 (class 4). E: Synapse from class 1 ON-OFF GAC 906 to ON CBC 307. F: Axonal ribbon from CBb6 ON CBC 4570 to GAC 906. G: Conventional synapse from GAC 906 to ON CBC 4570. H: Gap junction (between arrowheads) between ON CBC 4570 and AII AC 3257. Motif R25. Conventions as in Fig. 1. Scale bars = 20 μm in A; 10 μm in B; 1000 nm in C; 500 nm in D-F,H.
Exploration of network motifs
RC1 is an open-access dataset that includes raw image data, annotation display, a spatial database of structures, and software for visualization. But even with access, including a mature dataset of prior annotations, how would one explore it? Our analysis of crossover motifs provides a guide for extracting both quantitative and qualitative data. We first built network visualization tools for our internal use based on the Graphviz toolset (graphviz.org), but the size of the volume imposed challenging performance demands. In brief, we have found the Tulip environment (tulip.labri.fr), designed to manage large datasets, exceptionally powerful for our needs and amenable to customization via Python scripts (python.org, RRID:SCR_008394). This section of the results introduces how to visualize RC1 networks in Tulip and summarizes key findings Tulip has enabled.
At this writing, RC1 contains 1.3 million annotations, 12,519 nodes, and 26,540 edges. Tulip provides a rapid method for extracting and analyzing relationships among the different nodes (cell classes) and edges (synaptic, adherens, gap junction, and other node adjacency classes). If one wished to visualize the dense mesh of networks, searching a table or conventional 2D adjacency matrix is challenging and time-consuming and is usually restricted to 1-hop correlations, but there are a range of alternative graphical layout algorithms. Random layout schemas are adequate for small networks, but the scale of nodes and edges in RC1 make a random layout unusable (Fig. 17A). What we seek are layouts that aggregate related nodes and edges and separate them from other dense nodes, such as the hierarchical bubble-tree layout (Grivet et al., 2006) that puts heavily connected nodes at the hub of a circle and its immediate relatives on its rim (Fig. 17B). The important feature of this approach is that it positions related edges and nodes into distinct hubs in a fast, reproducible way. But it doesn't necessarily provide enough separation for visualizing relationships across hubs, and many of them overlap. Avoiding this “clutter” is the domain of a set of approaches known as force-directed graphs that treat the database of connections as a physical model of repulsions and attractions. The Frutcherman–Reingold (FR) algorithm (Frutcherman and Reingold, 1991) leads to excellent hub separation (Fig. 17C) and, when combined with edge-bundling (e.g., Holten and van Wijk, 2008) to decrease the clutter of paths between nodes, creates a very clean layout of RC1 (Fig. 17D). We also used a faster algorithm, the Fast Multilevel Multipole (FMM) approach with edge bundling that leads to good edge but not node separation (Fig. 17E), which can be simplified by deleting unrelated partners for a specific network or specifying a node and a series of hops (1, 2, etc.) to other nodes (Fig. 17F). It is very important to understand that these graphs are not spatial layouts of the retina but rather layouts of the retina's connection graph.
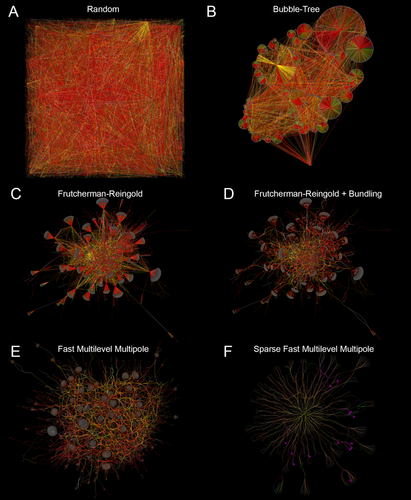
Tulip visualizations of the complete RC1 annotation set using different layout algorithms. Dataset of 1.25M annotations, 12274 nodes, and 18690 edges. Color rules are associated with different cell classes and are dominated by red γAC edges. A: Random node display. B: The bubble-tree hierarchical layout places heavily connected nodes at the hubs of circles and children on the rim. C: The Frutcherman-Reingold algorithm using force-directed layouts. D: The Frutcherman-Reingold layout with bundling of related edges into single cables. E: A fast multilevel multipole (FMM) layout uses a force-directed approach with partitioning to achieving faster solutions. The node neighborhoods are surrounded by tracts of edges. F: By reducing the number of nodes and edges to those associated with a single rich node, a simple layout is achieved.
One can start with any node. We used ON cone BC 6120 (Fig. 5) to illustrate a canonical C1 motif, and initially used Kamada–Kawai (KK) graphing (Kamada and Kawai, 1989) which, despite overlap, fortuitously spread out cell 6120's 2-hop neighborhood (Fig. 18A). When queried for the connected rod BCs, the graph exposed four of them. It is important to understand that we did not intentionally trace the paths to all four ab initio as part of some guiding hypothesis: three of the paths were discovered as incidental to other network tracing activity. Indeed, for future automated tracing (which is not yet possible), paths will be mapped opportunistically and not intentionally, so the only way to discover network motifs is through graph exploration. It is also worth noting that the incompletely mapped 2-hop neighborhood of this ON cone BC in retina connects 1,909 other nodes (cells), mostly wide-field γACs coming from outside the volume. Using a serial KK → FR graph step forced a better separation of the key hub partners of cell 6120, which is separated from four immediate neighbor coupled ON cone BCs, a large target ON GC, and a massive feedforward target interstitial γACs (IAC) system that also mediates extensive AC-GC coupling (Fig. 18B). Notably the C1 motif connections of ON cone BC 6120 are mixed in the sea of edges between the major hubs.
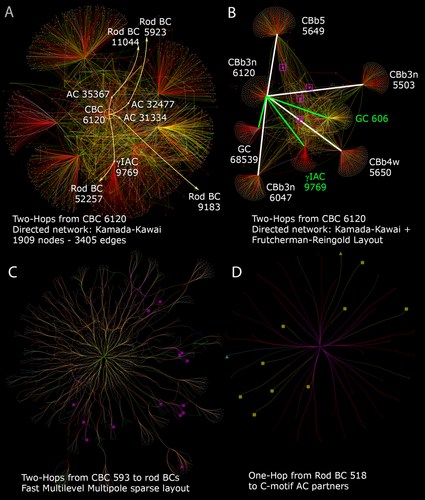
Crossover network discovery using Tulip. A: Two-hop AC paths (pale yellow) between C1 motif ON CBC 6120 and four rod BCs (5923, 11044, 9183, 52257). Kamada-Kawai force-directed layout. B: Frutcherman-Reingold modification of panel A showing the key ON CBC hubs to which CBb 6120 is connected (white edges) and two major targets it drives with heavy synaptic ribbon contact (green edges). The ON CBC → AC → rod BC hops are embedded in the intervening mesh (magenta). C: Sparse two-hop network (excess unrelated cells pruned) based on ON CBC 593 using the FMM layout and edge bundling. ON CBC → AC → rod BC paths to 14 rod BCs (magenta squares) are exposed. D: Sparse one-hop network (excess unrelated cells pruned) based on Rod BC 518 using a stress-majorization layout and edge bundling to reveal 11 connected CBC-driven (non-AI) ACs (large bright icons).
We can also select richer BCs as nodes since cell 6120 has not been fully mapped. ON cone BC 593 had been completely mapped previously in an attempt to define the projective field of a BC: i.e., mapping all the output partners of one BC. Taking the 2-hop neighborhood of cell 593 with FMM graphing, bundling, and pruning of unrelated cells reveals that this ON cone BC drives no fewer than 14 C1/C2 motifs (Fig. 18C). It is likely that the true number of motifs driven is higher since many of the ON cone BC → AC hops from cell 593 terminate due to unfinished tracing. But assuming the average ON cone BC drives at least 10 C1/C2 motifs and that there are over 100 ON cone BCs in RC1, it is reasonable to conclude that there are no fewer than 1,000 C1/C2 motifs in the volume. Since we have about 100 rod BCs, that suggests at least 10 apiece. Taking heavily annotated rod BC 518 and tracing its inputs, we find 11 AC partners sourced by ON cone BCs (Fig. 18D), consistent with the mean of five completely annotated rod BCs (12 ± 4 motifs, mean ± 1 SD, n = 5 rod BCs). While these motifs appear sparse in the context of all their surrounding connections in the retina, they are actually abundant on a per/rod basis.
A different way to use network graphs is to expose a motif in the entire dataset. Using Python regex plug-ins for Tulip developed at the University of Utah Scientific Computing and Imaging Institute, we are able to select various motifs in the midst of all RC1 connections. With a bubble-tree display we show the labeled ON cone BC → AC → rod BCs C1/C2 motifs in RC1 (Fig. 19A). There are many more such motifs that are incompletely labeled and not displayed. So we can now ask the question of whether there are any such 2-hop paths starting with OFF cone BCs. And amid the >12,000 nodes and >26,000 edges, we found one candidate (Fig. 19B). The power of the network graph approach is that we are immediately able to jump into the ultrastructural volume to examine a graph connection. In this case we discovered an annotation error: the candidate OFF cone BC path was not valid. There are no pure OFF cone BC → AC → rod BC paths. However, graph exploration found ON-OFF GACs that form C2 motifs, suggesting that the ON cone BC arm is always required for direct crossover to rod BCs.
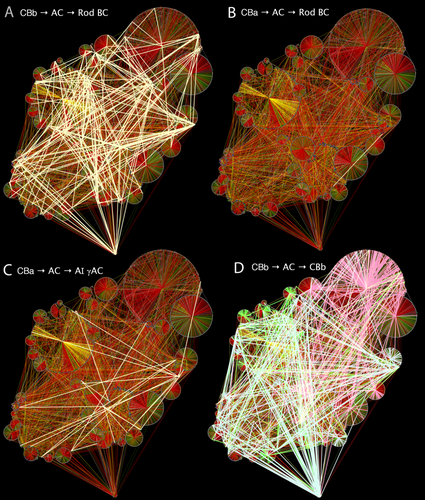
Complete RC1 datasets displayed as a bubbletree with successful 2-hop motif test paths in pale yellow edges. A: Class C1/C2 ONC CBC motifs (CBb → AC → rod BC). B: Test for OFF 2-hop motifs (CBa → AC → Rod BC) exposes one candidate. Upon analysis this proves to be an annotation error. C: Test for OFF 2-hop motifs (CBa → AC → AI γAC) exposes multiple complete candidate paths, all validated. D: Test for ON CBC feedback paths (CBb → AC → CBb) that reveal hubs for CBb3 (pale blue), CBb4 (pale green) and CBb5 (pale red) cells.
C4 and C5 motifs (OFF cone BC → AC → AI γAC) are readily detected (Fig. 19C) even though many of the AC → AI γAC synapses (n = 718) have yet to be traced to their sources. Finally, the basic ON cone BC feedback network in RC1 (ON cone BC → AC → ON cone BC) is extremely rich and breaks out into functional clusters that correlate directly with major ON cone BC classes (CBb3, CBb3n, CBb4, CBb4w, CBb5). In general, most 2-hop inhibitory connections are made in-class (e.g., CBb3 → AC → CBb3) but many 2-hops specifically cross CBb classes (Fig. 19D). Thus, the notion of cone to rod crossover in the ON system is presaged by the class-divergence of basic lateral feedback of the retina.
Using this framework we can estimate probabilities for crossover motif discoveries in general. Assuming we have 300 bipolar cells and 300 amacrine cells in the volume, a random selection of all possible edges connecting them classes would produce 2(600)(599) or 9 × 10108190 possible networks (Harary and Palmer, 1973). If we presume that we could aggregate these according to their class motifs based on 12 known classes of BCs and ≈30 classes of ACs, we can reduce this to 2(42)(41) or 2.3 × 10518. Of course, the retina is not randomly connected, but how much noise might there be and might crossover motifs be accidents? Finding the possible versus realized motifs in any real network (known as the subgraph isomorphism problem) is one of the most computationally challenging tasks in graph theory and is especially difficult for biological systems (Wong et al., 2012). We can only crudely estimate the realized set of networks in RC1 by using specific Tulip query plug-ins to expose the number N of subgraphs induced by the richest nodes in RC1: N ≈ 1060 suggesting that, of all the possible networks such a diverse set of nodes could admit, only about 0.1% are actually realized. If we assume that we could classify all the randomly generated networks (computationally infeasible at present) and reduce the RC1 subgraphs to known classes, same order-of-magnitude result emerges. This is not a formal proof but it implies that the probability that crossover motifs found in multiple copies arose from a random selection is ≪0.001. Put another way, if biological noise accidentally created crossover motifs, the fact that we have found no valid OFF cone BC → AC → rod BC motifs shows that the rate of that class of noise can be no greater than (total BC feedback motifs in RC1)−1 or ≈1 × 10⁻⁴. Similar analyses can be applied to every motif and the overall conclusion is that rod-cone crossover is pervasive and sparse, and not accidental.
Synaptic weights
Although each rod BC receives ≈10 C1/C2/C3 motifs, inhibition is still dominated by AI γACs that provide 70–85% of the total inhibitory synapses on a rod BC. But the numerical fraction of synapses alone likely does not adequately reflect the strength of inhibition. The Viking annotation environment (Anderson et al., 2011a) is unique among connectomics tools and explicitly maps presynaptic and postsynaptic density (PSD) sizes and locations, allowing comparison of synapses from different cells. Figure 20 shows that rod BC PSDs to C1 inputs have much larger maximum diameters (608 ± 248 nm, mean ± 1 SD, n = 194) than rod BC PSDs to AI γAC synapses (336 ± 112, n = 132), which corresponds to ≈3-fold larger area (heteroscedastic t-test P < 10−24; Kolmogorov–Smirnov test P < 3 × 10⁻²²). If the GABA receptor cohorts of C1 and AI γAC PSDs are similar (and this is not certain), this increased area nearly equalizes the weights of C1 and AI γAC synapses onto rod BCs. Hence, these novel cone BC inhibitory surrounds onto rod BCs might inhibit rod BCs as effectively as rod BC inhibitory surrounds onto each other via the AI γACs.
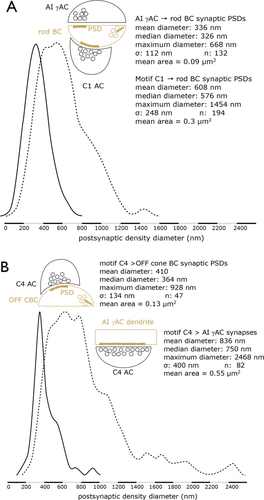
Histograms of PSDs associated with conventional inhibitory synapses. Ordinate: Peak normalized frequency. Abscissa: PSD diameter in nm A. Comparison of AI γAC and motif C1 synapse PSDs onto rod BCs. P-value for the Kolmogorov–Smirnov nonparametric test is 3.1 × 10⁻²². B: Comparison of motif C4 synapse PSDs onto AI γACs and OFF CBCs B. P-value for the Kolmogorov–Smirnov nonparametric test is 9.66 × 10⁻²⁴. Datasets available as Table_S2.pdf.
AI γACs are traditionally described as exclusively rod BC feedback cells via reciprocal synapses with rod BCs, so their potential role in rod-cone crossover suppression via C4 and C5 motifs is novel and unexpected. It is also appears to be numerically powerful. We have found 60–100 motif C4 synapses on each of five deeply mapped AI γACs. All currently identified OFF cone BC classes initiate C4 motifs. Some motif C4 synapses onto AI γAC are also the largest ever reported in retina (Figs. 8D, 9C), with PSD diameters exceeding 2 μm. Figure 20B shows the comparison of the PSD diameters of synapses made by C4 motif ACs onto AI γACs (836 ± 400 nm, n = 83) and synapses made by the same motif cells onto OFF cone BCs (410 ± 134 nm, n = 47), which corresponds to an area ratio of ≈4 (heteroscedastic t-test P < 10−13; Kolmogorov–Smirnov test P < 3 × 10⁻²⁴; here the difference between the t-test and KS is due to the clear non-normality and skew of the motif C4 sizes). This high synaptic weighting of the C4 AC synapses onto AI γAC may make this pathway especially effective. And when combined with C6 inputs, this argues that all arms of the cone pathway inhibits rods through every synapse on the rod BC terminal.
DISCUSSION
All rod and cone channels engage lateral inhibitory motifs
We have identified 13 photopic-scotopic lateral inhibitory motifs (Fig. 21) that provide both fine-grain and coarse-grain interactions among rod and cone BCs via wide-field γACs and narrow-field GACs (Fig. 22). Specifically, light absorbed by cones ultimately injects antagonistic signals into rod BCs by at least seven motifs (C1–C6, CR), and light absorbed by rods injects antagonistic signals into cone BCs by seven motifs (R1–5, R25, CR). These motifs converge on target BCs with algebraic signal polarities of antagonistic surrounds: hyperpolarizing for ON cone BCs and depolarizing for OFF cone BCs. Importantly, every rod BC mapped in RC1 receives direct inhibition from cone-driven ON γACs or GACs. Every known cone BC class drives these motifs. Thus, there appears to be no cone-driven activity in rabbit that does not lead to inhibition of rod BCs. Similarly, every cone BC receives inhibition that originates in one or more of the R1–5 motifs. There are ≈10–12 known classes of cone BCs (MacNeil et al., 2004), but we have not yet determined whether different cone BC classes have preferred rod inhibition motifs. It appears that all rod-driven activity leads to inhibition of nearby cone BCs.
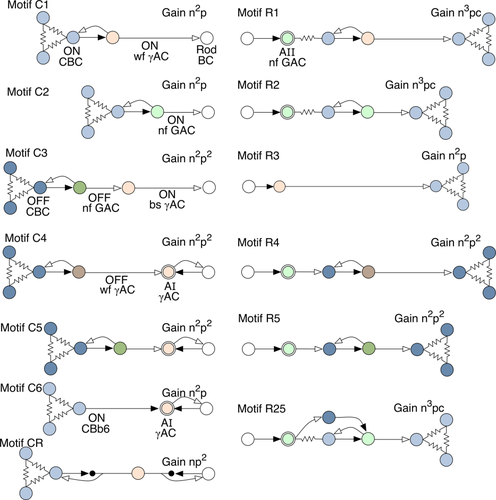
Summary of rod-cone crossover motifs. Key: white rod BC, pale blue ON CBCs, dark blue OFF CBCs, pale red ON wide-field γACs, pale red double ring AI γACs, dark red OFF wide-field γACs, pale green ON narrow-field GACs, pale green double ring AII GACs, dark green OFF narrow-field GACs, resistors denote coupling, solid arrows are glutamate synapses, open arrows are GABA/glycine synapses. Gain n denotes glutamate steps starting from the photoreceptors and ignoring polarity; gain p denotes inhibitory steps; gain c denotes coupling.
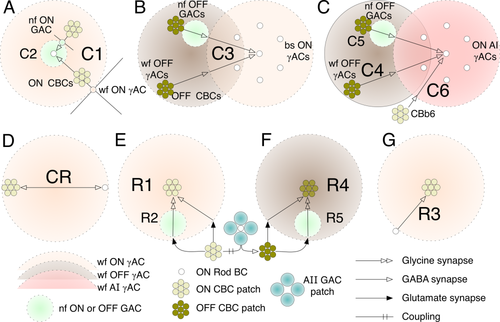
Summary diagrams of spatial motif features. Each target BC is surrounded by fields of inhibition. A: Motifs C1 and C2. Each rod BC is inhibited by both wide-field γACs and narrow-field GACs driven by patches of coupled ON CBCs. B: Motif C3. Each field of rods is inhibited by a bistratified ON γACs driven by OFF γACs and GACs. C: Motifs C4, C5, C6. Each field of rods is inhibited by cognate ON AI ACs that are themselves inhibited by wide-field OFF γACs and narrow-field OFF GACs, and directly driven by CBb6 BCs. D: Motif CR. A wide-field ON γACs is driven by and inhibits both rod and cone BCs. E: Motifs R1 and R2. Each patch of ON CBCs is inhibited by wide-field γACs and narrow-field GACs whose drive originates in displaced rod / AII GAC complexes. F: Motifs R4 and R5. Each patch of OFF CBCs is inhibited by wide-field γACs and narrow-field GACs whose drive originates in displaced rod / AII GAC complexes. G: Motif R3. Each patch of ON CBCs is inhibited by a wide-field γAC driven directly by a rod BC.
Are these all the motifs? We believe so, for three reasons. First, in mapping rod-cone cross-suppression between 104 rod BCs and 298 cone BCs, these are the basic motifs found and some are clearly dominant, e.g., C1, C4, R1, R3, with hundreds to thousands of copies. If new motifs are to be found, the probability that it is not one of those already found in our 4,766 motif examples is <0.02%. This does not mean there are none to find, but that they must be even sparser than motifs C3 or R3, for example. Certainly any new motifs could not dominate cross-suppression. Second, while there are many GAC and γAC classes we have yet to delineate (e.g., γACs selective for specific BC classes), their participation in single- or two-stage cross-suppression motifs would be subsumed in the motifs we report here (Fig. 19). Third, what about further concatenations? The above arguments make discovery of a dominant concatenated motif different from the nested synapses that all motifs already exhibit very difficult to conceive or illustrate. The extensive nesting of AC synapses in retina (Marc and Liu, 2000) implies that very long chains will be common, but that concatenations beyond two ACs will be mostly ineffective, unless unusual mechanisms exist to extract long-latency, low-gain signals (Marc and Liu, 2000; Marc et al., 2013). On balance, discovery of further motifs that would not be part of an existing form seems unlikely.
The rod BC axon terminal
It has actually been expected that, largely based on physiological data, ACs other than AI γACs would provide synaptic input to rod BCs (e.g., Chávez et al., 2010). Given our quantitative directed mapping of ≈800 AC synapses on 104 rod BCs terminals, we conclude that every rod BC is contacted by at least seven different cell classes (AI γACs, AII GACs, and ACs driving motifs C1, C2, C3, CR, and R5). Since is it clear that individual γACs serving different classes of ON cone BCs (CBb3, 3n, 4, 4w, etc.) might be functionally different but anatomically similar, and since AI γACs in rabbit are a superclass composed of S1 and S2 γACs, the true number of different contacts might be closer to 12. In any case, this is broadly consistent with a finding by Sterling and Lampson (1986) based on combinatorial patterns produced by monoclonal antibodies targeting four unspecified antigens: that rod BCs in cat contact eight different types of synapses. However, we do not support their argument that all non-AII GACs are reciprocal and receive ribbon input. Indeed, C1, C2, and C3 motifs do not make ribbon contacts in rabbit. This could be a difference in wiring between carnivores and lagomorphs.
C2 motifs also partly explains the presence of glycine-activated anion currents on mammalian rod BCs (Chávez and Diamond, 2008; Mørkve and Hartveit, 2009; Moore-Dotson et al., 2015). All of the C2 motifs we have found (but one) are driven exclusively by ON cone BCs. That one instance, cell 5280, is driven by six different ON cone BCs and receives a single OFF cone BC ribbon as it passes through the OFF layer. This may explain why Chavèz and Diamond (2008) find that both ON and OFF bipolar cell pharmacologies can drive glycine currents on rod BCs, but our data show that the ON system is the dominant driver. Ultimately, the real effect of crossover will have to be determined physiologically using a mesopic preparation, which is a very challenging proposition. But given the different weights and timing attributes of GABAA, GABAC, and glycine receptor-driven currents on rod BC terminals (Moore-Dotson et al., 2015), the potential for cones to partly suppress rod light responses would seem substantial. The obvious next option is to build a model of the rod BC terminal using the synapse numbers and weights we have described and the current collection of receptor features (Chávez and Diamond, 2008; Chávez et al., 2010; Moore-Dotson et al., 2015).
Another issue of import regarding rod BC terminals is that we cannot yet distinguish class S1 and S2 cells that together form the AI γAC superclass. As shown by Vaney (1986) using in vivo serotonin loading and Zhang et al. (2002) with confocal imaging of AI γAC, rod BC and GABA receptor markers, an S1 γAC has an arbor about 5–10× the diameter of our RC1 volume and an S2 γAC has an arbor about 2× the diameter of RC1. Thus, we do not expect to be able to differentially map their arbors using existing connectomics technologies. Neither is there a distinctive feature that enables us to discriminate their somas. There are ≈13 AI γACs in the volume validated by their contacts with rod BCs, but those cells would have most of their rod BC contacts outside the volume. As the S1/S2 ratio in rabbit retina is ≈1:1 (Vaney, 1986) and every AI γAC in RC1 is studded with ≈100 C4 and C5 motifs, we conclude that crossover networks control both S1 and S2 AI γACs. Based on the calculations of Zhang et al. (2002), the majority of the presynaptic AI γAC terminals in the volume will come from class S2 cells and we do not yet have a signature that distinguishes them. However, we do have instances of small gap junctions between AI γAC processes and this may help us map the more strongly coupled S1 AI γACs (Li et al., 2002; Zhang et al., 2002). But our basic conclusion is that both S1 and S2 AI γACs are targets of crossover motifs driven by OFF cone BCs. The puzzling feature of this connectivity is the view that AI γACs are not electrotonically compact (Grimes et al., 2010) and that their synaptic terminals act independently. But our data suggest that this cannot be true, especially for the core dendrites. The superabundance of C4 and C5 synapses is not consistent with a noncompact model and it may be that the nearest processes of AI γACs, which are actually quite large in caliber, are strongly influenced by C4/C5 connections. This could make the central core of the S2 AI γAC in particular very compact, and since S2 cells dominate the synaptic input to rod BCs (Zhang et al., 2002), cone to rod crossover via the OFF pathway could be quite effective. Why S1 AI γACs have C4 and C5 motifs remains unclear if such signals cannot reach their terminal endings. And it is further puzzling that S1 AI γACs engage in homocellular coupling (Li et al., 2002) if they are electronically noncompact. C1 motifs are driven by wide-field γACs whose processes are often an order of magnitude thinner than the large dendrites of AI γACs, yet must be effective over 100 μm or more since the spacing of inputs and outputs is very sparse along some of the longest C1 processes that span the entire RC1 volume. Of course it is expected that wide-field, cone BC driven cells will be spiking neurons. Clearly, more exploration of AI γACs is in order. We suspect that AI γACs are far more compact than previously modeled.
Rod-cone cross-suppression motifs are consistent with winner-take-all decision networks
Mutual rod-cone suppression during mesopic state in humans appears to operate in a winner-take-all mode (e.g., Stabell and Stabell, 1998, 2002) and such networks are classically considered inhibitory (Yuille and Grzywacz, 1989; Bogacz, 2007b; Kurt et al., 2008; Oster et al., 2009). Inhibitory networks can be wired as feedback, feedforward, and lateral inhibitory motifs, each with opportunities for nesting (Marc and Liu, 2000; Marc et al., 2013). Currently, there is no known synaptic motif uniquely associated with winner-take-all networks, but strong lateral inhibition between different channels is an absolute requirement. The finding that crossover motifs involve significantly larger PSDs (even when the same AC makes synapses on noncrossover targets) implies that the crossover networks are more potent. We have arguably found the first complete candidate motifs for winner-take-all operations ever documented in retina and have shown that they are pervasive (over 7,000 instances in RC1). These motifs comprise lateral inhibition across separate parallel processing streams, a predicted hallmark of winner-take-all architecture. Importantly, these results suggest that winner-take-all architectures are not single motifs, but rather collections that perform network quorum operations for a patch of the retina or, by extension, for a volume segment of brain. Since it is difficult to conceive of any other motifs that could dominate rod-cone cross-suppression, we believe the most important question is: Why are there are so many types and what aspects of crossover-suppression does each mediate? The answer to that is undoubtedly hidden in the fine-scale physiological tuning of each motif.
Bipolar cell inhibition is mediated by GABAA, GABAC, and glycine receptors that activate chloride currents (Eggers and Lukasiewicz, 2006; Chávez and Diamond, 2008; Chávez et al., 2010; Eggers and Lukasiewicz, 2010; Moore-Dotson et al., 2015). We can roughly assess the magnitudes of those currents based on PSD sizes, presumed channel conductances, and synaptic chain amplification. Synaptic chain amplification is a gross measure of a motif's likely power and is based on the idea that glutamate gated cation current gains are usually ≫1 (Copenhagen et al., 1990; Yang and Wu, 2004) and that inhibitory synaptic gain are <1 (Wu, 1991; Maltenfort et al., 1998). Thus, glutamate gains of n2 are common to all C motifs, but ON cone BC motifs are more powerful than OFF cone BC motifs by a factor of 1/p on a per-instance basis. The price of inverting the OFF the signal could be balanced by increasing synapse numbers. This may explain why C4 and C5 motifs are several-fold more abundant than C1 or C2 motifs. Considering the R1, R2 and R4, R5 chains suggests that they should be more potent than ON channel C motifs by a factor of ≈n/p, which may equalize them (ON C motif chains have a gain of n2p and R motif chains have a gain of n3p2 or n3pc). But the ultimate key to winner-take-all systems may depend less on per-chain weights or synapse density and more on timing (e.g., Moore-Dotson et al., 2015), which connectomics cannot resolve. As noted above, fine-grain stimuli that activate narrow-field GACs could control rod BCs with just a few synapses. Physiological measurement of rod-cone crossover inhibition will be essential to discover the timing features of these motifs, and we provide a cellular candidate list to guide such efforts.
Functional roles of rod-cone crossover
Remarkably, pathologic states exist that interfere with rod-cone switching networks, lending additional insight into their function. Monocular form deprivation in juvenile macaques prevents maturation of normal photopic spectral sensitivity envelopes with trichromatic opponency (Sperling and Harwerth, 1971), instead producing a simple achromatic rod-dominated envelope in the deprived eye, even at photopic levels (Harwerth et al., 1990). Human amblyopia elicits a milder defect where red-green lateral inhibition in spectral sensitivity is attenuated (Harwerth and Levi, 1977). As rods can operate at photopic levels in the absence of cone-driven suppression (Aguilar and Stiles, 1954), rod-cone crossover suppression networks may be critical in stabilizing perception and especially susceptible to altered developmental experience. These findings suggest that critical period events that have powerful effects on central mechanisms may also have exceptionally potent influences on the maturation of retinal synaptic network, presaged by the findings of Ikeda and Wright (1976) and strongly demonstrated by Tian and Copenhagan (Tian and Copenhagen, 2001; Tian, 2011).
There may be further roles of altered crossover states in retinitis pigmentosa. Cone flicker detection after dark adaptation is significantly suppressed when rod dark adaptation levels are reached (Goldberg et al., 1983). A similar paradigm where subjects were asked to detect flicker identified some subjects who experienced a marked rod inhibition of cone flicker detection with the rod inhibition of cone flicker detection absent in X-linked retinoschisis and at various levels in cases of retinitis pigmentosa (Arden and Hogg, 1985). This suggests that the remodeling or reprogramming of crossover networks in the inner plexiform layer may be engaged before it is grossly visible as a disruption of retinal architecture (Marc et al., 2013; Jones et al., 2011).
Rod-cone crossover lateral inhibitory networks may also serve hue and contrast tuning. Rabbits are photopic dichromats with blue cones and green cones (Caldwell and Daw, 1978); humans are trichromats with red, green, and blue cones. The addition of rod signals to cone pathways often mimics a blue channel (Trezona, 1970; Buck, 1997, 2014) and, in principle, rod BC inhibition motifs surrounding cone BCs in rabbit could form de facto green cone center / blue-cone-mimicking rod surround networks. We have shown that all cone BCs engage crossover suppression, so blue-cone driven ON cone BC/rod BC opponency should also exist, perhaps via motif C6, consistent with the observation that rod interactions can lead to a wide range of hue shifts in humans (Stabell and Stabell, 2002; Thomas and Buck, 2006), likely through both opponent and additive (Buck, 2014) processes. These chromatic percepts can even be induced in blue cone monochromacy (Young and Price, 1985), where the only possible opponent pigment is rhodopsin, yielding pure blue/rod opponent systems.
Future directions
Rabbit rod-cone interaction architectures are relevant for primates, as human rod-cone interactions involve peripheral retina (Trezona, 1973; Buck, 2004; Thomas and Buck, 2006), a region stereotyped across mammals (Jeon et al., 1998). Although the human foveola is rod-free (Curcio et al., 1987) and lacks AII GACs (Kolb et al., 2002), the rod-free zone is so small (≈0.2 mm) that crossover motifs from wide-field γACs (Bloomfield, 1992; MacNeil et al., 1999) could certainly reach surrounding rod networks and some GAC networks likely could as well. A definitive proof will require assembly of a primate retinal connectome.
ACKNOWLEDGMENTS
We thank Hope Morrison and many other analysts for cell tracing. Funding sources include NEI R01 EY02576, R01 EY015128, P30 EY014800 Vision Core Grant, T32 EY024234 Vision Training Grant (REM); the Calvin and JeNeal Hatch Presidential Endowed Chair (REM); an unrestricted grant from Research to Prevent Blindness to the Moran Eye Center; a Research to Prevent Blindness Career Development Award (BWJ). Funding for the JEOL JEM-1400 was generously provided by the late Martha Ann Healy, a friend of the Moran Eye Center.
CONFLICT OF INTEREST
REM is a principal of Signature Immunologics, Inc., manufacturer of some antibodies used in this study.
ROLES OF AUTHORS
JSL, CLS, and REM conceived and designed the study, acquired, analyzed, and interpreted the data. JSL, CLS, and REM drafted the article. JSL, REM, CLS, DPE, CR annotated, acquired, and analyzed data, and edited the article. JRA built the RC1 volume and database and created many of the Viking-associated computational tools used to analyze it. JSL, CLS, REM, JRA, and BWJ performed computational, analytical, technical, and material support. MK reviewed the psychophysical data and drafted the discussion on vision. EK and MM developed key query and visualization tools for exploration of RC1 network. REM obtained funding and supervised the study.
DATA ACCESSIBILITY
RC1 is open access. Both the entire RC1 dataset and the software required to view it are openly available through connectomes.utah.edu. Visualizing both images and annotation requires the Viking Viewer (Anderson et al., 2011a). Access to the dataset does not require that the user install the data locally. The Viking Viewer is based on a web service that requests a patch of images from the Viking server at the University of Utah and passes the necessary transforms for piecing them into a seamless display. For security we require account registration to write to the database. Read-only access may be done anonymously. The Viking database may similarly be accessed with a variety of tools. Viz Network, Viz Structure, etc., are a set of tools to explore network connectivity and cell morphology using the GraphViz API (graphviz.org). We used MatLab 2009b (mathworks.com, RRID:SCR_001622), MatLab Database Toolbox, and the MatLab Compiler to build VikingPlot as a basic 3D rendering tool. This tool is also available but requires a MatLab license. Recently, we created a faster web-based tool that requires no licensing to visualize sets of RC1 cells. Finally, we have a set of exporting tools to enable the use of free Tulip data visualization software (tulip.labri.fr) in both the network and morphology modes via web commands (connectomes.utah.edu/export/files.html) or a direct data entry mode (websvc1.connectomes.utah.edu/Export/). Searching Tulip for specific RC1 motifs requires a Python plug-in available upon request. All of the raw data are publicly available either as a direct download onto user media (≈16 Tb raw data plus ≈30 Tb optimized image pyramid files for display) or via rsync upon request. All of the final image *.psds with all layers, navigational *.xml files for every image, and data tables are publicly available at marclab.org/crxo.
RRID RESOURCES CITED
Antibodies: Signature Immunologics, Inc., Torrey, UT (www.immunologics.com); IgGs targeting 1-amino-4-guanidobutane (B100R, RRID AB_2532053), aspartate (D100R, RRID AB_2341093), GABA (YY100R, RRID AB_2532061), glycine (G100R, RRID AB_2532057), glutamate (E100R, RRID AB_2532055), glutamine (Q100R, RRID AB_2532059), or taurine (TT100R, RRID AB_2532060). Software: GraphViz (graphviz.org) developed by AT&T Research, RRID SCR-002937. Blender, (blender.org), RRID SCR-008606. Python, (python.org) Python Programming Language, RRID:SCR_008394. Matlab (mathworks.com), RRID:SCR_001622. Viking (connectomes.utah.edu/, RRID:SCR_005986).


