Analysis and Simplification of Kinetic Models for Methane Chlorination and Pyrolysis
Abstract
So far, no complete reaction mechanism has been proposed for high temperature chlorination and pyrolysis of methane. Various mechanisms for the description of this reaction pathway are combined and compared in this paper. This adaptation shows that the gas phase pyrolysis of methane and methyl chloride can be combined with surface reactions via nucleation from the gas phase or on the reactor wall to reproduce the product spectrum. In addition, kinetic parameters for a global simplified one-step mechanism focused on the formation of carbon are fitted to available experimental data.
1 Introduction
 (1)
(1) (2)
(2)Through specially designed flow arrangements, carbon deposits on the reactor wall may also be avoided, which could overcome one of the key challenges facing endothermic methane pyrolysis 2, 3. The heat released by the chlorination of a single methane molecule is much larger than that required for its pyrolysis. Methane can therefore be supplied in excess to leverage hydrogen production. The product sought is hydrogen, although solid carbon and hydrogen chloride may also be utilized in the overall integrated process. Chlorinated hydrocarbon compounds can impede the separation process, contaminate the carbon product and diminish hydrogen selectivity, therefore their formation as final products should be minimized.
The reaction pathway of methane chlorination can be modeled using a numerical approach. Gas phase reactions of both chlorination and pyrolysis occur, as well as solid formation by nucleation from the gas phase or at the reactor wall. The focus of this kinetic investigation for the chlorination reaction is directed towards the formation of carbon, since solid carbon can be regarded as an indicator of the completed reaction. By understanding the reaction network kinetics, reactors can be properly designed and unwanted by-products minimized. Fig. 1 depicts an overview of the various stages of the reaction.

Due to the high reaction temperatures, hydrogen is split off from methane giving rise to methyl radicals, which recombine to form C2 species. These can be further dehydrogenated to yield radical acetylene and subsequently form aromatics by recombination. New radicals, especially radical acetylene, can then be added to the aromatics converting them into polycyclic aromatic hydrocarbons (PAHs; hydrogen-abstraction and C2H2-addition, HACA mechanism). When PAHs collide, nucleated particles are formed, which can subsequently aggregate. At their surface, other PAHs, as well as radical species, can further react, resulting in primary soot particles. The primary particles can then coagulate and adhere to the reactor walls. In the process, the coagulated particles are rounded off by surface growth. Thereafter, the particles begin to form agglomerates with a fractal structure. Carbon formation can also proceed via a metal-catalyzed route through the bonding of the radicals to the surface of a metal catalyst, so that a carbon layer grows on it. Chlorine acts as an accelerator and has a major influence on the formation of methyl radicals. In this case, the chlorine radicals react with the hydrogen atoms of the hydrocarbons, including those with high carbon numbers, and further radicals can be formed. Tran and Senkan found that the coke from methyl chloride pyrolysis does not contain any chlorine, so it is assumed that the solid products in this work are free of chlorine 4-9.
Hardly any experimental or kinetic data or complete mechanisms for this high-temperature methane chlorination at around 1000°C or higher are available in the literature. By combining different reaction mechanisms and fitting kinetic parameters to experimental data, new models are developed here to describe the pertinant reactions.
2 Modeling
The reactions were simulated using CHEMKIN 19.1 and MATLAB R2018a. The simulations in CHEMKIN were employed to investigate the combination of different mechanisms, by comparing, large reaction networks with one another and incorporating both gas phase and surface growth reactions. The studies conducted in MATLAB were used to simplify the mechanisms and only include gas phase reactions.
 (3)
(3)If no rate constants for the reverse reactions were available, the equilibrium constants, as the ratios between forward and reverse reactions, were employed to determine them. For this purpose, the values of the free Gibbs energy and thus the enthalpy and entropy data were calculated via the corresponding NASA polynomials. Surface reactions were considered to be irreversible in this work, since none of the thermodynamic data for surface species is given to enable the calculation of the equilibrium constants.
The particles grow as a result of surface reactions and thus increase their surface area and consequently the number of reactive sites on the surface. Moreover, the particles can also collide, which can lead to coagulation. Accordingly, in order to calculate the surface area, information about the particle size distribution must be known. This was introduced via the method of moments, in a technique also used by Frenklach in the context of soot formation 4. Agglomeration of the particles is not considered in this work, corresponding to its omission in that of Skjøth-Rasmussen et al., as this phenomenon occurs late on in the process and its inclusion significantly complicates the model 10.
3 Examination and Combination of Kinetic Models
First, the gas phase mechanism for methane pyrolysis was selected. Secondly, it is augmented by various surface mechanisms and the results are compared with experimental data. According to Fau et al., the gas phase mechanism of Sinaki is the most suitable for the description of methane pyrolysis, since it offers both good accuracy and an acceptable computational effort 11, 12.
For the modeling of the particle formation, the mechanism selected is extended by a surface reaction mechanism. Here, that of Wang and Frenklach (WF-SM) is the most obvious candidate. The Sinaki mechanism is based on the gas-phase mechanism of Appel et al., which in turn is an improvement upon the gas-phase mechanism of Wang and Frenklach, for which the WF-SM was developed 4, 13, 14. The WF-SM is used with the extensions of Skjøth-Rasmussen et al. 10.
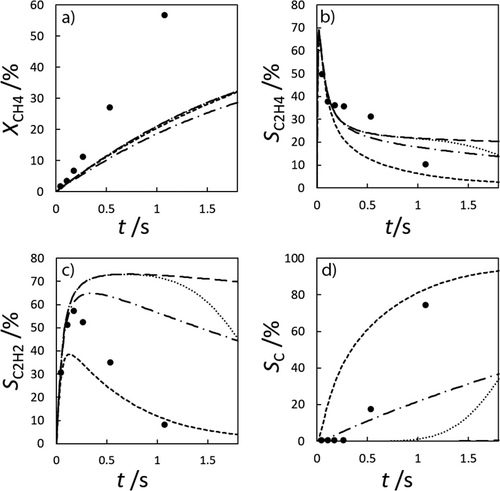
Using these mechanisms, however, the calculated carbon selectivity is only marginally above zero over the time interval considered. A possible explanation for this is that particle formation is too low when based only on this surface mechanism. Previously, the formation of carbon was described solely by nucleation in the gas phase. However, Blekkan et al. found that by performing the experiments for 10 min, a carbon layer was formed on the reactor wall 15. Surface reactions could thus take place on both the wall and also on the particle surface. Therefore, ethylene could already have reacted to form further carbon before PAHs were formed. In CHEMKIN, this problem can be resolved qualitatively by assuming that the reactor wall is completely coated with carbon, on the surface of which the same reactions can occur as on the particle surfaces. Another reason is that particle formation starts earlier than that of pyrene. This is illustrated, for example, in the surface mechanism of Agafonov et al. (A-SM), which is why this mechanism was also considered in the simulation 16. To verify the wall influence and the A-SM, Fig. 2 shows the comparison of the experimental values of Blekkan et al. with those obtained from the selectivities calculated with the A-SM and WF-SM with and without wall influence 15. The wall influence was included by adding the surface area of the reactor as an additional area for all surface reactions, apart from the nucleation reactions. In Fig. 2, it can be seen that the selectivities for ethylene and carbon, which are crucial for the surface mechanism, are best described by the A-SM. The experimental selectivities lie between the limiting cases without wall influence and with the wall completely coated with carbon.
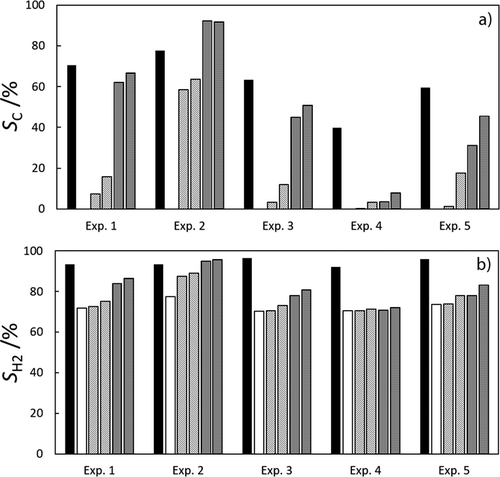
Although this comparison suggests that the A-SM is the most suitable, this model was derived from a mechanism for shock tube experiments. The same mechanisms were therefore also compared for verification purposes with the experiments of Lucas et al. 17. In the experiments shown in Fig. 3, methane was introduced into a 1 m long glass tube with a diameter of 22 mm at 1030 °C to 1092 °C. The differences within the five experiments in the data of Lucas et al. are mainly due to different temperatures, volume flows and reaction times. Here, it can be observed that the simulated concentrations are much more sensitive to such changes than the experimental data suggests. In this comparison too, illustrating the selectivities of hydrogen and carbon, the A-SM is again the most suitable option. It was thus chosen as the surface mechanism for methane pyrolysis and used together with the Sinaki mechanism for the gas-phase.
 ) and with wall influence (
 ), and the A-SM and without wall influence (
 ) and with wall influence (
 ).
).Compared to methane pyrolysis, studies of methane chlorination offer only a few mechanisms involving the formation of carbon. Most reaction pathways only consider species up to C2 or just describe the pyrolysis of chloromethanes. In this work, the mechanism of Mitchell et al. was chosen as the mechanism describing PAH formation in most detail 18. Since it only represents the reactions up to naphthalene, while carbon formation often arises from larger PAHs, it was extended with the reactions of the Sinaki gas-phase mechanism, so that, for example, the surface mechanism of Wang and Frenklach becomes applicable. In the case of identical reactions and thermodynamic data, the values of Sinaki were used, reflecting their more recent origins. The combination of these two mechanisms results in the Mitchell-Sinaki mechanism (MS-M) devised in this work. This modification is compared to the original Mitchell-Mechanism (M-M) using the experimental values of Tavakoli et al., which are shown in Fig. 4 19. However, its use of above 1500 K data is uncertain due to the questionable validity of the thermodynamic data in this range.
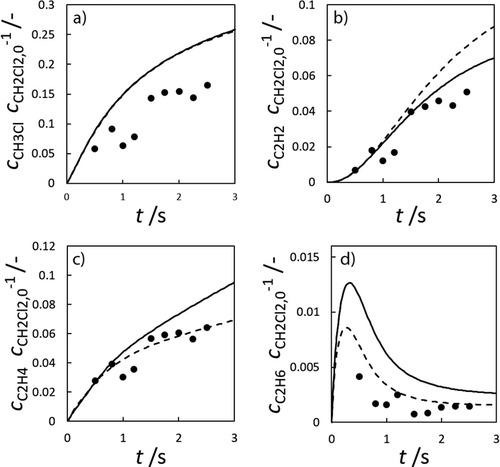
Essentially, the experimental data are well reproduced by both mechanisms. Only minor differences between the original M-M and the merged MS-M can be observed. Thus, the MS-M can be used as the gas phase mechanism for further consideration.
Since, according to Tran and Senkan, there is no chlorine in the coke produced by the pyrolysis of methane with chlorine, and the chlorine radicals participate only in hydrogen splitting reactions, the same surface mechanisms as for methane pyrolysis should be applicable 8. It is therefore assumed that the A-SM is also a suitable surface mechanism for methane chlorination. To verify this, the MS-M is compared with the experimental data of Weissman et al. for a methyl chloride pyrolysis as shown in Fig. 5 9.
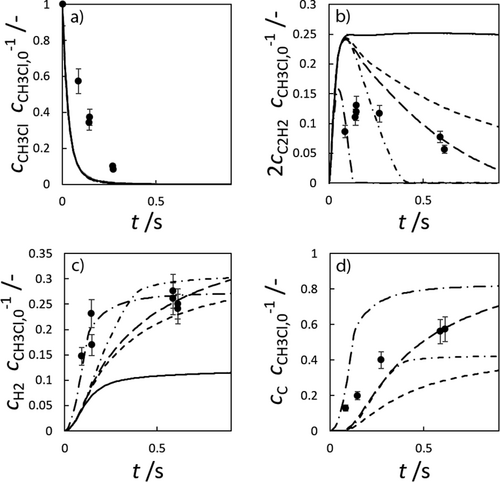
The low hydrogen and carbon concentrations and the overly high ethylene concentration could result from the fact that, due to the merging of the Mitchell mechanism with the Sinaki mechanism, the reactions proceeding from naphthalene are no longer included. The HACA mechanism for the PAH growth thus takes place more slowly, so that the ethylene concentration is too high and fewer particles are formed. To verify whether reactions with chlorine and PAHs beyond naphthalene have an effect on carbon selectivity, several of the reactions listed in Tab. 1 with the kinetic parameters given were added to the gas phase mechanism. The additional reactions are only those in which a hydrogen atom is split off by a chlorine radical, where the values were adopted according to the mechanism of Mitchell et al. 18.
|
Reaction equation |
EA [cal mol−1] |
|---|---|
|
|
1100 |
|
|
1100 |
|
|
1100 |
|
|
1100 |
|
|
1100 |
|
|
1100 |
|
|
0 |
|
|
0 |
|
|
0 |
|
|
1100 |
|
|
1100 |
|
|
0 |
In order to verify this new modified Mitchell-Sinaki mechanism (mod. MS-M), the reactions with and without wall influence are also compared in Fig. 4. Without the surface mechanism, the concentration curves obtained with MS-M and the mod. MS-M do not differ. With the surface mechanism on the other hand, the concentration of ethylene with the mod. MS-M deviates from the unmodified model. Without wall influence, the peak of the ethylene concentration is still overestimated, but the concentration drops much faster than in the experiment. The hydrogen concentration is slightly underestimated without wall influence at short residence times. With wall influence, the experimental concentrations can be matched more accurately.
From this comparison it can be concluded that the modification leads to a faster formation of carbon so that the experimental values can be found between the two limiting cases with and without wall influence, in contrast to the unmodified MS-M. The peak of ethylene is captured better, as is the concentration curve for hydrogen. For these reasons, the final mechanism used for chlorination is the mod. MS-M, with chlorine interactions up to pyrene, together with the A-SM, which was also extended to include the interaction with chlorine.
4 Simplification of Kinetic Models
The description of the reaction presented so far was carried out with mechanisms from larger reaction networks. Due to their complexity, however, these mechanisms are unsuitable for detailed flow simulations, since the computation times become excessive. Therefore, the goal of this section of the work was to create highly simplified kinetic models for methane chlorination and pyrolysis. These mechanisms will be compared with data from the literature for validation and subsequently optimized as appropriate.
Various multi-step mechanisms were created and compared with experimental data. The number of steps refers to the number of reaction equations describing the overall global reaction process. The largest set of experimental data is given by Weissman et al., who pyrolyzed pure methyl chloride and a mixture of methyl chloride and methane 9. The temperature in the reactor was set at 1260 K or 1310 K and maintained as constant as possible, with a variation of between 2 K and 25 K (0.15–2 %). A total of 6 data sets with different system pressures and temperatures are available. This data is special in that the amount of carbon formed is given, as calculated via a mass balance. Particularly noticeable in the data of Weissman et al. are the variations of the results between the individual data sets. For example, changing the pressure at 1310 K from 258 Torr to 271 Torr at constant temperature leads to a 50 % reduction of the hydrogen concentration and to 20 % less methyl chloride conversion. The influence of such deviations on the investigations presented must be treated with caution. The sum of the relative error squares between simulated and experimental data is chosen as the objective function to be minimized.
 (4)
(4)Once again, the fitting is based on the amount of carbon formed, since this can be identified as a measure for the progress of the reaction and is of particular interest in possible flow simulations. Another advantage of fitting the amount of carbon is that by analyzing several data sets an averaging is performed. Different solutions for the 1-step mechanism are listed in Tab. 2.
|
Solution |
A [s−1] * |
n [–] |
EA [J mol−1] |
|---|---|---|---|
|
1 |
1.49 |
1.30 |
2.96 |
|
2 |
3.68 · 1012 |
1.05 |
3.03 · 105 |
|
3 |
2.43 |
1.00 |
1.50 |
- * depending on the reaction order
The upper and lower limits of the pre-exponential factor and the activation energy were varied, since for the 1-step mechanism several solutions also led to very similar concentration profiles. The optimized objective function of relative errors lies in a narrow range in all cases, so that the inaccuracy of the experimental values themselves plays a greater role than the optimization algorithm. The result of the second data set, for example, can be compared, to the global methane pyrolysis mechanism from Keipi et al., which exhibited a pre-exponential factor of 8.5708 · 1012 s−1 and an activation energy of 3.37 · 105 J mol−1. The reaction order is given as 1.123. The range of validity of the kinetic parameters is between 1070 K and 1450 K 21. For n set to 1, the best fit is given in the third solution. Fig. 6 shows an example of two experimental data sets of Weissman compared to the third kinetic parameter set from Tab. 2.
In general, the simulated data shown indicate that the concentration curve is not visibly affected by temperature. At 369 Torr, the deviation between the results at 1260 K and 1310 K at t = 1 s is 5.4 · 10−3 %. Since the kinetic parameters were fitted to the carbon concentration, the concentration of methyl chloride is overestimated. This was to be expected and is inherently related to the selection of the one-step mechanism, as no other species, such as ethylene, acetylene or benzene, are formed to which methyl chloride might react. This means that the concentrations of methyl chloride and carbon cannot be matched simultaneously using a one-step mechanism, because in experiments the methyl chloride concentration would decreases much faster than the carbon concentration increases.

5 Conclusion
In this work, several mechanisms for methane chlorination and pyrolysis are presented, compared and validated based on experimental data. For methane pyrolysis, the mechanism of Sinaki et al. is preferred as the gas-phase mechanism 17. To determine the surface mechanism for methane pyrolysis, the mechanism of Wang and Frenklach was compared with the surface mechanism of Agafonov et al., with the approach of Agafonov being selected. The mechanism of Mitchell et al. is chosen as the basis of the gas-phase mechanism for methane chlorination, as it is designed for both the chlorination of methane and the formation of PAHs 18. Since it describes only chain growth up to naphthalene, this mechanism is supplemented by reactions of Sinaki mechanism. The gas-phase mechanism, as well as the surface mechanism, are extended with reactions to describe the influence of chlorine beyond naphthalene. This leads to an improved accuracy in fitting the experimental results of Weissman et al. 9.
For fitting the kinetic parameters, no mechanism can be found that can adequately describe the concentration of both the reactant methyl chloride and the product carbon. However, a one-step mechanism can be adapted in such a way that it models the formation of carbon quantitatively well. Nevertheless, several solutions yielding similar concentration profiles were found. Since only one source of experimental data is available, it is not possible to say which of the values ascertained is actually correct. The comparison with literature sources is also not informative in this regard, as the values found for activation energies and pre-exponential factors also vary greatly. By generating further experimental data, a more differentiated and detailed analysis of the parameters obtained from the optimization would be possible, providing a reliable basis for reactor flow simulations.
Acknowledgements
Open access funding enabled and organized by Projekt DEAL.
Symbols used
-
- A [mxmol−ys−1]
-
pre-exponential factor
-
- c [mol m−3]
-
concentration
-
- EA [J mol−1]
-
activation energy
-
- H [J mol−1]
-
reaction enthalpy
-
- k [mxmol−ys−1]
-
reaction rate
-
- n [–]
-
temperature exponent
-
- R [J mol−1K−1]
-
gas constant
-
- S [–]
-
selectivity
-
- t [s]
-
time
-
- T [K]
-
temperature
-
- X [–]
-
conversion
Sub- and Superscripts
-
- 0
-
initial or standard condition
Abbreviations
-
- A-SM
-
Agafonov surface mechanism
-
- HACA
-
hydrogen-abstraction & C2H2-addition
-
- M-M
-
Mitchell mechanism
-
- Mod
-
modified
-
- MS-M
-
Mitchell-Sinaki mechanism
-
- PAH
-
polycyclic aromatic hydrocarbons
-
- WF-SM
-
Wang and Frenklach surface mechanism


