Digital Image Processing of Gas-Liquid Reactions in Coiled Capillaries
Abstract
In the course of the investigation of biocatalytic gas-liquid reactions with color change in straight and coiled capillaries, a non-invasive evaluation method is needed to determine reaction progress and selectivity. Correlations between hydrodynamics, mass transfer phenomena, and reaction kinetics are in the focus of our work. For this purpose, it is necessary to investigate the flow and evaluate the reaction progress without disturbing the flow. Digital image processing (DIP) is presented as a suitable optical evaluation method for reactions with color change in capillary reactor designs. The developed DIP program is independent from the capillary reactor design, applicable to differently colored systems, and can analyze up to three different species simultaneously.
1 Introduction
An optical method works due to the interactions between electromagnetic waves and matter and can be treated as non-invasive measurement principle 1, 2. A very common optical method is the digital image processing (DIP) 3-5. A digital image in general describes a dot matrix containing pixels. A software package processes the digital image to reduce noise and extract quantitative information based on the data in the dot matrix 6-9. With increasingly powerful and faster computers, the application possibilities of DIP grew, too. Currently, digital image processing can be found in almost any kind of research field and development area 6, 10, 11. Reproducibility, high measurement speed together with optical resolution, and reliability are the most important advantages of digital image processing for its use as an evaluation method 4, 12, 13.
DIP suits very well for the evaluation of hydrodynamic phenomena in micro and minichannels because it does not disturb the flow due to its non-invasive principle. For this purpose, Krieger et al. 14 developed a DIP method to evaluate the consecutive oxidation of indigo carmine in an FEP tube (fluorinated ethylene propylene) with a round cross section and an inner diameter of di = 1.6 mm. The scope of the work by Krieger et al. was to investigate local mass transport phenomena and chemical selectivity in gas-liquid slug flow, also called Taylor flow because of the occurring Taylor vortex in the liquid phase. The oxidation has started when the yellow educt leuco-indigo carmine (LIC) in the liquid phase got in contact with the oxygen from synthetic air. The yellow LIC oxidizes via a red intermediate to the blue product keto-indigo carmine (KIC). DIP was used to determine the concentrations of educt, intermediate and product with a commercial camera.
Within this work, the DIP method developed by Krieger et al. 14 is extended and further optimized for the application on biocatalytic gas-liquid reactions in coiled capillaries and in a coiled flow inverter (CFI). The new analysis method has been adjusted to new capillary geometries, material system, and colors. Considering mixtures of two different species with different colors, the new method is able to determine the concentration of each specie in this mixture.
2 Materials and Methods
The DIP program used in this work starts with an image from the color reaction in the capillary, which is taken by the DIP program. The development of the optimized DIP program is performed in Matlab®2019a with the Image Processing Toolbox and the App Designer. All calculations have been tested on an Intel Core® i5-8600k with 3.6 GHz and 16 GB RAM. A downward compatibility to Matlab®2018a and 8 GB has been verified as well. The single steps within the DIP program are explained in detail below. To improve the quality of the acquired images, deliver consistent and reproducible results, and simplify the workflow, an appropriate experimental setup is imperative. The investigations regarding the experimental setup are shown in the Supporting Information (SI). The employed camera is a Nikon D5300 with an adjustable macro lens. Tab. 1 presents the camera settings. The lightning was realized by four LED panels (2 × Rollei Lumen Pocket B/W and 2 × Kaiser Fototechnik LED panels).
|
Camera setting |
Value |
|---|---|
|
Focal distance [mm] |
70 |
|
Aperture (f-number) |
11 |
|
Exposure time [s] |
1/2000 |
|
ISO |
8000 |
2.1 Development of a Digital Image Processing Program
An optimized image processing program was developed to calculate concentrations in an FEP capillary reactor design. The optimization is partly based on the work of Krieger et al. 14. However, nearly every step in the DIP program from Krieger et al. is evaluated and optimized regarding to the objectives of this study. Main emphasis was put on the independence of the DIP program from geometry, generalizing the DIP program to any material system, improving overall accuracy, and creating a graphical user interface. The basic concept of this DIP program starts from an RGB color image with a conventional digital camera (Nikon D5300) and evaluating the resulting three intensity values. The work steps in the DIP program are shown in Fig. 1.
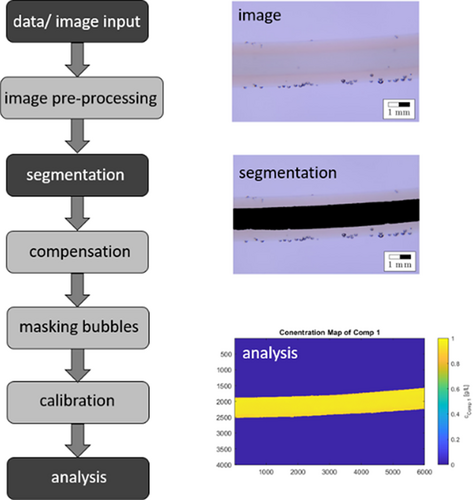
For the data or image input a camera acquires the images and saves them into a specific file format. The commonly supported file formats are JPEG, TIFF and RAW. These file formats have been evaluated regarding file size, quality loss and color depth. The DIP program used in this work is written in Matlab® 2019a, which currently supports BMP, GIF, HDF, JPEG, PCX, PNG, TIFF and XWD formats.
The second step is the preprocessing of the images with image enhancement algorithms. For example, the data type of the image is converted from unit8 to double. This step is necessary because some algorithms in the DIP program just work with the double data format, while the unit8 type does not support negative values. The last step is the implementation of the Gauss filter, which reduces noise. Beside the Gauss filter, several other filter types were considered, but the Gauss filter showed the best results as a preprocessing noise filter.
The segmentation routine determines the area that is to be analyzed subsequently. This area is called region of interest (ROI) or mask, since it is a logical matrix that is applied to the images like a mask. The segmentation routine by Krieger et al. 14 is a simple threshold algorithm, which requires numerous user inputs, such as cropping, turning of the image in the correct position, and setting the threshold appropriately. In order to achieve a segmentation routine that is geometrically independent, robust against reflection, and with reduced user input, various algorithms were evaluated, e.g., threshold, adaptive threshold, threshold with statistically determined thresholds, or edge detection.
After completed segmentation, the mask is utilized in the compensation routine. In a capillary with known concentration, the measured color should be equal for any point. However, the measured color intensity changes due to the varying layer thickness along the diameter of the capillary. As a result, the calculated colors would be incorrect, hence, the geometrically based intensity change needs to be compensated.
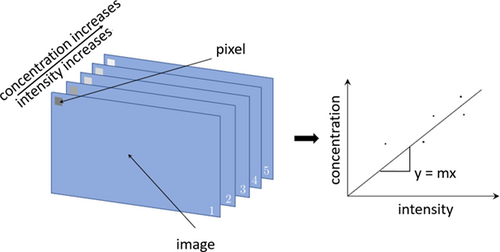
The masking of the bubbles is adopted from Krieger et al. 14 and not further optimized. A direct calibration is implemented in the DIP program. For every pixel, a calibration coefficient with a linear regression is calculated. The data input consists of images of a capillary filled with known concentrations and background images, which are images of the capillary filled with deionized water. The routine generates mean images and backgrounds for any concentration to reduce the influence on inhomogeneities in the exposure. Then, the routine subtracts the background from the concentration images and applies the segmentation mask to it. The resulting image shows the color intensity proportional to the absorbance of the medium. The images are split into three RGB channels, which are stored in a multidimensional array. The resulting multidimensional arrays store one channel of each absorbance image in each dimension. The routine reads out a single pixel of each dimension of one multidimensional array into a new vector and applies a linear regression to that data as shown in Fig. 2.
 ()
() is the coefficient matrix,
  a concentration vector, and
  the intensity vector. For a two-component material system and a RGB image, this system looks like
 ()
()As a result, the LES has more equations than unknown variables, and it appears that the LES is overdetermined for any material system with less than three components. A non-contradictory overdetermined LES does not have an exact solution, but its solution can be approximated with the method of least square. However, only because there are more equations than unknown variables in a system does not necessarily mean that an LES is overdetermined. It is possible that an equation does not contain information, which are necessary for solving the LES (in the case of linear dependency). A general approach to detect the dependency automatically is by using the Gaussian algorithm. For exact one solution of the LES, a single non-zero row is needed per column, i.e., the number of the unknown must match the number of linearly independent equations.
3 Results
In summary, it can be stated that JPEG and TIFF are the most appropriate file formats for the data/image input. The advantages and disadvantages in detail of all considered file formats are shown in the SI. The newly developed segmentation algorithm overcomes the above-mentioned limitations. The algorithm, which meets the mentioned criteria (geometrically independent, robust against reflection, and minimum user input), is a combination of the flood fill algorithm, active contouring, and morphological closing. The flood fill algorithm is a growing algorithm to determine an adjacent area of a color in a digital image and fills the identified area with a new color. Fig. 3 presents on the left-hand side the application of the flood fill algorithm on image 1, which leads to image 2. The algorithm does not fill the capillary correctly, since close to the borderline between the infill and the capillary wall there is still a region that is not segmented. To achieve a correct segmentation, the contouring algorithm is applied additionally (image 3).
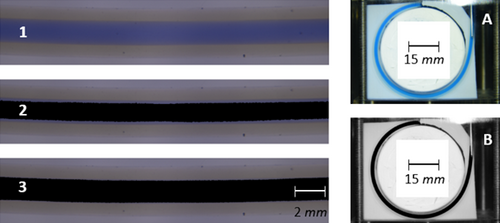
The area in a capillary is always a closed body. That is the reason why the combination of flood fill and active contouring works exceptionally well for any geometry (see Fig. 3, images A and B). Furthermore, this combination is robust against optical reflection. The morphological closing removes small holes and is only added to the routine for the case of very intense reflection.
The compensation method used by Krieger et al. 14 is based on the utilization of a Hadamard inverse and a scaling factor, further referred to as seed. The basic concept of this idea is to convert an image of a capillary filled with a medium of constant concentration into a grayscale image. Subsequently, the measured intensity of every pixel is inverted. As a result, some pixels are assigned an intensity greater than 1 and are therefore multiplied with the seed value. This creates a compensation matrix, where pixels with low intensities in the original image are now stored with higher brightness, and pixels with high intensities appear dark. By applying the compensation matrix to every channel of the original image, any pixel of the capillary becomes equal to the seed value. In 14 any compensation matrix is generated from an image with high concentrated product (blue) as medium. In order to generate this compensation matrix, multiple images of a capillary filled with product (compensation images) are captured as well as multiple images of a capillary filled with water (background images). Afterward, a mean background image is subtracted from a mean compensation image. It could not be validated that this compensation step is neither independent of the light source nor valid for any color. As shown in Fig. 4 the seed value cannot be chosen freely to normalize the color intensities between different images. Thus, the seed value is connected to the experimental setup and the calibration. Moreover, applying a compensation matrix to images with different colors shows that the compensation matrix is color dependent (see SI).
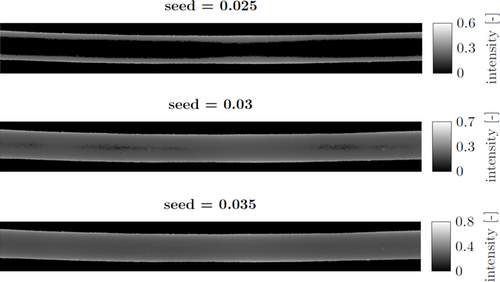
As a consequence of the results produced from the compensation routine, this method is discarded for this work. The method developed in this work is to calibrate each pixel individually. In this case, compensation is obsolete because individually calibrating each pixel already includes compensation. Here, this approach is implemented without being much more computationally intensive than the old routine.
The calibration routine can be applied to any component, which is to be analyzed, without having the disadvantages of the compensation routine explained before. Based on the physical model, the measured intensity is in the absorbance image zero if the concentration is zero. Therefore, the routine forces the regression line to go through the origin. The slope of the resulting regression line is the calibration constant for that specific pixel in that specific channel and stored in another matrix. This procedure is repeated until a calibration constant is calculated for any pixel of every channel of the capillary. The resulting calibration coefficient matrix has three dimensions, one for each channel.
Confirmed through tests, it is verified that the general equation system for less than three components is not overdetermined and therefore, exactly solvable within the analysis step. In consequence, this model is used to develop an analysis routine that can handle any material system with three or less components. The analysis routine requires the segmentation mask, the multidimensional calibration matrix, an image of the capillary that is to be evaluated, and its background as data input. The routine generates an LES and it is essential to know that one LES is solved for each pixel. Subsequently, the routine saves the resulting concentrations of the components in a solution matrix. To further improve the results a post-processing step is added including a median filter. Especially low concentration noise is a challenge for the DIP program. By applying a median filter, this influence could be reduced vastly. The entire Matlab® code can be found in the SI.
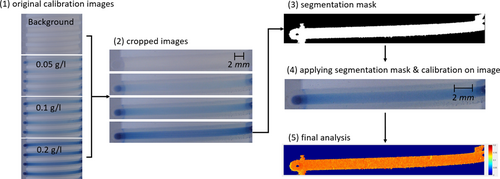
Fig. 5 shows the applied DIP program. An FEP tube with an inner diameter of di = 1.6 mm is coiled around a cylindrical structure, which was 3D printed from polylactic acid. The reaction system is the oxidation of ABTS, which leads to the blue product ABTSox. This oxidation is catalyzed by the enzyme laccase from Trametes versicolor. The tested solutions contain 0.5 g L−1 of the enzyme and different concentrations of the substrate ABTS (0 g L−1, 0.05 g L−1, 0.1 g L−1 and 0.2 g L−1) as shown in (1). The original images are cropped (2), because each of the four windings contains the same information, thus saving computing time. The segmentation mask is created with the image showing the highest product concentration (3). Step (4) describes the evaluation of a test image with unknown concentration. In this case, the concentration of ABTSox is 0.15 g L−1 and it is to be shown whether the DIP program also recognizes this. The background image is subtracted from the test images and the segmentation mask is applied on it. By comparing the test image with the calibration images, the DIP program calculates the concentration of each pixel in the segmented region and creates an analysis image (5). Furthermore, the concentration of each pixel in each color channel is stored in a concentration matrix. For this example, the segmented region contains 1.9 · 106 pixels. The mean value of all pixels for the calculated concentration is cmean = 0.1506 ± 0.002 g L−1.
4 Conclusion
As part of the digital image processing program optimization, the image processing algorithm is successfully generalized to geometries, material systems, and colors. The segmentation is changed from a threshold algorithm to a combination of flood fill, active contouring, and morphological closing. The compensation step is replaced with a direct calibration. This step improves the overall accuracy of the DIP program and its capability of dealing with inhomogeneous exposure. The analysis routine is changed from a specific solution for leuco-indigo carmine to a general solution. The new routine can analyses up to three components simultaneously.
Supporting Information
Supporting Information for this article can be found under DOI: https://doi.org/10.1002/cite.202000240.
Acknowledgements
The authors gratefully acknowledge the German Research Foundation (DFG) for financial support under the Grant KO2349/13-1. Open access funding enabled and organized by Projekt DEAL.
Symbols used
-
- c [g L−1]
-
concentration
-
- I [W m−2]
-
intensity
-
- K [–]
-
coefficient
Abbreviations
-
- ABTS
-
2,2′-azino-bis(3-ethylbenzthiazoline-6-sulfonic acid)
-
- CFI
-
coiled flow inverter
-
- DIP
-
digital image processing
-
- FEP
-
fluorinated ethylene propylene
-
- KIC
-
keto-indigo carmine
-
- LED
-
light-emitting diode
-
- LES
-
linear equation system
-
- LIC
-
leuco-indigo carmine
-
- RGB
-
red green blue color space
-
- ROI
-
region of interest


