Deactivation Kinetics of ZSM-5 by Coke in Ethanol-to-Hydrocarbons Process
Abstract
Conversion of ethanol to hydrocarbons by porous zeolite ZSM-5 is a sustainable alternative compared to crude oil, gas or coal conversion. A quantification and description of micro- and macroscopic deactivation kinetics with basic transport and reactor models reveals deeper insight into the dynamics of coking and product formation at varying contact time. A new first order deactivation model helps to separate linear deactivation and autocatalytic acceleration of catalyst decay. A deeper look into product formation reveals a change in selectivity during initiation and deactivation phase from bigger build-up C5+ to smaller cracking products C3 after formation of coke precursors, which does not coincide with site-loss and reduction of contact time alone. Thereby, deactivation and switching selectivity in the hydrocarbon pool concept become more deterministic, which paves the way to more selective ethanol conversion processes.
1 Introduction
During the last decades since the discovery of methanol conversion process to gasoline in 1988 by Mobil Oil Corporation, understanding catalyst decay by coke formation has become important to control hydrocarbon production from ethanol or methanol. 1 Especially yields estimations and catalyst decay with time on stream (ToS) support catalyst evaluation with focus on absolute performance and financial outcome. Beside microkinetic lab-scale analysis, technology scale-up and different performance tests lead to various ab initio and numeric kinetic models.
The current work deals with the chemical analysis of gas, liquid phase and coke products to support a mass balance and a description of catalyst decay by coke during ethanol conversion. Catalyst deactivation of commercial ZSM-5 by product selectivity and feed content in gas phase correlates with different micro- and mixed micro-/macrokinetic models for the ethanol conversion process.
2 Theoretical Framework
Beside numerical approaches, easy initial assumptions about dominant n-th order microkinetic and mixed micro- and macrokinetic deactivation models help to quantify the characteristics in catalyst decay and shifting selectivity by coke formation. Previous work on ethanol and literature reports on methanol conversion already proved coke formation as the main origin of deactivation. 2-4
2.1 Microkinetic Models
 ()
() ()
() ()
()Deactivation by coke formation includes two categories explained by Guisnet et al. 7: Beside (1) local blocking of active sites by strong chemisorption of product molecules, there is (2) a narrowing or blocking of pore channels combined with an exclusion of active sites from hydrocarbon conversion processes. Consequently, the total number of active centers involved in hydrocarbon conversion processes decreases continuously. A currently published method by Foley et al. 8 describes catalyst decay in methanol conversion by a non-selective cumulative site-loss as consequence of a 1st order reduction of the total number of active sites by formaldehyde, which finally ends up in a similar mathematical approach.
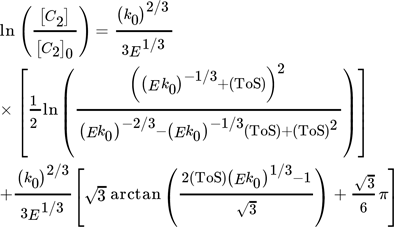
For another hydrocarbon converting process, i.e., n-hexane cracking on P-modified ZSM-5, Wendlandt et al. and Maschke et al. proposed earlier in a similar fashion a kinetic 1st order deactivation model from scratch. 5, 9 The similarity is strongly coupled to the slow coke accumulation and the diffusion limiting properties inside porous catalyst material as soon as hydrocarbons are too big to desorb and to leave the pores. Contrary, if coke itself promotes production of coke in an autocatalytic process, higher order mixed kinetics are more severe to describe the process. Dadyburjor et al. described a mixed 1st order deactivation as well as 1st and 2nd order acceleration kinetic model to describe decay in cracking of n-decane or naphthalene on modified zeolite HY. 10 For slow conversion process reaction of methanol itself U and for fast ethanol conversion process the secondary conversion of ethylene, i.e., C2 ∼(1 – U) after almost complete dehydration, is focused to characterize catalyst decay. From these, closed 1st order deactivation and n-th order acceleration microkinetic models with deactivation coefficients B, D, E are displayed below:
 ()
() ()
() ()
() ()
() ()
() ()
()The strength of these pure microkinetic approaches is an easy, analytic solution to fit experimental data with a limited number of parameters. Furthermore, these parameters often have a qualitative meaning, e.g., an exponential factor k, which correlates to a diffusion or activation barrier. In contrast, industrial processes with macroscopic reactor dimensions often reveal a non-homogeneous local distribution of deactivation phenomena and states over the catalyst bed or mixture. Those processes are not considered, which leads sometimes to sufficient parameter fits, but insufficient parameter meaning. Pure microkinetic approaches are more severe to shallow-bed lab-scale catalytic tests, rather than investigations with realistic fixed-bed reactors or other industry-related geometries.
2.2 Combined Micro- and Macrokinetic Models
Fixed-bed reactor systems are often used in lab-scale performance tests because of low costs and low demand on analytics. In industrial application, the reactor type is often predetermined by deactivation and regeneration behavior, especially in case of coke formation. 11 This work explicitly deals with tubular reactor type with fixed-bed catalyst material for performance tests in ethanol conversion. Yuan et al. used a plug-flow-reactor (PFR) model to describe the conversion U of methanol for a steady coking of the catalyst bed in analogy to a cigar burning by Schulz. 12, 13 A transfer to 1st order deactivation process C2 ∼(1 – U) in ethanol conversion results in a 1st order deactivation macrokinetic approach.
 ()
() ()
()A combined approach of PFR model and microkinetic catalyst decay by Maschke et al. 5 and Wendlandt et al. 9 leads to an alternative 1st order deactivation and 1st order acceleration model:
 ()
() ()
() ()
()Strength of this approach is a simplified 1-dimensional macroscopic deactivation along the catalyst bed, which includes a more realistic deactivation profile. The main weakness arises from fast increasing complexity with different geometries. Often only numeric solutions are available. Especially for pilot plants often 3- or more dimensional macroscopic inhomogeneities of the catalyst bed have to be added, including heat transport phenomena.
2.3 Selective and Non-selective Deactivation
 ()
()Otherwise, a selective deactivation leads to different decay in formation rates of individual products, which is more likely to hydrocarbon interconversion networks as described for methanol (MTH) or ethanol-to-hydrocarbons (ETH) process. 8 A standardization of individual product streams to the current status of deactivation of the secondary conversion of C2 (mainly ethylene) has been described for gas-phase products C2, C3, C4 and C5+ in ethanol conversion process at almost complete ethanol conversion. 14, 15 An easy triangular plot is used to display changes in standardized C3*, C4* and C5+* with ToS and ongoing catalyst deactivation (see Fig. 1). A non-selective deactivation of the C2 build-up reactions should lead to similar values and a single point in the diagram during the complete deactivation process.
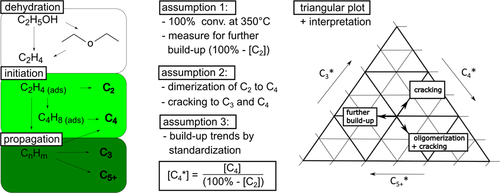
As a first rough interpretation, the formation of C3 origins from cracking processes starting with C2 building units from ethanol dehydration. C4 results from dimerization as well as higher interconversion or cracking processes. C5+ is a measure for further build-up and interconversion processes of hydrocarbon molecules. 14, 15
Everything considered, this work includes and compares four models, i.e., three to explain deactivation kinetics by an increase in C2 product fraction in gas phase and one to illustrate shifts in selectivity independent of a change in space-time by catalyst deactivation. Furthermore, a change in space-time and contact time has been provoked by variation of the inert gas flow at constant ethanol feed. The assessment of the deactivation models is realized by the accuracy of the fit, the assumed boundary conditions (prediction accuracy) and the interpretation of the introduced model parameters.
3 Experimental Section
3.1 Catalytic Test Method
For the catalytic testing zeolite powder materials were pressed at 1.5–2 MPa, crushed and sieved in a range of 315–400 µm. The conversion was carried out in a steel tubular fixed-bed reactor. For each run 500 mg catalyst sample (dry mass) was used. Reaction temperature for catalytic testing was 350 °C controlled by a thermocouple directed heating. Ethanol (2.5 g h−1) and nitrogen carrier gas (5, 10, 15, 20 L h−1) were fed into the reactor via heated pipes (WHSV of 5 h−1). During 10 h ToS and 2.5 bar (absolute pressure) condensable products were trapped in a liquid separator. In all cases, a mass balance was defined including yield of coke, liquid condensable and gas-phase products with regard to ethene. The resulting gaseous and liquid reaction mixtures were analyzed by gas chromatography using an HP 5890 Series-II GC System equipped with an FID (flame ionization detector) and a nonpolar 100-m HP-1 column. Pretests showed no or only traces of ethanol or diethyl ether at above 300 °C. Prior to catalytic testing all samples were dried at 120 °C for 1 h in nitrogen (5 L h−1) following a calcination step (rate 3 K min−1) at 450 °C for 0.5 h.
3.2 Product Analysis of Gas Phase, Liquid Phase and Coke
Product analysis was standardized by DHA method (detailed hydrocarbon analysis) for determination of hydrocarbons including response factor analysis with HP 5890 Series-II GC system from Agilent. Accuracy was set to minimum 99.0 % determination of peaks of integrated peak area. Mass balance was calculated from gas and liquid phase analysis by GC and balancing of liquid phase products and coke analysis by TGA. Thermogravimetric analysis was performed with a TG50 from Mettler Toledo with synthetic air (200 mL min−1) for coke quantification after catalytic tests. Temperature program consists of a ramp between 35 °C and 850 °C with a rate of 10 K min−1 each run. 14, 15
Data analysis was done for each individual compound and summarized in fractions according to their carbon number C2, C3, C4, C5+. The contribution of coke to the individual fractions was neglected due to its low amount below 1 wt % of full mass balance. Compound determination in gas phase was compared to results from gas chromatography and mass spectrometry (GC/MS) with a Clarus 680 GC and a Clarus SQ 8 S MS from PerkinElmer as well as a Rxi-1ms column (100 m) with an extended DHA method as reported in previous work. 14, 15
4 Results and Discussion
4.1 Chemical Analysis and Description of Catalyst Decay
A summary of physico-chemical data of commercial ZSM-5 zeolite from recent reports 14, 15 describes a highly acidic (Si/Al = 11.2; 0.56 mmol(NH3) g−1), high surface (BET: 390 m2g−1)16 and mainly microporous material (BJH: ∼ 61 m2g−1)17. During conversion tests for ethanol, a mass balance from GC gas and liquid phase as well as TG coke analysis helps to quantify conversion of the feed and yields of different product fractions at 350 °C for 10 h ToS. 14 Although, the total amount of coke is < 1 wt % of total hydrocarbons, a deeper look into coke composition as reported by Guisnet et al. 18 was not necessary. Consequently, site blocking as well as pore and surface blocking by coke both have to be considered. As reported earlier, coke formation is the major reason for catalyst deactivation, almost independent from their nature. 2, 3
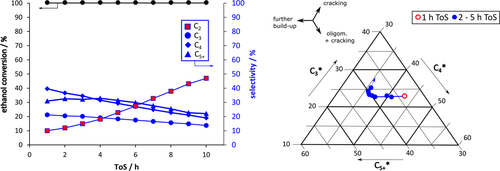
An increase in C2 formation is a sign for catalyst deactivation in ethanol conversion process (see Fig. 2). 3, 14 A deeper look into other product fractions reveals a complex interplay of hydrocarbon interconversion as described in different theories, most prominent “hydrocarbon pool theory”. 4, 19 Consequently, a selective deactivation process is illustrated by shifts in the triangular plot of Fig. 2.
4.2 Assessment of Catalyst Decay by Different Mathematical Models
First principle microkinetic models to fit C2 gas phase fraction reveal only minor accuracy in ethanol conversion tests (cf. Sect. 2.1 and Tab. 1). A detailed kinetic analysis with mixed micro-/macrokinetic approaches shows a fast deactivation in ethanol conversion in agreement to findings from Johansson et al. 19 and Pinard et al. 20 (cf. Sect. 2.2).
|
Model |
Order of deactivation |
[C2]0 |
Growth factor k0 [h−1] |
Growth coefficient |
Growth exponent N/B |
R2 |
|---|---|---|---|---|---|---|
|
Micro |
1 |
0.061 |
0.392 |
B = 0.5721 |
– |
0.9995 |
|
Micro |
2 |
0.068 |
0.266 |
D = 0.0552 h−1 |
– |
0.9998 |
|
Micro |
3 |
0.081 |
0.215 |
E = 0.0055 h−2 |
– |
0.9996 |
|
Micro/Macroa) |
1 |
0.080 |
– |
k N = 0.237 h−1 |
– |
0.9994 |
|
Micro/Macrob) |
1 |
0.067 |
– |
B k0 = 0.055 h−1 |
5.79 |
0.9998 |
Microkinetic models show better accuracy with increasing order of deactivation. In case of a shallow-bed reactor test, this would describe a multiple-ordered coking process, which describes the simultaneous contribution of two hydrocarbon molecules to coke formation at one active site at its best. Consequently, the local growth factor of coke at active sites as well as the coefficient of deactivation decrease with increasing number of simultaneously contributing coke precursors.
A deeper look into combined macro- and microkinetic models reveals a similar accuracy of the fit, which is explained by the macrokinetic coking of a catalyst bed by a cigar-burning type migration of the active zone through the catalyst bed of a fixed-bed reactor. 13 The direct comparison shows a good fit with already 1st order kinetics. The local growth of coke in a 1st order or pseudo 1st order process seems more realistic, because the size limitation by the pore sizes does not favor simultaneous reactions of two or more bigger hydrocarbons. 21
In consequence, combined macro- and microkinetic models are favorable. For the first one, the good accuracy with this 1st order approach is a sign for harsh diffusion limitation due to fast pore narrowing. However, the deactivation within a cell model of uniform sheets in a catalyst bed with the growth factor kN does not allow further assumptions to asymmetric profiles, e.g., due to changes in the product and coke formation with ongoing deactivation level. 14, 15
The second fit with the new model gives reason for a slight contribution of autocatalytic acceleration for low values of N/B to overall deactivation by a general growth of strongly chemisorbed hydrocarbons as reported by Gusinet et al. 7. Although, both combined macro- and microkinetic models show good accuracy, the first fit reveals an easy plot with the two model parameters [C2]0 and kN to compare deactivation kinetics of different catalysts. 15 A contribution of accelerated deactivation by coke is implemented in the second new combined approach, but with a more complex three parameter plot as explained in Sect. 4.3.
4.3 Selective Deactivation and Influence of Contact Time in ETH Process
The analysis of product formation on ZSM-5 zeolite at varying contact time by inert gas variation reveals a speed-up in catalyst decay kN and Bk0 with increasing contact time with all microkinetic and combined macro- and microkinetic models (Fig. 3). Although the fit is good, the trend for the new mixed macro- and microkinetic approach describes an increased acceleration in catalyst decay, i.e., lower value of N/B with increased contact time. Recent work already explained an increased local formation of aromatics and bigger coke precursors with increased contact time, which results from an increased probability for subsequent reaction steps towards coke precursors. 15
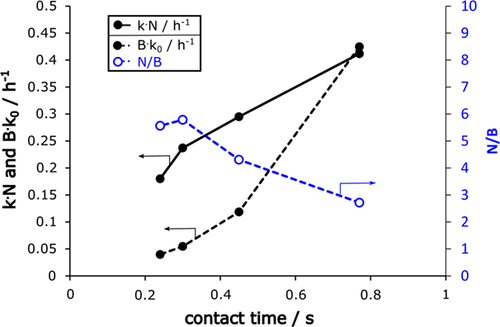
From the combined models, two deactivation plots follow, which describe the deactivation parameters in relation to the initial [C2]0 value, which describes initially unconverted C2 fraction (Fig. 4). Both show an increased conversion of C2 with increased contact time, i.e., increased time enhances the probability for build-up reaction steps from ethylene after dehydration. The second new plot again separates an acceleration term N/B, which describes a higher acceleration of catalyst decay (lower value of N/B) with higher contact time (lower value of [C2]0). Consequently, follow-up reactions promote coke formation and increased amounts of coke precursors themselves promote autocatalytic coking.
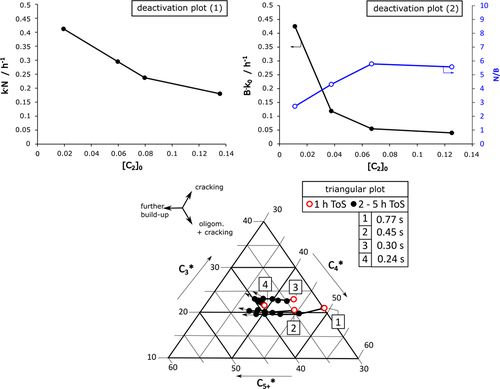
Beside site loss due to coke formation, the triangular plot model reveals a certain change in selectivity during progressing decay (Fig. 4). With increasing ToS, the formation trend of higher products C5+* increases indicating the evolution phase as described by Schulz et al. 22. After growth of bigger hydrocarbon molecules, the first products rest at the pore channels due to size limitation and cracking to smaller molecules, such as C3, becomes more dominant, i.e., C3* rises. A comparison of the deactivation behavior at different initial contact time by inert gas flow variation shows two general trends: (i) The initial build-up trend C5+ rises with increasing initial contact time, which correlates with former results about increased formation of aromatics and coke. 15, 23 (ii) The evolution trend for selectivity shifting with ToS is comparable but speeds up with increasing contact time.
This deterministic shift with an initial evolution phase of C5+ molecules and subsequent rise of C3 cracking products after formation of bigger coke precursors leads to an application to provoke more selective catalyst and process parameters to stretch the time frame for selective aromatics or olefins formation. Examples for those strategies are an adaption of site density 14 or regeneration cycles with complete or only partial burning of coke .24
5 Conclusion
Conversion of small alcohols to hydrocarbon mixtures is a suitable option to provide biomass as drop-in chemicals in fuel production as well as petrochemical industry. High active zeolite catalyst material ZSM-5 shows fast deactivation in ethanol conversion due to coke formation. The dynamics of catalyst decay are characterized by easy analytical models with high accuracy for combined macro- and microkinetic descriptions. It includes a 1st order deactivation by coke and a slight contribution of autocatalytic acceleration for ethanol conversion. A deeper look into product formation reveals a change in selectivity during initiation and deactivation phase from bigger build-up C5+ to smaller cracking products C3 after formation of coke precursors, which does not fit to only site-loss and reduction of contact time. A simple illustration of the deactivation behavior by a two- or a three-parameter plot helps to compare the behavior of different samples. Especially the new 3-parameter deactivation model separates an autocatalytic acceleration term. This leads to a refined interpretation of catalyst decay at different inert gas flow: With increased contact time, there is an increased conversion of C2 to bigger hydrocarbon molecules. Meanwhile, there is an increased autocatalytic contribution by coke formation from bigger coke precursors, which reach the size limit of the zeolite pores.
The new findings to characterize and control autocatalytic catalyst decay and selectivity shifts open the way to predetermined process parameters and catalyst properties as well as regeneration strategies to achieve highly selective ETH processes.
Acknowledgements
C. Jonscher thanks the ‘Studienstiftung des deutschen Volkes' for scholarship. Furthermore, the authors thank Prof. Prof. h.c. Dr. rer. nat. habil. Wladimir Reschetilowski for literature support. This research was funded by the German Federal Ministry for Education and Research (BMBF) within the directive Client-II “International Partnerships for Sustainable Innovation” by FONA3 (funding code: 033R188A). Open access funding enabled and organized by Projekt DEAL.
Symbols used
-
- B, D, E [–; h–1; h–2]
-
coefficients for accelerated deactivation
-
- k [h−1]
-
deactivation constant
-
- k0 [h−1]
-
constant at ToS = 0 h
-
- N [–]
-
number of cells according to flow reactor cell model 12
-
- ToS [h]
-
time on stream
-
- WHSV [h−1]
-
weight-hourly space velocity
Greek letters
-
- θHCP [–]
-
coverage of the catalyst surface with active hydrocarbon species


