Model-based Analysis of Fixed-bed and Membrane Reactors of Various Scale
Abstract
A packed-bed membrane reactor in a distributor configuration is studied theoretically for the oxidative propane dehydrogenation and compared with a fixed-bed reactor. Based on detailed 2D models considering two different heat and mass transport models the reactor scale-up including various reactor-to-particle diameter ratios (D/dP) is analyzed with respect to reactor performance, heat transfer and hot spot formation. Higher selectivities at lower hot spot temperatures occur in the packed-bed membrane reactor for the same reaction conditions.
1 Introduction
One major problem in chemical engineering is the occurrence of undesired side reactions, which reduce process efficiency 1, 2. To avoid consecutive reactions, e.g., optimization is needed, considering the catalyst, the temperature, concentrations and the residence time 3-5. To enhance selectivity and yield, process intensification in integrated reactors can be beneficial 6, 7. Thereby, the chemical reaction is coupled with at least one additional unit operation in the same apparatus, according to the multifunctional reactor concept 8-11.
An example for multifunctional reactors is the packed-bed membrane reactor (PBMR), which combines in situ compound separation or dosing with chemical reaction. Applied to heterogeneously catalyzed gas phase reactions, a distributor regime can be used to lower the concentration of one reactant, thus, serial reactions of desired intermediates can be repressed and higher intermediate selectivities occur 12, 13. In particular, in oxidative dehydrogenations (ODH), coupled with highly selective thermal dehydrogenations (TDH), a distributed dosing of oxygen is an interesting alternative to enhance the alkene selectivity by lowering the local oxygen concentration in comparison to a conventional fixed-bed reactor operation (FBR) 1, 14-16.
The ODH is an irreversible exothermic reaction 14. Unfortunately, the heat of reaction leads to a hot spot formation. This problem increases dramatically during reactor scale-up. Reasons are the reduction of the surface-to-volume ratio, the flow maldistribution and the complex heat and mass transfer 17, 18.
In order to analyze and evaluate differences in reactor performance between the PBMR in distributor configuration and the conventional FBR, in this contribution detailed 2D-simulations were carried out for the ODH of propane to propene. If a radial flow is realized by a distributed dosing in a PBMR, the convective heat and mass transfer through the reactor wall and the porosity distribution have to be taken into account. For this, literature provides two established heat and mass transfer models of various complexity, the αW model and the λ(r) model 19-21. The main difference between both models is the consideration of a constant porosity in the αW model in contrast to a radial porosity profile in the λ(r) model. Thus, differences in heat, mass and momentum transport result. The dependency between hot spot magnitude and localization on reactor scales is studied using both models.
2 Modelling
2.1 Balance Equations
For a detailed analysis of the temperature and concentration profiles in FBR and PBMR, a 2D reactor model is implemented in the commercial software tool COMSOL Mutliphysics® 5.5. The reactor model is based on the following assumptions: steady-state, pseudo-homogenous, ideal gas behavior, incompressible flow and no heat radiation.
2.1.1 Component Mass Balance
 ()
() ()
() ()
() ()
() ()
() ()
()with the volumetric flow through the membrane  , the membrane surface area Amem and the inlet concentration of component i distributed via membrane ci,ss.
2.1.2 Heat Balance
 ()
() ()
() ()
() ()
()The αW model is based on radial constant dispersion coefficients for heat and mass transfer and a heat transfer coefficient, to describe the temperature rise in the wall-near region 20-23. The more realistic λ(r) model considers a radial dependency of the dispersion coefficients and heat transfer by conduction in the flow boundary layer 19-21.
2.1.3 Momentum Balance
To model the convective heat and mass transport dependency on the porosity distribution, the Navier-Stokes equations and the mass continuity equation are solved simultaniously in addition to the mass balances and heat balance as described in the Supporting Information 2.1.
2.2 Preliminary Investigations
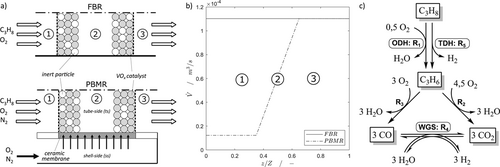
2.2.1 Reactor Concepts and Reaction Network
 , a reaction/membrane zone
  and an outlet zone
  . The comparability of both reactor concepts is given by the same volumetric flow (
 ) at the outlet without reactions (Fig. 1b). Therefore, a splitting of the total volumetric flow in the PBMR case is necessary:
 ()
()
with the tube-to-shell-side ratio ts/ss , and the volumetric flow of the tube-side  .
.
The kinetic description for the ODH of propane is based on the derived reaction network, shown in Fig. 1c. Detailed information about the reaction kinetics can be found in Supporting Information 1.
2.2.2 Modelling of Heat and Mass Transfer
For an objective comparison and analysis of FBR and PBMR, taking into account scale-up, hot spot formation and cooling by distributed dosing, the 2D models (Eq. 1–10) are solved applying the αW model and the λ(r) model. Since the more precise λ(r) model, considering ε = f(r), is in a better agreement with experimental data, it is used in the following for further investigations with respect to scale-up. Detailed information and discussions can be found in Supporting Information 2.2.
3 Simulation Studies
3.1 Influence of Reactor Scale-up
The surface-to-volume-ratio of cylindrical reactors decreases linearly with an increased tube diameter (4/D). This results in a greater distance between core and reactor wall, which leads to significant hot spot in packed catalyst beds during scale-up. To quantify this influence, various D/dP ratios (6, 21, 40) of the FBR are studied with respect to hot-spot temperature and reactor performance. Two different cases are investigated: a constant weight hourly space velocity ( ) of 400 kg s m−3 with an adjusted catalyst fraction Φ (Eq. 2) (Supporting Information 3) and a constant catalyst fraction Φ = 1 with an adjusted WHSV, as shown in Fig. 2 (calculations in Supporting Information 4). To assure a comparability between both cases, the same volumetric flow is used, so that the residence times are equal. The particle diameter is held constant at dP = 1 mm 14.

As shown in Fig. 2, the reactor performance is enhanced due to an increased hot spot temperature during scale-up (266 K), supporting the endothermic TDH and catalyst deactivation by sintering, e.g. The maximum propene yield is reached at D/dP = 40 and is about 45 %. The highest propene selectivities and yields occur independently of the reactor scale at very low oxygen concentrations (xO2,in = 0.25…1 %), thus, the advantage of a PBMR in distributor configuration is obvious. By applying distributed dosing, the membrane flow offers additionally the possibility to decrease the hot spot temperature by a convective cooling. Based on these finding, in the following chapter the impact of temperature by a radial dosing on hot spot formation and reactor performance is studied for various scales and compared with results of the FBR.
3.2 Influence of Constant Wall/Membrane Flow Temperature
The different dosing strategies are compared for a constant inlet and wall temperature (TW = Tin = 600 °C), a constant average reactor scale (D/dP = 21) and different catalyst fractions and oxygen concentrations.
As shown in Fig. 3a and b, the oxygen dosing leads to an enhanced reactor performance of the PBMR in comparison to the FBR. In particular, the propene selectivity can be improved because of the lowered oxygen concentrations. Thus, undesired series reactions are depressed. However, due to higher local oxygen concentrations in the FBR, higher propane conversions occur. Since the propene yield of the PBMR is higher, it can be seen, that increased selectivities of the PBMR dominate higher conversions of the FBR. The yield can be enhanced up to 35 % by increasing the mass of catalyst, leading also to higher hot spot temperatures, especially in the conventional FBR (Fig. 3c). The hot spot temperature can be decreased and controlled significantly by applying the PBMR, what is shown in Fig. 3c. Similar results can be found for the oxidative coupling of methane 24. The hot spot temperature of the FBR increases drastically with an increased oxygen concentration and mass of catalyst, whereas the PBMR is nearly independent of both, due to radial convection by distributed dosing, which leads to a direct cooling of the catalyst bed. Thus, no heat accumulation in a particular region is pronounced in the PBMR.

3.3 Various Wall/Membrane Flow Temperatures
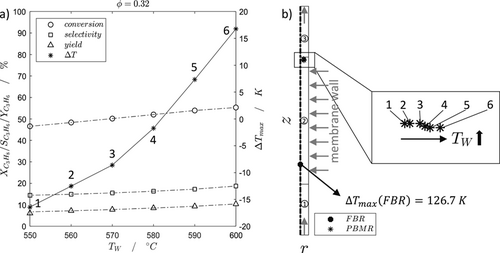
Since the significantly highest hot spot temperature of the FBR occurs at D/dP = 40 (Fig. 2), the influence of the membrane flow temperature is studied in detail for this case. In Fig. 4a the performance and hot spot temperatures of the PBMR with D/dP = 40 for various wall and respectively membrane flow temperatures, as a new degree of freedom, are shown.

Fig. 4a illustrates, that the hot spot temperature can be decreased in a controlled manner by lowering the membrane flow temperature. This also leads to a deeper penetration of oxygen into the catalyst bed (Fig. 4b), by taking the hot spot positions into account. As described before, the hot spot in the PBMR is not localized as in the FBR. Due to the distributed dosing, oxygen is radially limited, which reduces the influence of series oxidations and shifts the hot spot convectively to the reactor outlet. With higher temperature, oxygen is faster converted, so that the hot spots occur closer to the wall (Fig. 4b). In comparison to the FBR, the hot spot temperature of the PBMR is drastically lower. Unfortunately, the reactor performance slightly decreases along a drastically lowered membrane flow temperature, mainly due to a lower reaction rate of the highly endothermic TDH. Thus, a new optimization problem results with respect to the membrane flow temperature.
4 Conclusion
The aim of this theoretical study was to investigate the influence of scale-up and axial oxygen distribution on reactor performance and hot spot formation. A conventional FBR and the PBMR were applied to the ODH and TDH of propane to propene. 2D simulations based on the more complex λ(r) model revealed a better agreement with experimental data than those based on the simplified αW model. As shown in this contribution, the yield of propene can be increased in pilot-scale from 18 to 21 % with a catalyst ratio of Φ = 0.55 and from 28 to 35 % with a catalyst ratio of Φ = 1, by using a PBMR instead of the FBR. Furthermore, it is found, that the hot spot temperature of the FBR increases significantly with an increased D/dP ratio. By a distributed membrane flow, the hot spot temperature and location can be controlled and the formation of a local hot spot can be depressed.
Consequently, selectivity and temperature control via adjusting suitable membrane flows is promising. This offers new degrees of freedom for membrane distributors. Since the temperature and concentration fields are complex, only a detailed 2D modelling provides sufficient understanding and potential for further optimization.
Supporting Information
Supporting information for this article can be found under DOI: 10.1002/cite.202000227. This section includes additional references to primary literature relevant for this research 25-32.
Acknowledgements
The financial support of the German Science Foundation (Project: „Kontrolle und Intensivierung von Reaktionen durch Einsatz zyklisch betriebener Distributoren” (SE 568/23-1 / HA 6762/2-1) is gratefully acknowledged. Open access funding enabled and organized by Projekt DEAL.
Symbols used
-
- a [–]
-
exponent
-
- A [m2]
-
area
-
- b [–]
-
exponent
-
- c [mol m−3]
-
concentration
-
- cp [J (mol K)−1]
-
specific heat capacity
-
- d [m]
-
diameter
-
- D [m]
-
tube diameter
-
- Deff [m2s−1]
-
effective mass dispersion coefficient
-
- J [mol (m2s)−1]
-
molar flux
-
- k [m3nPa−n]
-
reaction rate constant
-
- K [–]
-
performance indicator (conversion, selectivity, yield)
-
- KWGS [–]
-
equilibrium constant
-
- m [kg]
-
mass
-
 [mol s−1]
 -
molar flow
-
- Nexp [–]
-
number of experiments
-
- p [Pa]
-
pressure
-
- r [mol (kg s)−1]
-
reaction rate
-
- r [m]
-
radial coordinate
-
- R [m]
-
tube radius
-
- S [–]
-
selectivity
-
- T [K]
-
temperature
-
- u [m s−1]
-
superficial velocity
-
 [m3s−1]
 -
volumetric flow
-
- VR [m3]
-
reactor volume
-
- x [–]
-
molar fraction
-
- X [–]
-
conversion
-
- Y [–]
-
yield
-
- z [m]
-
axial coordinate
-
- Z [m]
-
reactor length
Greek symbols
-
- α [W (m2K)−1]
-
heat transfer coefficient
-
- ΔHR [J mol−1]
-
reaction enthalpy
-
- ε [–]
-
porosity
-
- η [Pa s]
-
dynamic viscosity
-
- λeff [W (m K)−1]
-
effective heat dispersion coefficient
-
- ν [–]
-
stoichiometric coefficient
-
- ρ [kg m−3]
-
density
-
- ρbulk [kg m−3]
-
bulk density
-
- Φ [–]
-
catalyst fraction
Subscripts
-
- c
-
cross section
-
- cat
-
catalyst
-
- exp
-
experimental
-
- f
-
fluid
-
- high
-
higher D/dP ratio
-
- i
-
component index
-
- in
-
inlet
-
- j
-
reaction index
-
- low
-
lower D/dP ratio
-
- mem
-
membrane
-
- p
-
particle
-
- r
-
radial direction
-
- s
-
solid
-
- sim
-
simulated
-
- ss
-
shell-side
-
- ts
-
tube-side
-
- w
-
wall
-
- 0
-
ambient
Abbreviations
-
- BC
-
boundary condition
-
- eq.
-
equation
-
- FBR
-
fixed bed reactor
-
- ODH
-
oxidative dehydrogenation
-
- OF
-
objective function
-
- PBMR
-
packed-bed membrane reactor
-
- RSS
-
residual sum of squares
-
- TDH
-
thermal dehydrogenation
-
- ts/ss
-
tube-to-shell-side ratio
-
- WHSV
-
weight hourly space velocity


