Software-guided Microfluidic Reaction Calorimeter Based on Thermoelectric Modules
Abstract
A software-guided, continuous reaction calorimeter based on thermoelectric modules for direct heat flux measurements is presented. Sensors and actuators of the calorimeter's setup are implemented within a lab automation system, which enables the automated calibration of the heat flux sensors and investigations of chemical reactions through sequential function charts. Functionality of the calibration is shown by heat transfer experiments. Additionally, the calorimeter's performance is demonstrated by good agreement of conducted neutralization experiments with literature data.
1 Introduction
Chemical reactor design requires thorough knowledge of thermodynamics, hydrodynamics, and the dynamics of the chemical process itself 1. Thus, fundamental knowledge of interaction between reaction kinetics and hydrodynamics is demanded. Reaction calorimetry represents a powerful technique to provide basics of a reaction's thermodynamics and kinetics 2. The thermokinetic data can be transformed into information regarding criticality, scalability, and safety risks of the process. Especially, the combination of reaction calorimetry and micro process engineering offers many advantages 3. The high surface-to-volume ratio of microstructured devices leads to increased process control 4-6. Therefore, even fast and highly exothermic reactions can be investigated under safe conditions 7. In addition, a continuously operated process features higher yields, conversion, and selectivity in comparison to conventional batch processes 8-10. The small holdup offers reduced waste of chemicals and increased sensitivity investigating small quantities of material in a short time 11.
There are various calorimetric measurement methods for microreactors and microchips such as infrared thermography 12, 13 or modified differential scanning calorimetry 14. Recently, thermoelectric modules (TEMs) are used to enable real-time thermokinetic measurement methods 15. TEMs are employed as heat flux sensors, which detect heat fluxes through the Seebeck effect 16-20. Gruber-Wölfler et al. 21 designed a calorimeter, which offers the possibility to control the temperature of reactor segments individually using the Peltier effect of the TEMs. Each TEM receives as much electrical input as required to remove heat of reaction from the microreactor. Thus, isothermal operation mode of the calorimeter is achieved. Yet, optical observation of processes within the microchannel is unfeasible, which is often a desired feature, especially in process development of multiphase systems.
The microcalorimeter's isoperibolic operation mode has been introduced and employed in previous works 20, 22. Yet, calibration of the TEMs has been time consuming and error-prone due to manual operation and intervention. This study deals with the development of an automated calibration procedure for a continuous flow reaction calorimeter based on TEMs used as heat flux sensors. Subsequent investigations of a chemical reaction in isoperibolic mode of the microcalorimeter are automatically carried out for validation.
2 Materials and Methods
2.1 Thermoelectric Modules – Heat Flux Sensors
TEMs can be used as heat flux sensors or heat pumps 23. They consist of numerous, alternating n- and p-doped semiconductors. These thermocouples are electrically connected in series via well-conducting metal bridges and thermally connected in parallel for similar physical conditions. These connection points of the electrical conductors are called contact points. Ceramic plates on the upper and lower side of the semiconductors provide electrical insulation and mechanical stability 24.
 , as can be seen from Eq. 1.
 ()
()Due to the direct correlation, it is not necessary to determine the thermal conductivity and the Seebeck coefficient of the TEMs, as these are included in the calibration function fcal.
2.2 Automated Calibration Method for Passive Mode
A schematic overview of the automated calibration method is shown in Fig. 1 for passive mode of the TEM enabling isoperibolic operation mode of the reaction calorimeter.

The automated calibration method includes TEMs (15 × 15 × 3.6 mm3, QC-31-1.0-3.0M, Quick-Ohm Küpper&Co. GmbH, Germany), a calibration module, a temperature-controlled base plate, a microcontroller (Arduino Mega 2560), a lab automation system (LabManager, HiTec Zang GmbH, Germany) and a power supply (RND 320-KA3005D, RND lab, Switzerland). Instead of the microreactor, the calibration module is mounted to the base plate. The LabManager, which represents a programmable logic controller (PLC), is used for automation, since it already offers the software to automate the set up and thus the experimental procedure. Therefore, automation does not start from scratch and the hurdle to industrial application of the calorimeter is reduced. The calibration module itself consists of brass blocks matching the TEM's base area, on which heating foils (KP10x10R9L500-PSA, Telemeter Electronic GmbH, Germany) are attached as Joule heaters and a polytetrafluoroethylene (PTFE) block to insulate the Joule heat sources. The temperature-controlled base plate supplies a reference temperature for the TEMs. A power supply provides electrical power for the heating foils. The resulting heat fluxes of the heating foils are measured using bidirectional current/power monitors (INA219, Texas Instruments, USA). The supplied current passes the INA219 chips before entering the heating foils as this represents the high voltage side. The data between microcontroller and INA219 chips is transferred via I2C. The automation of the calibration requires the implementation of all components to the lab automation system. Thus, all sensors and actuators are connected to the PLC directly or, in case of the INA219 chips indirectly via the microcontroller. The automated calibration is based on a script written in the control and analysis software HiText, which uses structured text and syntactically resembles BASIC. In this script, the experimental protocol is defined. Measured data of the microcontroller is transferred to the LabManager via serial communication using a RS232-shield for the microcontroller (MAX232, Seeed, China). The power supply is also controlled via a serial interface. TEMs represent analog inputs for the PLC when used in passive mode. The data obtained during calibration is centrally stored and processed on the work and operating component to which the PLC is connected. The open source system Python is used for data processing. The criterion for steady state was the change in measured thermoelectric voltage. Once the first difference of thermoelectric voltage was below 1 % within 30 s, the measurement was continued for 180 s to perform a steady state average. The calibration is run as a ramp, in which the output voltage of the power supply is increased in 0.5 V increments until the maximum of 4.5 V is reached. This is done in triplicate to statistically validate the results. The TEMs are calibrated in sequence to minimize errors due to thermal conduction in the PFTE block.
2.3 Calorimeter and Experimental Setup
The continuously operated, microfluidic reaction calorimeter is composed of a temperature-controlled base plate, which is sealed by a sealing block made from PTFE, four TEMs, a commercially available plate microreactor and a top frame with an integrated view glass made from polymethylmethacrylate (PMMA). A previous work of Reichmann et al. 22 describes the experimental setup in detail. The extension of the previous works is the addition of the PLC to the setup to automate calorimetric measurements. Moreover, the calorimetric measurement is tested in another commercially available microreactor, which is particularly suitable for mixing-intensive processes, whereby the area of application of the calorimeter is increased. A top view of the microreactor (type*-X, HTM series, Little Things Factory GmbH, Germany) within the reaction calorimeter setup is shown in Fig. 2b.

For heat transfer experiments and evaluation of the automated calibration method, deionized water was preheated using a thermostat (Ministat 125, Huber GmbH, Germany) to different temperature levels and pumped into the microreactor via syringe pumps (SyrDos2, HiTec Zang GmbH, Germany) with volumetric flow rates of 2, 4, 6, 8, 10, 12, 20, and 24 mL min−1. The thermostats are controlled over transmission control protocol. The syringe pumps are controlled via serial interface of the PLC. The temperature of the thermostat was changed between 25 and 50 °C in increments of 5 °C. Resistance thermometers (Pt100A 20/10, ES Electronic Sensor GmbH, Germany) integrated in T-junctions measured the inlet and outlet temperatures within the stream. Cooling water for the base plate was pumped at high Reynolds number Re > 10 000 using a gear pump (Ismatec BVP-Z, Cole-Parmer GmbH, Germany). Rotational speed of the gear pump is controlled using an analog output of the PLC. The setup is displayed in Fig. 2a.
 ()
()For complete conversion, the reaction features an enthalpy of Δhn = 57.6 kJ mol−1 per 1 mol water 26. HCl and NaOH are dissociated within deionized water at 1 M and 1.1 M, respectively, to ensure full conversion of HCl. Phenolphthalein is added to the acidic feed and visualizes the reaction progress changing its color to pink in basic milieu indicating complete mixing. Since reaction time is negligibly small compared to mixing time for the quasi-instantaneous neutralization reaction, the color change also indicates full conversion.
3 Results and Discussion
This section starts with an evaluation of the automated calibration method for the passive mode of the TEMs as Seebeck elements. In Sect. 3.2, heat flux profiles across the reactor for warm water runs are determined to evaluate the automated calibration and determine the heat flux  , which is the heat loss through the top view glass. Results of the automated investigations of neutralization reaction in isoperibolic mode, i.e., constant cooling temperature, are displayed and evaluated in Sect. 3.3.
3.1 Evaluation of Automated Calibration Procedure for Passive Mode
Initially, electrical power supply of the heating foils, microcontroller and TEMs were connected to the lab automation system and implemented within the modular visualization and automation software LabVision. The automated calibration procedure was programmed in sequential function charts.
Exemplarily, Fig. 3a shows a direct correlation of measured thermoelectric voltage and externally applied electrical heat flux  for two TEMs.

In general, measured thermoelectric voltages increase for higher external applied heat fluxes. A second-order polynomial matches the theoretical Joule heating by electrical power input 27 with a high coefficient of determination of R2 > 0.99. These calibration curves already account for heat losses of the Joule heat source at defined temperatures. Standard deviations of triplet measurements are negligibly small. The maximum power of the heating foils is 2.7 W, which is 15 times lower than the power of the heating cartridge used in the work of Reichmann et al. 20. This results in a smaller range over which calibration can be performed. In this range, there is a nearly linear behavior between  and USE, as shown in Fig. 3a. Therefore, the calibration factors and their signs differ from the previous results, although the same TEMs were used in this study. In Fig. 3b, a linear correlation between thermoelectric voltage and temperature difference at the TEM was obtained. The slope of the trend line represents the Seebeck coefficient of the corresponding TEM. The importance of calibration of each TEM can be deduced from the slightly varying Seebeck coefficients. This variation is caused by manufacturing tolerances of the TEM as well as aging processes of the metal bridges within the TEM. The calibration of one TEMs in triplet measurements took about 4 h, resulting in a total calibration time of 16 h for all employed TEMs.
3.2 Heat Transfer Experiments – Functionality Test of Automated Calibration
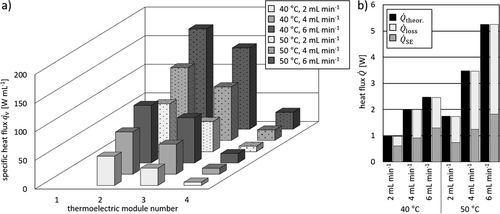
Heat transfer experiments with warm deionized water provided a first validation of the calibration performance. The obtained thermoelectric voltages are converted into heat flux for each TEM using the obtained calibration data from Sec. 3.1. Automated thermal characterization of the microreactor starts with lowest temperature of the thermostat Tpreheat, in this case Tpreheat = 25 °C. Since changing the thermostat's temperature takes more time than changing the volumetric flow rate, all flow rates were measured for a single temperature before the temperature was increased. Steady state heat flux profiles over the course of the reactor are exemplarily displayed in Fig. 4a for  = 2, 4, and 6 mL min−1 and Tpreheat = 40 and 50 °C.

Since the reaction channel is not covered by TEM 1, no heat flux is measured by the first module. In general, the determined heat fluxes decreased over the course of the channel. The driving force for heat transfer ΔT, in this case from media to surroundings, is highest at the inlets. Thus, the heat flux signal above TEM 2 is the highest. With decreasing driving force ΔT along the reactor, subsequent TEMs exhibited smaller heat fluxes. Higher amplitudes were observed for higher volumetric flow rates, which are due to an increase in inlet temperature and a decrease in heat loss over the feed tube between thermostat and reactor. In addition, the heat transfer coefficient between media and reactor increases with higher Reynolds numbers, improving heat transfer as well. The small channels result into a large specific surface area which leads to high amounts of transmitted heat. Its distributions on measured heat flux and heat loss show that the portion of measured heat flux ranges between 35 and 62 %, as can be seen in Fig. 4b. Based on this distribution, the importance of the thermal characterization becomes evident.
3.3 Validation of Automated Calorimeter Performance – Neutralization Reaction
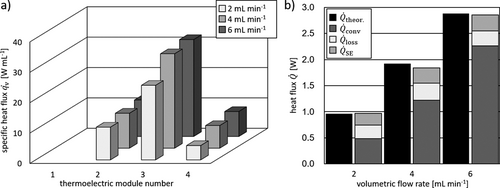
The data obtained for the neutralization reaction of HCl and NaOH is used to confirm the accuracy of the automated calibration method and execute automated testing. The heat flux profiles were recorded in steady state mode and are displayed in Fig. 5a.

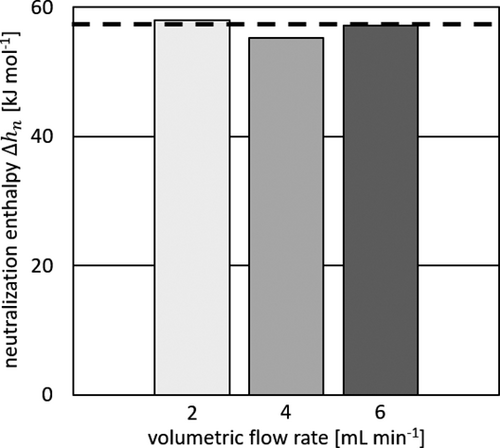
Concerning the measured heat flux signals in Fig. 5a, no significant differences were noticed as the peak signal is located above TEM 3 throughout all flow rates. A slight increase with higher volumetric flow rates is, as in the heat transfer experiments, due to an increase of the heat transfer coefficient. The measured neutralization heat and the observed color change from colorless to pink indicate full conversion within the microreactor. Fig. 5b displays the experimental heat fluxes in good accordance to the theoretical value, which is calculated on the basis of Δhn = 57.6 kJ mol−1 26. The obtained percentage of heat loss for a given flow rate is obtained from the previously conducted heat transfer experiments. If the reaction is completed in the reactor, the measured neutralization enthalpy is around the literature value. The measured neutralization enthalpies are shown in Fig. 6 for varying volumetric flow rates and compared to the literature value.

The obtained values show good agreement with the value taken from literature. Averaging the measured neutralization enthalpies yields a mean value of 56.8 ± 1.2 kJ mol-1, which leads to a deviation of less than 1.5 % from the literature value. Therefore, the presented automated calibration procedure is validated and the performance of the calorimeter was shown with this testing.
4 Conclusion and Future Work
In this study, an automated calibration setup and method for a microfluidic reaction calorimeter were developed and evaluated based on thermoelectric modules and commercially available microreactors. The calibration using the Joule effect was applied and measured thermoelectric voltage and electrically generated heat flux were correlated directly. The automated triple calibration of four TEMs took about 16 hours, which is reasonable as no supervision or manual intervention is necessary. The thermal characterization of a commercially available microreactor and the investigation of a neutralization reaction were also performed automatically. Measured neutralization enthalpies show good agreement to literature data and proved the applicability of the automated calibration method on the generation of thermokinetic data. With the current calibration method, only reaction enthalpy of exothermic reactions can be determined. A calibration with a defined cooling power would enable the determination of the reaction enthalpy of endothermic reactions, as this also generates a temperature difference and thus a measureable thermoelectric voltage at the TEMs. Future studies will address the development of an isothermal operation mode of the calorimeter, also examining automated concepts. The kinetics of fast and highly exothermic reactions will be investigated. Furthermore, inline analytics should also be integrated in order to have a direct feedback from the execution of experiments.
Acknowledgements
The German Federal Ministry of Economic Affairs and Energy (BMWi) is acknowledged for funding this research of the Industriellen Gemeinschaftsforschung (IGF, IGF project: 20819 N), which is organized by the Arbeitsgemeinschaft industrieller Forschungsvereinigung (AiF) and the Forschungs-Gesellschaft Verfahrenstechnik e.V. (GVT). Special thanks are given to Carsten Schrömges, technician at Laboratory of Equipment Design, and to the faculty's mechanical and electrical workshop, which did an excellent job in manufacturing the components of the microfluidic calorimeter. Open access funding enabled and organized by Projekt DEAL.
Symbols used
-
- fcal [W V−1]
-
calibration function
-
- hn [J mol−1]
-
molar neutralization enthalpy
-
 [W]
[W] -
heat flux
-
- R2 [–]
-
coefficient of determination
-
- Re [–]
-
Reynolds number
-
- T [K]
-
temperature
-
- U [V]
-
electrical voltage
-
 [m3s−1]
 -
volumetric flow rate
Greek letters
-
- Δ [–]
-
difference
Sub- and Superscripts
-
- app
-
applied
-
- cal
-
calibration
-
- cool
-
cooling capacity
-
- el
-
electrical
-
- preheat
-
preheating-related
-
- SE
-
Seebeck element-related
-
- top,loss
-
heat flux loss over reactor top
-
- tot
-
total
Abbreviations
-
- HCl
-
hydrochloric acid
-
- NaOH
-
sodium hydroxide
-
- PLC
-
programmable logic controller
-
- PMMA
-
polymethylmethacrylate
-
- PTFE
-
polytetrafluoroethylene
-
- TEM
-
thermoelectric module


