Abstract
Tin foil and SnOx/C gas-diffusions electrodes (GDEs) were investigated via electrochemical impedance spectroscopy (EIS) to extract the differential double-layer capacitance (Cdl) as a measure of the wetted surface area. Time-dependent Cdl values revealed an immediate stationary wetting for tin foil electrodes while a distinct increase of Cdl – which becomes stationary with time – was observed for GDEs. The time-dependent wetting behavior of the GDEs was substantiated by physical post-mortem characterization. Since the wetted surface area determines the number of reachable active sites the performance of GDEs should be normalized to the wetted surface area for evaluation of reactivity.
1 Introduction
In order to meet the targets set out in the Paris agreement and limit global warming to as close as possible to 1.5 °C to mitigate its worst outcomes, it is clear that the world needs to rapidly decrease its greenhouse gas emission output and ultimately reach net-zero emissions by middle of the century, as outlined in the special report of the IPCC on that matter 1. This applies not only to switching power generation to low-carbon alternatives, which is relatively straightforward, but needs to be realized for all sectors, including mobility, heating, agriculture, and industry 2, 3.
Particularly for the latter, electrolysis is a central technology and therefore at the core of decarbonization efforts as it allows the direct integration of renewable electricity into various industrial processes either directly or via the production of intermediate species that are then further processed or upgraded. Prominent examples are the use of hydrogen in steel production, for the production of synthetic fuels for aviation and shipping, or as feedstock in the chemical industry 4, 5.
An alternative to water electrolysis to produce green hydrogen for subsequent conversion is the low-temperature CO2 electrolysis in which CO2 is electrochemically reduced to small organic molecules such as CO, formate/formic acid, ethylene, or ethanol in one step 6, 7. One of the key components of such an electrolyzer is the gas-diffusions electrode (GDE), which facilitates the effective and intimate contact between liquid electrolyte and the gaseous reactant 8, 9. This type of electrode is also employed in other electrochemical reactions in which gaseous reactants, e.g., O2, CO2, N2, are supplied to the system as in alkaline fuel cells, at the positive electrode in metal-air batteries as well as in the form of so-called oxygen-depolarized cathodes in the chlor-alkali electrolysis.
In the last decade, tremendous effort has been dedicated in the scientific community to optimize and understand the CO2 reduction reaction (CO2RR), which led to significant advances as evident by the improved key performance indicators. At the same time, as the process becomes more mature and closer to commercialization, topics more relevant to application are slowly shifting into the focus of attention 10. Besides engineering aspects like electrolyzer design and system integration, this also includes GDE development, for which increasingly sophisticated investigation and development efforts have been implemented in the last years 11-13. This has led to promising results with regard to achievable current densities and desired product distribution but also made visible that a more knowledge-based optimization is required 14-18. Still, long-term stability is an issue that has not been solved and real profound studies in which the complex interplay between electrode manufacturing, its structural properties and electrochemical performance are studied in detail are still rarely encountered.
An important aspect in this respect is the wetting behavior of the porous electrode, which is too often not taken into consideration when evaluating the electrochemical properties of the GDE. In the GDE, the region where electrolyte, gas phase and electrocatalyst meet and the reaction takes place is the so-called triple-phase boundary. As its constitution determines the effectiveness of the electrode, which is manifested in achievable reaction rates and corresponding overpotentials, understanding its properties, magnitude and stability/dynamics is crucial for the optimization of the process. Some work on this topic has been published recently shedding light into how the wettability of the GDE proceeds and how it influences its characteristics 19, 20. In this communication, we want to expand that knowledge and show how the dynamics of the wetting process need to be taken into account when investigating GDEs as compared to planar metal foil. To do so, we introduce a combination of electrochemical techniques and post-mortem analysis to visualize the electrolyte's penetration into the porous electrode during operation. While a carbon-based GDE for electrochemical CO2 reduction to potassium formate with tin-based electrocatalyst will serve as reference system herein, the approach is relevant for and transferable to all applications in which GDEs with liquid electrolyte are employed as the underlying phenomena are the same and the described analysis technique suitable as well.
2 Experimental Section
The wetting behavior of tin foil and carbon-based tin-loaded GDEs during CO2RR was characterized in terms of double-layer capacitance, Cdl, which is proportional to the wetted surface area and was obtained via EIS. All electrolysis experiments were conducted in a classic three electrode setup (FlexCell®, Gaskatel). 3.14 cm2 of the corresponding working electrode were exposed to the electrolyte. In all experiments the electrolyte was 1.0 M KHCO3 solution obtained by mixing solid KHCO3 (≥ 99 %, Roth) with pure water (resistivity > 18 MΩ). The reversible hydrogen electrode was used as reference while platinum foil served as counter electrode. The temperature was controlled to be 30 °C. A Zennium electrochemical workstation (Zahner-elektrik GmbH & Co. KG) was used to record impedance spectra. The corresponding evaluation software (Thales®) was used for equivalent circuit modeling (EQCM) of the impedance spectra. In both cases, Cdl was determined via EQCM after identification of the charge-transfer semi-circle. Further information about the different experimental setups is provided below.
Tin Foil Electrodes
Detailed information about the experimental procedure as well as performance parameters (Faraday efficiencies for CO2RR and hydrogen evolution reaction) can be found in a previous work 21. Briefly, the tin foil (99.998 %, Alfa Aesar, 0.1 mm thickness) electrode was immersed for 30 s in 1.0 M HNO3 (Pan Reac AppliChem 1N) to remove surface impurities followed by rinsing with deionized water. Before starting the experiments, the electrolyte was purged in situ at a flow rate of 50 mLn min−1 (Bronkhorst® EL-Flow Select) for at least 1 h with carbon dioxide (4.5, Linde). During the tests, the CO2 bubbling continued at the above-mentioned flowrate. The EIS spectra were recorded in the range of 10 mHz to 300 kHz in galvanostatic operation mode at 4.77 mA cm−2. The excitation current was 5 mA.
Gas-Diffusion Electrodes
The preparation of SnOx/C GDEs was carried out analogous to Löwe et al. besides the used binder was substituted by PTFE, 3M Dyneon 450µm Powder TF 2053Z 22. The backpressure of the GDE was adjusted to 3 mbarg using a dip tube and water column. CO2 was used as feed gas at a flow rate of 50.0 mLn min−1 streaming towards the back side of the GDE. EIS spectra were recorded in the range of 10 mHz to 300 kHz in galvanostatic operation mode at 50 mA cm−2 while the excitation current for every experiment was 10 mA. The GDEs were physically characterized post-mortem to visualize the penetration depth of the electrolyte into the porous system after distinct time intervals. Immediately after the experiment the cell was disassembled and the GDE rinsed with deionized water. The electrode was then immersed in liquid N2 to rapidly freeze the residual electrolyte inside the porous system in order to fix the electrolyte where it was directly after the experiment. The frozen water was removed in a vacuum oven at room temperature by lowering the pressure below 1 mbara. Consecutively, the GDE was cut with a scalpel and analyzed via SEM-EDX. The signal of potassium coming from the electrolyte was mapped in the cross section of the GDE revealing the penetration depth of the electrolyte along the electrode thickness. Furthermore, a line scan of the potassium signal over the thickness of the GDE was used to quantitatively evaluate the penetration depth.
3 Results and Discussion
To demonstrate how strongly electrochemical behavior of the electrode is affected by its wetting characteristics, it is important to get insight into how the wetting process proceeds. The electrochemical double-layer capacitance is a measure of how much surface area of the electrode is in contact with electrolyte and can be evaluated by different techniques.
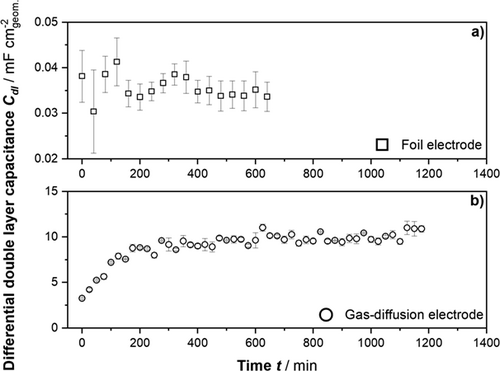
Herein, the differential double-layer capacitance values, Cdl, for tin foil and SnOX/C GDEs were extracted as described above via EQCM from the impedance spectra. Fig. 1 depicts the course of Cdl vs. time for both electrodes. It becomes evident that the scales for the capacitance values differ significantly and by that suggesting that the wetted surface area for the GDE is significantly larger compared to the foil, which is a reasonable observation since the GDE provides a substantial electrode-electrolyte interface due to the porous nature of the electrode. The specific capacitance for tin foil, calculated from the averaged Cdl values (cf. Fig. 1a) and geometric surface area, is 0.036 mF cm−2geom.. This specific capacitance value was then used to calculate the wetted surface area inside the GDE. Therefore, the Cdl values (cf. Fig. 1b) were averaged after reaching the plateau at around 300 min and divided by the specific capacitance leading to a wetted surface area of 275 cm2. However, a quantitative comparison is not straightforward, and the results should be treated carefully as the material-dependent specific double-layer capacitance may differ significantly between bare tin and tin-loaded carbon-surfaces. In addition, the time-dependent trend of the Cdl values suggests that the wetted surface area for the tin foil system is stationary right away at the beginning of the EIS measurements. On the other hand, the Cdl values for GDE increase with time and become constant after approximately 300 min indicating a slowly penetrating wetting front into the GDE, which becomes stationary with time. This dynamic wetting behavior is due to the continuing capillary penetration of the electrolyte into the GDE driven by the potential-induced decrease of the surface energy of the electrode-electrolyte interface (commonly termed electrowetting) 23, 24.

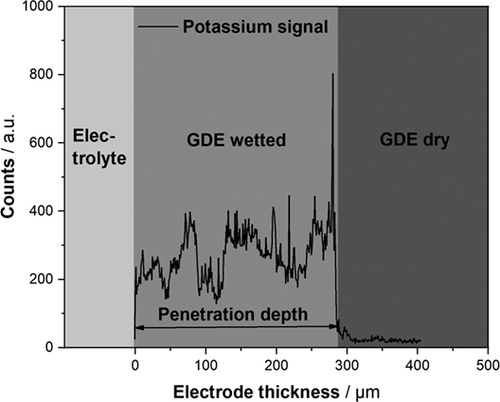
To substantiate the hypothesis that the course of the Cdl values for the GDE can be ascribed to a moving electrolyte front from electrolyte to the gas side of the GDE, the EIS measurements throughout the experiment were combined with post-mortem analysis. The electrolyte was therefore immediately fixed inside the GDE after each experiment via rapid freezing as described above. The cross section of the GDE was then analyzed via SEM-EDX mapping of potassium, which was the cation of the electrolyte salt. Fig. 2 exemplarily demonstrates how the samples were quantitatively analyzed and how the corresponding penetration depths of the electrolyte were extracted via line scans. There are three areas to be recognized: the electrolyte area represents the bulk electrolyte (naturally not mapped in SEM-EDX), the second area is the interface of the GDE (starting at 0 µm) and the porous system, which is wetted with the electrolyte as indicated by the distinct potassium signal, the third area is the dry part of the GDE, which is not wetted at all revealed by the absence of potassium. This region is not evoked by the end of the GDE since the GDE samples had an average thickness of about 945 µm.

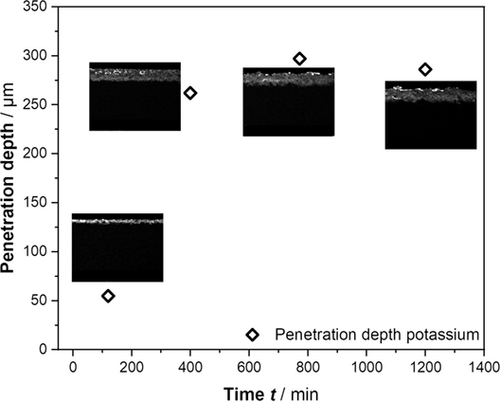
The time-resolved maps of potassium in the cross section of the GDE and the corresponding penetration depths of the electrolyte are depicted in Fig. 3. It becomes evident that the penetration depth increases with time and becomes stationary for time periods > 300 min. This post-mortem analysis supports our hypothesis based on Cdl measurements that during the beginning of electrochemical experiments for GDEs the wetted surface area is not stationary. After a few hours, the wetting front stabilizes as indicated by both the Cdl measurements and the potassium element maps.

The presented results demonstrate that the extraction of Cdl values from EIS measurements is a suitable procedure to monitor the time-resolved wetting behavior of GDEs. The time-dependent values of Cdl and the corresponding post-mortem analysis of the penetration depth of the electrolyte point out that the wetting front inside the GDE is dynamic at the beginning of the experiments. This observation is highly important since non-steady wetting conditions result in an unsteady number of active sites prohibiting an exact characterization or comparison of GDEs. A possible procedure to take care of this circumstance would be to start the electrochemical characterization of the GDEs after the wetted surface area becomes stationary, which in our case took a time of approximately 300 min. Naturally, the wetting behavior is a function of experimental conditions (potential, temperature, GDE composition, GDE backpressure, etc.) and the time span until stationary conditions are reached need to be investigated for each system and experimental parameter set. Another possible approach would be to normalize electrochemical performance parameters (e.g., achieved current density for potentiostatic operation) with respect to the Cdl value at the specific time of characterization. This procedure is suitable for characterization methods with short measurement times so that significant changes of Cdl during the measurement are circumvented. However, with the shown experimental results we wanted to draw attention to the circumstance that in contrast to foil electrodes the electrochemical properties of a GDE changes with time due to the dynamic wetting of the porous electrode (which might be accompanied by degradation phenomena). This should not be frivolously overlooked and handled with care.
4 Conclusion
This work introduces a simple technique for assessment of GDE wetting behavior and emphasizes the relevance of its evolution over time for electrochemical evaluation. Time-dependent Cdl values as a measure of wetted surface area were obtained via EIS measurements for a tin foil electrode and a SnOx/C GDE for the CO2RR. While the Cdl values for the foil were immediately stationary, the values for the GDE showed a time-dependent behavior and became constant after 300 min. Additional post-mortem element maps of an electrolyte component in the cross section of the GDE revealed that the shape of the Cdl vs. t diagram follows the penetration depth of the electrolyte into the GDE. We conclude that the wetted surface area of GDEs is a crucial factor during electrochemical evaluation since this parameter determines the number of utilized active sites and by that the electrochemical performance of the electrode. Consequently, the performance of GDEs should always be normalized to the wetted surface area for an exact electrochemical evaluation.
Acknowledgements
Open access funding enabled and organized by Projekt DEAL.
Symbols used
-
- Cdl [mF cm−2geom.]
-
differential double-layer capacitance
Abbreviations
-
- CO2RR
-
CO2 reduction reaction
-
- EDX
-
energy dispersive X-ray
-
- EIS
-
electrochemical impedance spectroscopy
-
- EQCM
-
equivalent circuit modelling
-
- GDE
-
gas-diffusion electrode
-
- SEM
-
scanning electron microscopy


