Modeling of Mixing-Precipitation Processes: Agglomeration
Abstract
A comprehensive description of the barium sulfate precipitation process in a wide range of supersaturations is presented. By using an additive to stabilize the particles, the decoupling of the primary from the secondary processes, as well as the agglomeration from aggregation was possible. By being able to study the two processes independently, a model describing the agglomeration of barium sulfate in the range of high supersaturations was validated experimentally for the first time. The proposed model has proven to describe the experiments with a high degree of accuracy in the whole range of supersaturations investigated. Additionally, by comparing agglomeration kernels of various complexity, ranges where simplifications are possible were identified, thus enabling the future development of models with better performance.
1 Introduction
Microparticle formation by precipitation is an important complex process, where process design, being challenging and expensive, may benefit from a model-based approach. However, the development of such models for reactive precipitation processes is also challenging due to the very large driving force reached.
The precipitation of microparticles has been studied by various authors experimentally as well as theoretically using barium sulfate as a model compound. A lot of effort has been devoted to the decoupling of the different phenomena involved to study them separately, thus resulting in most of the studies focusing on a relatively small range of concentrations. This allowed for the identification of the governing mechanisms and for the development of the first principle equations describing the various mechanisms in the process like nucleation and growth 1, 2.
However, the industrial processes are operated under conditions where such decoupling is not possible and the various simplifications, like disregarding agglomeration, are no longer valid. Some work has been performed in studying agglomeration under such conditions, but the resulting models were only developed for limited values of supersaturation 3, 4, whilst a comprehensive description valid in a wide range of operating conditions and enabling predictions and process design is still lacking.
The aim of this work is to come up with a comprehensive description of the barium sulfate precipitation process in a wide range of supersaturations by applying a rigorous approach to the description of the kinetics of precipitation as well as to the definition of the experimental protocol. Ultimately this will provide new insight into the study of reactive precipitation at high supersaturations.
2 Primary Processes Revisited
The mechanisms and kinetics of barium sulfate precipitation have been studied by multiple authors over the recent years, resulting in a plethora of expressions for describing the primary mechanisms in the process – ranging from purely empirical to more predictive ones derived from first principles. The nucleation and growth rates calculated using different models proposed in the literature exhibit major differences among them. This inconsistency could be attributed to the difficulty in obtaining accurate experimental data for estimating the model parameters. This difficulty stems from the high driving force attained during reactive precipitation and the resulting small time- and length-scales of the process. But even when referring to the purely predictive models in the literature, different expressions can be found. Therefore, in order to understand the differences between various approaches and to choose the most appropriate model, a brief overview of the description of primary processes in the scope of barium sulfate precipitation is presented below.
2.1 Driving Force of Precipitation
 (1)
(1) (2)
(2) (3)
(3)where kB is the Boltzmann constant, T is the temperature, a and ae are the actual and the equilibrium activities of the molecule, respectively.
 (4)
(4)where νi is the number of i-th ions in the molecule, and μs,i is its corresponding chemical potential.
 (6)
(6) (7)
(7)where ci is the molar concentration of the i-th ion, KSP is the solubility product, and  is the mean ionic activity coefficient. A comprehensive comparison of different models used for the calculation of the activity coefficient has been presented earlier 1. In this work,
  is calculated using the Pitzer model, taking into account the complex formation of barium sulfate 1.
 (8)
(8)where s = S2. In most of the cases, this thermodynamically incorrect definition does not affect the final results because its effect is compensated by the estimated values of other model parameters. In the following section, an example showing the importance of using Eq. 7 instead of Eq. 8 to describe the supersaturation ratio in the context of the definition of nucleation rate is presented.
2.2 Nucleation
 (9)
(9)where  is the supersaturation (we will consider both
  and
and  ).
).
A common approach to obtain the kinetic parameters A and B is to linearize Eq. 9 and fit it to the experimental data. In Fig. 1, results for the homogeneous and heterogeneous nucleation obtained by Vicum et al. 1 (dashed line) using the experimental data by Nielsen 5 (square markers) and  are presented. The measured nucleation rates in the homogeneous regime are in the range of 1010–1020 # m−3s−1.
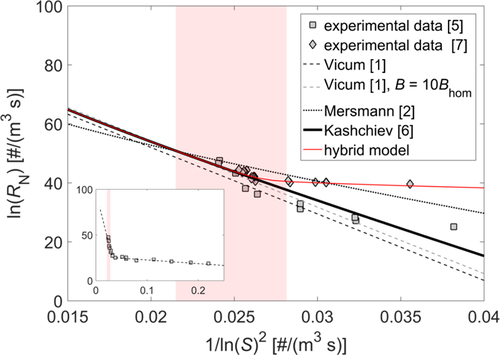
Since the measurement of the nucleation rate is performed by counting under a microscope the number of crystals formed per unit volume, the resulting measured value must be, to some degree, fraught with an uncertainty. To get an idea of the effect that such uncertainty might have on the estimation of the kinetic parameters, the nucleation rates were recalculated using a value of the kinetic parameter Ahom ten times larger than that reported by Vicum et al. and the resulting values are also plotted in Fig. 1 (gray dashed line). As it can be readily seen, bearing in mind the accuracy of the experimental data in this range of supersaturation values, a change of an order of magnitude in Ahom yields a rather similar fitting of the experimental data. This observation leads to a drastic reduction of the confidence in the parameters estimated by fitting the experimental data.
 (10)
(10) (11)
(11)where Ce is the molecular solubility defined as  .
.
 (12)
(12) , and the monomer diffusion coefficient, D, being defined as:
 (13)
(13) (14)
(14) are indicated. As it can be seen, they fit the experimental data rather poorly. This is often attributed to the difficulty in calculating the specific surface energy of the cluster/solution interface and is fixed by changing it to the value which results in a better match. But, as pointed out by Kashchiev and van Rosmalen 6, the reason for the poor fit lies more likely in the incorrect definition of the monomer attachment frequency and of the equilibrium concentration of nuclei (see 6 for more details). After applying the necessary changes, they report the following expression for Ahom
6:
 (15)
(15)with  . Nucleation rates calculated using Eqs. 9–11 and Eqs. 13–15, with the supersaturation in Eq. 9 and (15) defined using Eq. 7, are plotted in Fig. 1 (solid line). As it can be seen, the calculated values fit the experimental data very well. Moreover, since this expression is derived purely from theoretical considerations, apart from being free of the inaccuracy stemming from the quality of the experimental data used for parameter estimation, it is also applicable to supersaturation levels outside the range used by Nielsen 5, where in the case of fitted parameters an extrapolation would be needed.
At this point, the importance of employing an appropriate expression to describe the supersaturation ratio should be underlined. In the case of parameters A and B being independent of supersaturation, when fitting parameters using Eq. 9, it is irrelevant if supersaturation is defined as S2 or S, because the exponent can be pulled out in front of the logarithm and lumped into the constant B. But, when using Eq. 15 to define A as a function of supersaturation, this is no longer possible and the importance of applying Eq. 7 is apparent.
 (16)
(16) (17)
(17)where a and b are the proportionality constants that need to be estimated from the experimental data.
Since the heterogeneous nucleation is very system-dependent, instead of using the experimental data by Nielsen 5 which was obtained with a batch reactor, we have used the experimental data by Mohanty et al. 7 which was obtained using a continuous setup similar to the one used in this work. The parameters a and b were therefore estimated by fitting Eqs. (7), (9), (10), (15)–(17) to the experimental data in 7 and are equal to 3 × 10⁻²¹ and 0.001, respectively. In Fig. 1, the resulting nucleation rate calculated by a hybrid model, where the fully predictive homogeneous term (Eqs. (7), (9), (10), (15)) is combined with the estimated heterogeneous term (Eqs. (7), (9), (10), (15)–(17)), is plotted (red solid line) together with the experimental data obtained by Mohanty et al. 7 (lozenge markers).
2.3 Growth
The growth of crystals is usually described as a two-step process, where the solute molecules first diffuse from the bulk to the crystal surface (diffusion step) after which they are integrated into the crystal lattice (integration step). Depending on the supersaturation, this process can be either integration- or diffusion-limited. Due to the high supersaturations reached during reactive precipitation processes, the growth rate of barium sulfate is usually assumed to be diffusion-limited throughout the whole process 4, 8, 9, also when the supersaturation is almost completely depleted as the growth of crystals at low supersaturations is negligible compared to that at high supersaturations. However, in this work, this assumption is not valid as, alongside the primary processes, we are also interested in describing agglomeration, which represents a considerable contribution also at low supersaturations, thus requiring the use of a two-step model that accounts for both phenomena.
where kr is the integration rate coefficient and the subscript “int” refers to the crystal-solution interface.
In this case whether the supersaturation is defined as S2 or S is not as crucial as in the case of nucleation (see Sect. 2.2). The reason for this is that the above given power law expression is actually an approximation of the growth mechanisms governing the integration of molecules in the crystal lattice, which have a general form of  11. Therefore, the exponent can be pulled out in front of the logarithm and lumped into the constant. In this work,
  and the value of kr = 9.1 × 10⁻¹² m s−1 obtained by Vicum et al. 1 using the data gathered by Nielsen and Toft 10 have been used.
where kD is the activity-based mass transfer coefficient.
 (20)
(20)where L is the diameter of a particle, ρs is the solution density, and Sh is the Sherwood number which, assuming that the particles are spheres smaller than 1 µm, is constant and equal to 2 15.
 (21)
(21)In the range of supersaturations investigated in this work, Lc ≅ 2Lm = 10−9 m, thus indicating that the nucleus consists of only a couple of molecules and, consequently, that the assumption of sphericity might not be valid anymore. The experimental data for very small particles is scarce; however, some researchers have reported Sh much lower than 2 14, 16. If this discrepancy between the theoretical limit and the experimental results is due to the experimental error or to the effect of shape is unclear. However, for simplicity, in this work a constant value of kD = 8 × 10⁻⁵ m kg s−1mol−1 is used.
3 Describing Agglomeration
Apart from the primary processes described in the previous section, particles in a suspension can also undergo secondary processes, namely, agglomeration, aggregation, and breakage. When particles collide, they can form ensembles that can be held together either by crystalline bridges (agglomerates) or by the van der Waals or electrostatic forces (aggregates). Due to the lack of a solid connection between the particles, the aggregates can be re-dispersed by either changing the ionic strength of the solution or by changing the flow conditions or by introducing additives, thus making aggregation a reversible process. On the other hand, due to the much higher strength of the crystalline bridge, agglomeration is considered to be irreversible as the agglomerates can only be separated by applying high shear and by physically breaking them apart. Since the experimental procedure applied in this study allows for the decoupling of aggregation from agglomeration (see Sect. 5.1), only agglomeration is considered.
 (23)
(23)where ψ is the sticking probability and βcol is the collision kernel. Below, a brief summary of approaches to describe the two terms is presented.
3.1 Sticking Probability
 (24)
(24) (25)
(25)Eq. 24 is derived from the theory of drop coalescence, whereas Eq. 25 expresses proportionality of ψ to the growth rate. Several authors have reported a better agreement with the experimental data using Eq. 25 instead of Eq. 24 3, 17. In this work, Eq. 25 is used to describe the sticking probability.
 (26)
(26)where kc is a constant combining parameters of hydrodynamic and material properties, ε is the energy dissipation rate, ν is the kinematic viscosity, and  is the mean diameter of the agglomerate.
 (27)
(27)where k is the turbulent kinetic energy and Cµ = 0.09 is a model constant in the k-ε model of turbulence.
3.2 Collision Kernel
 (28)
(28)where Li and Lj are the diameters of the two colliding particles.
 (29)
(29) , is defined as
 (30)
(30) (31)
(31) (32)
(32) (33)
(33)where A is the Hamaker constant, which is 1.7 × 10⁻²⁰ J for barium sulfate in water 26.
 (34)
(34) (35)
(35)I is the ionic strength of the solution.
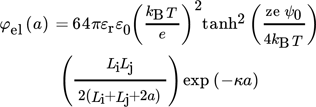
The main difficulty in applying Eq. 34 to calculate the electrostatic potential energy is in obtaining the correct values for the surface potential. Often, Ψ0 is calculated using a measured ζ-potential. This approach is feasible not only when the experiments have a rather high accuracy, but also when the relation of the ζ-potential to the surface potential is known accurately. Unfortunately, this is not always the case and usually the ζ-potential and the surface potential are just assumed to be equal 28.
 (36)
(36)where  is the concentration of the barium ions at the isoelectric point.
Moreover, the effect of ions on the relative permittivity needs to be considered. Gavish et al. 30 have studied the effect of NaCl concentration on the relative permittivity of barium sulfate and stated that in the range investigated in this work such effect is less than 3 % and, therefore, can be considered negligible.
 (37)
(37)where  is the ratio between the actual diffusion coefficient, Dij, taking into account the distance between the particles and their size, and the diffusion coefficient calculated using Eq. 30 assuming that particles are widely separated relative to their dimensions, i.e.,
  .
.
In this work, results for a set of a and of Li/Lj reported in the literature (see Fig. 2 in 31) were used to create a look-up table that was used for interpolating the required values of D* during our calculations.
 (38)
(38)Baldyga and Orciuch 32 have proposed an expression for an agglomeration kernel when the flux additivity cannot be applied. However, it has been shown that in the case of fast agglomerating systems, both contributions are independent 33 and especially for the case of barium sulfate agglomeration, both models yield similar results 3. Therefore, in this work Eq. 38 is applied.
4 Modeling
4.1 Population Balance Model
 (39)
(39)where n is the number density of particles, t is the residence time given by the axial coordinate along the tubular reactor divided by the velocity of the solution, and B and D are the birth and death terms due to agglomeration.
 (40)
(40) (41)
(41) (42)
(42) (43)
(43) (44)
(44)where m3 and m4 are the third and fourth moment of the distribution, respectively.
4.2 Computational Fluid Dynamics (CFD)
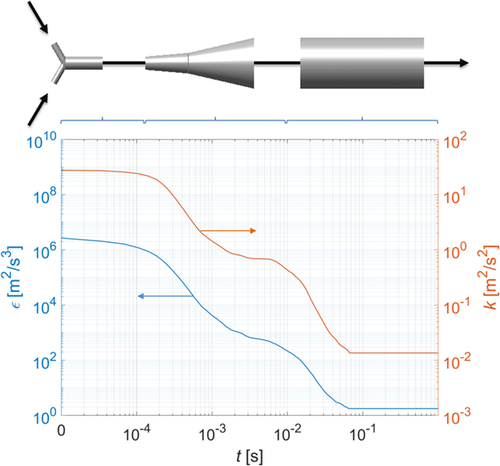
The agglomeration kernel depends, among others, on the fluid dynamics in the system. Due to the series of expansions, the flow conditions in the mixer change as the solution moves from the inlets through the mixing zone and out to the reaction tube (see Fig. 2). Therefore, even though the mixing effects can be neglected, the evolution of the energy dissipation rate and of the turbulent kinetic energy along the reactor path needs to be known. To obtain the required values of ε and k, a CFD model of the system has been developed using the commercial CFD software Fluent 17.2. To solve the Navier-Stokes equations, a standard RNG k–ε model of turbulence has been used together with an enhanced wall model to describe the near-wall flow.
 (45)
(45) (46)
(46)where x is the position along the length of the tube; f(ε(x)) and f(k(x)) are the position-dependent probability distribution function of the energy dissipation and the turbulent kinetic energy in the reactor, respectively. The resulting dependence, expressed as a function of residence time, is illustrated in Fig. 2.
5 Experimental
5.1 Chemicals and Methods
The chemicals barium chloride dihydrate (≥ 99 %, Sigma-Aldrich Switzerland) and sodium sulfate (≥ 99 %, Sigma-Aldrich Switzerland) were used in all experiments. Precipitation of barium sulfate was carried out by mixing aqueous solutions of barium chloride and sodium sulfate under stoichiometric conditions and at a constant temperature of 25 °C. First, stock solutions were prepared by dissolving the salts in deionized water. Afterwards, due to the very small time-scale of the process requiring rapid mixing, reactants were continuously mixed in a Y-mixer (inlet diameter 0.5 mm, outlet diameter 1 mm, angle between inlets 120°) at an equal mass flow rate of 20 kg h−1, thus ensuring that mixing does not influence the precipitation kinetics 8.
A continuous, pulsation-free flow has been achieved by means of a set of micro-gear pumps (mzr-11508X1, HNP Germany) coupled with a Coriolis mass flow meter and controller (M15, Bronkhorst, The Netherlands). After mixing, the solution entered a tubular reactor with a diameter of 4 mm and length of 18 m, resulting in a residence time of about 36 s – sufficient to completely deplete supersaturation. After leaving the reactor, a sample of 100 mL was collected. After diluting the sample tenfold, the size of particles was measured by dynamic light scattering (DLS; Zetasizer Nano ZS, Malvern Instruments, UK).
5.2 Stabilization
During barium sulfate precipitation various primary and secondary processes take place simultaneously. In order to study the effect of agglomeration on the final product's properties, first the primary mechanisms needed to be decoupled from the secondary mechanisms to obtain a reference case where no agglomeration takes place. Second, agglomeration had to be distinguished from aggregation. Agglomeration and aggregation of barium sulfate can be suppressed either by electrostatic or by steric stabilization. In case of the electrostatic stabilization on the one hand, precipitation is performed with an excess of barium ions  , which adsorb on the crystal's surface, thus increasing the repulsive forces and therefore reducing the collision rate of particles 35. On the other hand, in the case of the steric stabilization, a polymer adsorbs at the surface, thus physically separating particles and subsequently reducing the sticking probability.
The problem with the electrostatic stabilization is that even though the primary processes can be decoupled from the secondary ones, the decoupling of agglomeration from aggregation is not possible as it would require the introduction of barium ions into the system after the supersaturation is depleted. This would lead to an increase of supersaturation and reintroduction of precipitation. For more information on the non-stoichiometric precipitation of barium sulfate, see 1. Therefore, in this work steric stabilization using as a surfactant an aqueous solution of a polyethercarboxylate (Melpers45, BASF, Germany) has been applied.
Two types of experiments with the surfactant were performed: (1) to study the primary processes only, the surfactant was added to the barium chloride solution, thus preventing both agglomeration and aggregation right from the beginning of the crystallization process; (2) to decouple agglomeration from aggregation, the surfactant was added to the sample collected at the end of the reaction tube where the supersaturation was already depleted, thus resulting in the de-aggregation of crystals.
6 Results
Two types of experiments have been performed: one where only primary processes were active and one where growth, nucleation, and agglomeration took place simultaneously. Both cases were investigated for a wide range of initial salt concentrations varying from 0.015 to 0.1 mol kg−1. In Tab. 1, all the initial concentrations studied together with the corresponding supersaturations are reported. To make easier the comparison with the previously reported work on the barium sulfate precipitation, where the quantity S defined by Eq. 8 was used, here also the same definition of the supersaturation was employed.
|
|
|
S |
|---|---|---|
|
0.015 |
0.015 |
404 |
|
0.020 |
0.020 |
473 |
|
0.025 |
0.025 |
532 |
|
0.030 |
0.030 |
583 |
|
0.035 |
0.035 |
629 |
|
0.050 |
0.050 |
741 |
|
0.100 |
0.100 |
978 |
6.1 Particle Stabilization
To determine the amount of additive required to stabilize the particles under the investigated conditions, experiments were performed where the initial concentration of additive in the inlet, cadd, was varied from 0 to 16 g kg−1 (concentration of polymer per mass of solution). We have observed that for all the supersaturations investigated, cadd = 4.5 g kg−1 was sufficient to see no more change in the measured particle size, which is in agreement with the data reported in the literature 8, 36, 37. In the next section (Sect. 6.2), it will be discussed whether agglomeration was completely suppressed or not.
6.2 Primary Processes
To see the effect of agglomeration on the final size of particles, first the experiments where only nucleation and growth are active were performed. In Fig. 3, the measured average sizes of crystals obtained using various initial supersaturations and the additive in the barium chloride feed solution are depicted. As expected, by increasing the initial supersaturation, the size of crystals decreases.
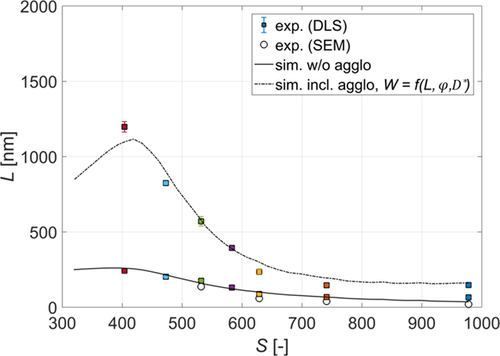
To check the accuracy of the DLS measurements, scanning electron microscopy (SEM) pictures of crystals obtained from experiments performed at four different supersaturations, namely, 532, 629, 741, and 978 (calculated using Eq. 8), have been taken (see Fig. 4). By measuring the sizes of individual crystals in each picture, an average size of crystals for each of the investigated supersaturations was obtained and the results are also plotted in Fig. 3 (circles).
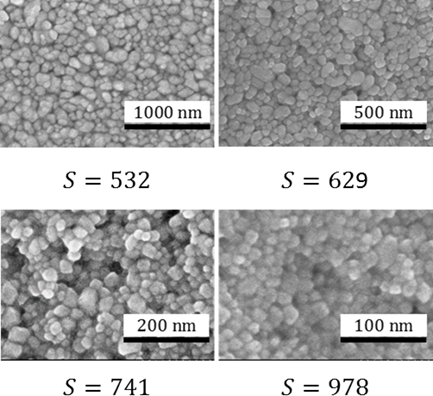
As it can be seen, the results obtained from the SEM match very well with the DLS measurements, thus indicating that the DLS measures the size of crystals accurately enough. Additionally, because the measured size corresponds to the size of the primary particles, the amount of additive used was indeed sufficient to successfully suppress the secondary mechanisms. The slight difference in the case of the highest supersaturation could be explained by the fact that primary crystals are too small for the additive particle to attach to their surface and only when they have agglomerated to a larger size, the stabilization was effective.
In Fig. 3, the simulation results are also indicated (solid line). As it can readily be seen, the simulations match the experiments rather well. The good agreement with the experimental data is especially remarkable in the range when homogeneous nucleation occurs (S > 450) where the model is almost fully predictive with only one parameter obtained from experiments.
Given the abundance of barium sulfate precipitation studies, one could try and compare the experimental as well as the simulation results obtained in this work with those reported in the literature. Unfortunately, it is not as trivial as it may seem at first sight. Schwarzer et al. have used a different system where the surface potential can no longer be approximated by Eq. 36 and the additional effect of adsorption of protons must be considered 9, 38. Vicum et al. have employed the same system as the one in this work allowing for a comparison between simulation results, but they have studied the precipitation process in a continuous stirred-tank reactor (CSTR) where the assumption of a perfectly mixed system is no longer valid and the effects of mixing have to be considered 1, 39. Furthermore, the experiments were performed at much lower supersaturations where the shape of precipitated barium sulfate crystals differ greatly from a sphere, thus requiring the use of different shape factors. Nevertheless, their model can be compared with the approach in this work.
From the available literature, only the results reported by Kügler et al. 8 can be taken for comparison, because they used the same system and a very similar experimental setup. In Fig. 5, the experimental (triangles) as well as simulation (blue line) results obtained by Kügler et al. are compared with the model used in this work (black solid line). The model used by Kügler et al. was proposed by Mersmann et al. 2 and has been described in Sect. 2.2. As it can be seen, the experimental results match closely with those reported in this work. Moreover, in the range of supersaturation between 600 and 1000, both models perform similarly. But for lower supersaturations (S ∈(400,600)) the model used in this work seems to describe the experimental results better than the one proposed by Mersmann et al.
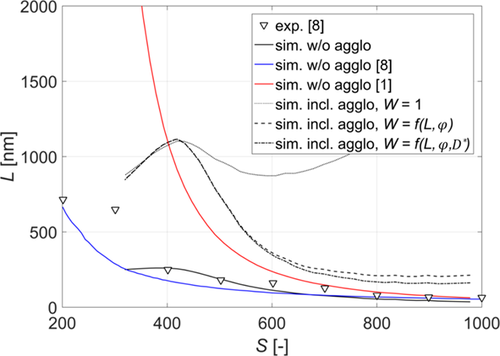
The lowest supersaturation investigated by Kügler et al. has a value of about 200 whereas in this work, due to the expected change of shape of precipitated crystals, the lowest simulated supersaturation value is 350. As reported by Podgórska 1, 40, for supersaturation values lower than 350, precipitated crystals have a surface shape factor equal to 348, i.e., roughly ten times larger than the one for higher supersaturations, thus resulting in much higher actual growth rates and an underestimation of crystal sizes when not taking it into an account. This could explain the sudden increase in the size of the precipitated crystals in the case of supersaturation lower than 350 and the mismatch between the model presented in this work.
In Fig. 5, the simulation results using the empirical expressions proposed by Vicum et al. 1 (red line) are also displayed. For S > 800, the simulation results for all three models are very similar. For lower supersaturations though, the empirical model proposed by Vicum et al. differs from the one used in this work. The difference can be mainly attributed to the difference between the calculated nucleation rates. As it can be seen in Fig. 1, the difference between the nucleation rates calculated using the two approaches is increasing as the supersaturation decreases, thus highlighting the above-mentioned inaccuracy in fitting nucleation rates at high supersaturations (see Sect. 2.2) and how a seemingly small change in the nucleation rate can result in a very different simulation result.
6.3 Agglomeration
In Fig. 3, the measured average sizes of agglomerates obtained using various initial supersaturations are indicated. To make sure that only agglomerates and not aggregates are measured, in those experiments the surfactant was added to the sample collected after the depletion of supersaturation, ergo when nucleation, growth, and agglomeration no longer took place. As it can be seen, for all supersaturations investigated, the measured size is larger than the size of primary particles. For higher supersaturations (S > 600) this difference is noticeably smaller as compared to the lower supersaturations (S < 600) where it is not only larger, but it also rises more rapidly with the increase of the size of primary particles. This difference could be attributed to the change of the agglomeration mechanism from perikinetic to orthokinetic as the size of particles increases. For smaller particles, the perikinetic mechanism is dominant where the agglomeration kernel linearly depends on the size of particles (see Eq. 29). As the particles are becoming larger, the orthokinetic mechanism becomes dominant where the agglomeration kernel's dependence on the size of colliding particles is cubic (see Eq. 28).
The effect of different agglomeration mechanisms can be further seen by looking into the simulation results. In Fig. 5, the simulation results using the model presented in Sect. 3 are also illustrated (dotted, dashed, and dotted-dashed lines). The only model parameter, kc, has been estimated by fitting the model to the experimental data. As mentioned above (see Sect. 3), three different expressions for calculating the stability ratio were used with kc = 7.8 × 10⁻⁶ when interparticle forces were neglected (W = 1), and kc = 5 × 10⁻⁶ when electrostatic forces or electrostatic and hydrodynamic forces were considered (Eqs. 31 and 37, respectively).
As it can be seen in Fig. 5, for the largest primary particles (S < 400) all three approaches yield very similar results. This is expected, as for the largest particles, as already mentioned, agglomeration is mainly due to the orthokinetic mechanism which is not affected by the interparticle forces and depends only on the size of the particles and on the flow properties (see Eqs. 28 and 29). As the size of the particles decreases and the perikinetic contribution becomes significant, only the models including the electrostatic interparticle forces are able to describe the experimental data well (dashed and dotted-dashed lines in Fig. 5 obtained using Eqs. 31 and 37). The effect of viscous forces becomes significant only for the smallest particles (S > 550), requiring the use of the stability ratio proposed by Spielman (Fig. 5, dotted-dashed line). Overall, as can be seen in Fig. 3, by accounting for the electrostatic as well as for the viscous forces, the model proposed in Sect. 3 is able to describe experimental data in the whole range of supersaturations investigated.
Even more than in the case of primary processes, comparison of the agglomeration results presented in this work with those found in the literature is rather difficult. Kügler et al. 8 and Jasińska et al. 3 have studied the agglomeration of barium sulfate but since the energy dissipation rate in both cases is unknown, the calculation of the sticking probability as well as the collision kernel is not possible. Marchisio et al. 4 have investigated a much lower supersaturation, where the shape of precipitated barium sulfate crystals can no longer be approximated by a sphere. Given the above-mentioned difficulties, no comparison with the literature has been possible.
7 Conclusions
By applying a rigorous approach to describe the kinetics of precipitation and to design the experimental protocol, a comprehensive description of the barium sulfate precipitation process in a wide range of supersaturations was achieved. The proposed experimental method allowed not only for the decoupling of the primary from the secondary processes but, more importantly, also of the agglomeration from aggregation. By being able to study the two processes independently, a model describing the agglomeration of barium sulfate in the range of high supersaturations could be validated experimentally for the first time.
The proposed model has proven to describe the experiments with a high degree of accuracy in the whole range of supersaturations investigated. Additionally, by comparing agglomeration kernels of various complexity ranges, where simplifications are possible, were identified, allowing for the development of models with better performance in the future.
Acknowledgements
The financial support of BASF Ludwigshafen is gratefully acknowledged. The authors thank David Ochsenbein and Hariharan Subrahmaniam, previously at ETH Zurich, for fruitful discussions and Daniel Trottmann and Markus Huber, ETH Zurich, for the technical support. This project has received partial funding from the European Research Council (ERC) under the European Union's Horizon Research and Innovation Programme under Grant Agreement No. 2-73959-18.
The authors would like to thank the late Prof. Jerzy Bałdyga (1950 – 2019) for his scientific inspiration and for his mentoring. Prof. Bałdyga's sudden and untimely death has deprived the scientific community of a true scholar, particularly in the field of fluid dynamics applied to reactive mixing and to precipitation.
The authors have declared no conflict of interest.
Symbols used
-
- A [m−3s−1]
-
kinetic parameter
-
- A [J]
-
Hamaker constant
-
- a [–]
-
proportionality constant Eq. 16
-
- a [m]
-
surface-to-surface distance between colliding particles
-
- ai [mol kg−1]
-
activity of ion i
-
- B [–]
-
thermodynamic parameter
-
- b [–]
-
proportionality constant Eq. 17
-
- Ce [kg−1]
-
molecular solubility
-
- Cµ [–]
-
constant in the k-ε model of turbulence
-
- ci [mol kg−1]
-
concentration of species i
-
- D [m2s−1]
-
diffusion coefficient
-
- e [C]
-
elementary electric charge
-
- G [m s−1]
-
growth rate
-
- I [mol kg−1]
-
ionic strength
-
- KSP [–]
-
thermodynamic solubility product
-
- k [m2s−2]
-
turbulent kinetic energy
-
- kB [J K−1]
-
Boltzman constant
-
- kc [–]
-
constant Eq. 26
-
- kD [m kg s−1mol−1]
-
activity-based mass transfer coefficient
-
- kr [m s−1]
-
integration rate coefficient
-
- L [m]
-
diameter
-
- Mc [kg kmol−1]
-
molecular mass
-
- NA [mol−1]
-
Avogadro constant
-
- n [m−3]
-
number density of particles
-
- RN [m−3s−1]
-
nucleation rate
-
- S [–]
-
supersaturation ratio Eq. 8
-
 [–]
[–] -
supersaturation ratio
-
- Sh [–]
-
Sherwood number
-
- s [–]
-
supersaturation ratio Eq. 7
-
- T [K]
-
temperature
-
- t [s]
-
time
-
- W [–]
-
stability ratio
-
- z [–]
-
valence
Greek letters
-
- β [m−3s−1]
-
agglomeration kernel
-
- γ [J m−2]
-
specific surface energy of the cluster/solution interface
-
 [–]
[–] -
mean ionic activity coefficient
-
- ε [m2s−3]
-
energy dissipation rate
-
- ε0 [C2J−1m−1]
-
electric field constant
-
- εr [m2s−3]
-
relative permittivity
-
- η [kg m−1s−1]
-
dynamic viscosity
-
- κ [m−1]
-
Debye length
-
- μ [J]
-
chemical potential
-
- ν [m2s−1]
-
kinematic viscosity
-
- ρc [kg m−3]
-
crystal density
-
- φel [J]
-
electrostatic potential energy
-
- φtotal [J]
-
total potential energy of the interparticle forces
-
- φvdW [J]
-
van der Waals potential energy
-
- ψ [–]
-
stability ratio
-
- Ψ0 [J C−1]
-
surface potential
Abbreviations
-
- CFD
-
computational fluid dynamics
-
- CNT
-
classical nucleation theory
-
- DLS
-
dynamic light scattering
-
- PBE
-
population balance equation


