Individual and joint effect of socioeconomic status and lifestyle factors on cancer in Korea
Abstract
Background
There is limited evidence on the individual and joint effect of socioeconomic status (SES) and unhealthy lifestyle on cancer. Therefore, this study aimed to examine the effects of these factors on cancer incidence and mortality.
Methods
In this population-based cohort study, income was used as the proxy of SES. A combined unhealthy lifestyle score was obtained using data on smoking, alcohol consumption, physical activity, and body mass index. Hazard ratios were estimated using a Cox proportional hazards model.
Results
The study included data on 8,353,169 participants (median follow-up period, 17 years). Although the association between low income and cancer incidence varied depending on cancer type, low income consistently increased the risk of cancer-related death with a social gradient. Unhealthy behaviors increased the risk of cancer incidence and mortality, except for thyroid and breast cancer in women and prostate cancer in men. Compared with the wealthiest and healthiest individuals, the poorest and unhealthiest men and women showed 2.1-fold (2.05–2.14) and 1.36-fold (1.31–1.41) higher risk of cancer-related death, respectively. The joint effect was most robust for lung, liver, head, and neck cancers in men and liver and cervical cancers in women; further, the effect was stronger with cancer-specific mortality than with incidence.
Conclusion
In conclusion, income and combined healthy lifestyle behaviors have individual and joint effects on cancer incidence and mortality. The effect varies by cancer type and sex.
1 INTRODUCTION
Cancer is considered a disease of disparities. Several cancers occur more frequently among the poor, particularly cancers associated with tobacco use, chronic infections, and exposure to some dietary, reproductive, occupational, and environmental factors.1 Previous analyses among the United States and Western populations suggested that cancers of the lung,2-5 upper aerodigestive tract,2, 5-8 colorectal,3, 4 stomach,3, 4, 8 liver,3 and cervical cancer3, 4, 6 appear to be more frequent among lower SES groups. In contrast, other cancers happen more in the higher SES groups, including cancer of the breast,4-6 thyroid, prostate,4, 6 and melanoma.4-6 However, this higher incidence could result from a significant proportion of early-stage cancer detected through cancer screening programs, especially for thyroid and prostate cancer, in which overdiagnosis and overtreatment have been a great concern.9, 10 In the United States, a study in 2016 revealed that early-stage thyroid cancer, melanoma, prostate cancer, and female breast cancer were significantly higher among the affluent.11 On the other hand, late-stage thyroid cancer and melanoma were not different among SES groups, and late-stage prostate cancer and female breast cancer were significantly elevated among the poor.11 This may be caused by a high proportion of early-stage cancer detected through cancer screening programs.
Socioeconomic gaps between people with cancer can be caused by disparities in lifestyle risk factors; the prevalence of smoking, high-risk alcohol consumption, and physical inactivity is higher in lower SES groups.12 Smoking has been proven to have a strong causal relationship with cancers of the lung, oral cavity, larynx, esophagus, stomach, pancreas, colorectum, liver, kidney, ureter, bladder, cervix, ovary, and acute myeloid leukemia.13, 14 There are also strong dose–response relationships between alcohol consumption and cancers of the oral cavity, pharynx, larynx, esophagus, colorectum, liver, female breast, and intrahepatic bile duct.13 WCRF/IARC recommended that it is best not to drink for cancer prevention.15 According to the American Cancer Society, people who choose to drink, would limit consuming no more than two drinks per day for men, and one drink per day for women.16 There is also strong evidence that being physically active reduces the risk of all-cause mortality and cancer of the bladder, breast, colon, endometrial, esophageal adenocarcinoma, renal, and gastric.13, 17, 18 Besides, a growing number of studies suggested that prolonged sedentary behavior increases cancer risk overall, with the most robust evidence for breast, colon, and endometrium cancers.13 Furthermore, postmenopausal breast, colorectum, endometrial, kidney, liver, esophageal, and pancreas cancers are strongly linked to overweight and obesity; while gall bladder, gastric, mouth, pharynx, larynx, ovary, and prostate cancers have a possible association.13 Therefore, the WCRF/IARC recommends maintaining a healthy weight (BMI 18.5–24.9) and having a healthy diet for cancer prevention.15
While single lifestyle factors are associated with adverse health outcomes, many studies provide evidence for how combinations of lifestyle factors have stronger associations with mortality and NCDs.19 Previous studies in Western countries use a healthy lifestyle score (HLIs-assigning 0–4 points for each risk factor, then summing all points to create the combined score) incorporated multiple lifestyle risk factors, suggesting that the combination of a healthier lifestyle is associated with a lower risk of mortality and cancer.20-23 Several other studies use a more straightforward method: assigning 1 point for each unhealthy or healthy lifestyle risk factor, then summing all points to create overall unhealthy or healthy scores, which also show similar results.24-27
Moreover, a recent United Kingdom study indicated the joint effect of a combination of lifestyle behaviors and low income on cardiovascular disease (CVD) and all-cause death, with a dose–response increased risk in most lifestyle strata and social groups when comparing to the combined reference group of the healthiest and wealthiest.28 Other studies in the United Kingdom and United States also showed that lower SES and less healthy lifestyles led to 2.65- to 3.53-fold higher mortality risks than did higher SES and healthier lifestyles.29
However, these are based on mostly Western populations and limited health endpoints28, 29; results could differ in other populations and health outcomes due to different disease patterns, risk factors, and health policies. In South Korea (hereafter Korea), few studies have evaluated the effect of SES on cancer, and they were limited by their cross-sectional design or lack of information on risk factors.30-33 Moreover, the combined effect of multiple unhealthy behaviors on cancer and its joint effect with SES has not been sufficiently described.34 Therefore, using large, representative data, we evaluated the effect of SES, the effect of a combination of unhealthy lifestyle behaviors, and the joint effect of SES and unhealthy lifestyle on cancer incidence and mortality in South Korea.
2 MATERIALS AND METHODS
2.1 Data source
The data were based on a nationwide population-based cohort provided by the Korea National Health Insurance Service (NHIS), a mandatory single-insurer system covering the entire population of Korea.35 NHIS provides benefits to all beneficiaries (97%) and medical aid (3%) for healthcare services, including biennial health screening. Information on sociodemographic factors, self-reported health behaviors, laboratory results, and healthcare utilization data from insurance claims were included.35, 36
2.2 Study population
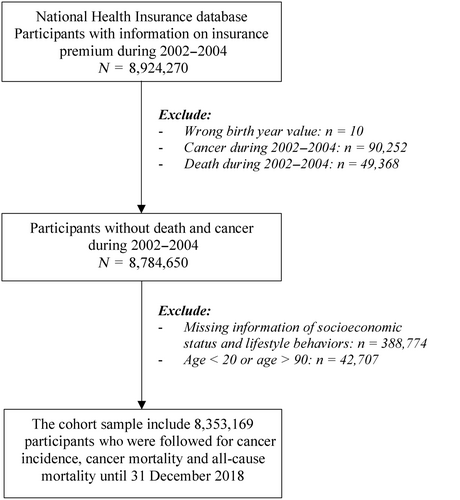
We included 8,924,270 participants whose insurance premium information from 2002 to 2004 (baseline period) was available. We excluded those with incorrect birth-years (n = 10). We created a cancer-free cohort by excluding individuals diagnosed with cancer (n = 90,252) and those who died (n = 49,368) from 2002 to 2004. Individuals with missing baseline data on socioeconomic characteristics and lifestyle behaviors (n = 388,774) and those aged <20 or > 90 years (n = 42,707) were excluded. Finally, our analysis included 8,353,169 participants (4,974,821 men and 3,378,348 women, Figure S1). Figure 1 describes the flowchart of study.
2.3 Health outcomes
The outcomes of interest included cancer-specific mortality and cancer incidence. All-cause mortality was considered a secondary outcome. Cancer-specific death was determined using the cause of death (ICD-10: C00-C99) derived from Statistics Korea. Cancer incidence was based on the ICD-10 codes in the primary diagnosis and the NHIS registration code V193, a special code representing confirmed cancer diagnosis in NHIS database.37
For men, we focused on six major cancers: lung (C33 and C34), stomach (C16), colorectal (C18, C19, and C20), prostate (C61), liver (C22), and thyroid (C73) cancers.38 We were also interested in head and neck cancers (oral cavity [C00-C14], esophageal [C15], and laryngeal cancers [C32]) which had previous evidence on social inequalities and associations with combined lifestyle risk factors.7, 39 For women, we focused on major cancers: breast (C50), thyroid (C73), colorectal (C18, C19, and C20), stomach (C16), lung (C33, C34), liver (C22), and cervical (C53) cancers.38
2.4 Socioeconomic status
Income was used as a proxy for SES and was identified using NHIS premiums.40 NHIS premiums are based on household income and are divided into 20 quintiles, with the higher quintiles corresponding to the more affluent participants. We divided the study population into five income classes from lowest to highest: Class 5 (1st–4th) Class 4 (5th–8th), Class 3 (9th–12th), Class 2 (13th–16th), and Class 1 (17th–20th).
2.4.1 Lifestyle behaviors
Lifestyle behaviors including smoking status, alcohol consumption, and physical activity, were evaluated using structured questionnaires at general health screening during the baseline period. For smoking status, participants were asked whether they are current smokers (using question with three choices: (1) do not smoke; (2) former; (3) current). For alcohol consumption, the frequency (using question with five choices: (1) rarely drink; (2) drink 2–3 times a month; (3) drink 1–2 times a week; (4) drink 3–4 times a week; (5) drink almost daily) and amount of alcohol consumed were collected. Then we calculated the amount of alcohol consumed per day, which was then classified into three groups: none, light drinking, and heavy drinking (≥2 standard drinks/day for men and ≥1 standard drink/day for women; one standard drink = 14 g of alcohol).16 For physical activity, exercise frequency per week was recorded (using question with five answer choices: (1) do not, (2) 1–2 times, (3) 3–4 times, (4) 5–6 times, (5) almost daily). People who answered “do not” were considered physically inactive. Body mass index (BMI) was calculated directly using body weight and height measured at health institutions. Participants were categorized into underweight (body mass index [BMI] < 18.5), normal (18.5 ≤ BMI < 25), obese I (25 ≤ BMI < 30), and obese II (BMI≥30) based on the World Health Organization BMI standards for Asian populations.41 The combined unhealthy lifestyle score, which ranged from 0 (least unhealthy) to 4 (most unhealthy), was determined by assigning 1 point for the following: former or current smoking, heavy drinking, physical inactivity, and abnormal BMI (BMI < 18.5 or ≥ 25).
2.5 Other covariates
Other covariates included age, sex, area of residence, and insurance subscriber type using the first recorded information. Residential areas were divided into metropolitan cities (Seoul, Busan, Daegu, Incheon, Gwangju, Daejeon, and Ulsan) and provinces (other areas). Insurance subscriber types were classified into employment subscribers, local subscribers, and medical aid. The Charlson comorbidity index (CCI) was determined using data obtained from 2002 to 2003 to reflect participants' comorbidities. The ICD-10 code B18 was used to identify participants with chronic viral hepatitis.
2.6 Statistical analysis
Descriptive analyses were performed to examine the characteristics and income groups of the study population. We used the Cox proportional hazards model to calculate adjusted hazard ratios (aHRs) and 95% confidence intervals (CIs) for the effect of income and combined unhealthy lifestyle behaviors on health outcomes. Follow-up ranged from January 1, 2002 to diagnosis (for cancer incidence), death, or end of follow-up (December 31, 2018), whichever came first. All analyses were conducted separately for men and women.
To examine the effects of income on health outcomes, the highest income group was set as the reference group. The model was adjusted for age, smoking status, alcohol consumption, physical activity, BMI, CCI, area, and insurance subscriber type as well as chronic viral hepatitis for liver cancer. The p for the linear trend was calculated by modeling the income variable as a continuous variable.
For the combined unhealthy lifestyle behaviors, the combined score was treated as a categorical variable, with five groups among men (0, 1, 2, 3, and 4) and four groups among women (0, 1, 2, and ≥3) due to the small number of women with four unhealthy behaviors. The healthiest group (score 0) was used as the reference group. The model was adjusted for age, CCI, income, area, insurance subscriber type, and chronic viral hepatitis for liver cancer. The p for the linear trend was calculated by modeling the combined score as a continuous variable.
For the joint effect of income and unhealthy behaviors on health, we classified participants into nine groups by income (low, middle, and high) and unhealthiness level (least unhealthy/moderate unhealthy/most unhealthy), as in previous studies.28, 29 Income was reclassified into low income (0th–8th), middle income (9th–14th), and high income (15th–20th) with relatively similar sizes to increase the statistical power. The combined unhealthy lifestyle score was also regrouped into three categories separately for men (0–1 as least unhealthy/2 as moderately unhealthy/3–4 as most unhealthy) and women (0 as least unhealthy/1 as moderately unhealthy/≥2 as most unhealthy). The healthiest and wealthiest individuals were used as reference. The model was adjusted for age, area, insurance subscriber type, CCI, and chronic viral hepatitis for liver cancer.
We also used logistic regression to calculate odds ratios (ORs) and 95% CIs of having individual and combined lifestyle behaviors among lower income groups compared with the highest income group. The model was adjusted for age, sex, area, insurance subscriber type, and CCI. The p for the linear trend was calculated by modeling the income variable as a continuous variable.
Statistical analyses were conducted using SAS Enterprise Guide Software (version 7.1, SAS Institute).
3 RESULTS
3.1 Characteristics
A total of 8,353,169 participants were included, with 4,974,821 men (59.56%) and 3,378,348 women (40.44%). The mean age was 43.75 years, with most participants aged 20–64. Men were more likely to be smokers, heavy drinkers, and have an abnormal BMI, while women were more likely to be physically inactive and underweight; they also had more low-income participants and less employment subscribers (Table 1). Characteristics of each income group among men and women are described in Tables S1 and S2, and health outcomes among participants are described in Table S3.
| Characteristics | Total | Men | Women | |||
|---|---|---|---|---|---|---|
| 8,353,169 | 4,974,821 (59.56%) | 3,378,348 (40.44%) | ||||
| N | % | N | % | N | % | |
| Age | ||||||
| Mean (SD) | 43.75 (13.54) | 42.67 (12.63) | 45.35 (14.64) | |||
| 20–39 | 3,405,575 | 40.77 | 2,274,828 | 45.73 | 1,130,747 | 33.47 |
| 40–64 | 4,242,822 | 50.79 | 2,371,747 | 47.67 | 1,871,075 | 55.38 |
| 65+ | 704,772 | 8.44 | 328,246 | 6.60 | 376,526 | 11.15 |
| Smoking status | ||||||
| Never | 4,727,473 | 56.59 | 1,519,799 | 30.55 | 3,207,674 | 94.95 |
| Former | 831,113 | 9.95 | 770,870 | 15.50 | 60,243 | 1.78 |
| Current | 2,794,583 | 33.46 | 2,684,152 | 53.95 | 110,431 | 3.27 |
| Alcohol consumption | ||||||
| None | 3,603,081 | 43.13 | 1,222,217 | 24.57 | 2,380,864 | 70.47 |
| Light drink | 3,841,287 | 45.99 | 2,942,805 | 59.15 | 898,482 | 26.60 |
| Heavy drinka | 908,801 | 10.88 | 809,799 | 16.28 | 99,002 | 2.93 |
| BMI | ||||||
| Mean (SD) | 23.84 (3.19) | 24.22 (3.04) | 23.28 (3.33) | |||
| <18.5 | 274,817 | 3.29 | 96,618 | 1.94 | 178,199 | 5.27 |
| 18.5–24.9 | 5,238,800 | 62.72 | 2,975,884 | 59.82 | 2,262,916 | 66.98 |
| 25.0–29.9 | 2,571,956 | 30.79 | 1,741,752 | 35.01 | 830,204 | 24.57 |
| > = 30 | 267,596 | 3.20 | 160,567 | 3.23 | 107,029 | 3.18 |
| Physical activity | ||||||
| Do not exercise | 3,915,398 | 46.87 | 1,863,282 | 37.45 | 2,052,116 | 60.74 |
| Chronic hepatitis virus | 355,874 | 4.26 | 232,329 | 4.67 | 123,545 | 3.66 |
| Income (five groups) | ||||||
| Class 5 (1th–4th) | 1,230,687 | 14.73 | 542,452 | 10.9 | 688,235 | 20.37 |
| Class 4 (5th–8th) | 1,407,134 | 16.85 | 755,442 | 15.19 | 651,692 | 19.29 |
| Class 3 (9th–12th) | 1,957,897 | 23.44 | 1,243,251 | 24.99 | 714,646 | 21.15 |
| Class 2 (13th–16th) | 1,757,695 | 21.04 | 1,148,597 | 23.09 | 609,098 | 18.03 |
| Class 1 (17th–20th) | 1,999,756 | 23.94 | 1,285,079 | 25.83 | 714,677 | 21.16 |
| Income (three groups) | ||||||
| Low (1th–8th) | 2,637,821 | 31.58 | 1,297,894 | 26.09 | 1,339,927 | 39.66 |
| Middle (9th–14th) | 2,770,251 | 33.16 | 1,778,180 | 35.74 | 992,071 | 29.37 |
| High (15th–20th) | 2,945,097 | 35.26 | 1,898,747 | 38.17 | 1,046,350 | 30.97 |
| Insurance subscriber types | ||||||
| Employment subscriber | 6,005,553 | 71.90 | 3,850,104 | 77.39 | 2,155,449 | 63.80 |
| Local subscriber | 2,333,718 | 27.94 | 1,119,397 | 22.51 | 1,214,321 | 35.95 |
| Medical benefit | 13,898 | 0.16 | 5320 | 0.10 | 8578 | 0.25 |
| Area | ||||||
| Metropolitan city | 4,020,628 | 48.13 | 2,415,312 | 48.55 | 1,605,316 | 47.52 |
| Province | 4,332,541 | 51.87 | 2,559,509 | 51.45 | 1,773,032 | 52.48 |
| Unhealthy lifestyle scores | ||||||
| 0 | 1,321,676 | 15.82 | 488,077 | 9.81 | 833,599 | 24.67 |
| 1 | 3,488,303 | 41.76 | 1,770,875 | 35.60 | 1,717,428 | 50.84 |
| 2 | 2,654,593 | 31.78 | 1,888,131 | 37.95 | 766,462 | 22.69 |
| 3 | 787,613 | 9.43 | 731,049 | 14.70 | 56,564 | 1.67 |
| 4 | 100,984 | 1.21 | 96,689 | 1.94 | 4295 | 0.13 |
- a Heavy drink: >2 drinks/day for men & > 1 drink/day for women (1 drink = 14 g alcohol).
3.1.1 Effect of income
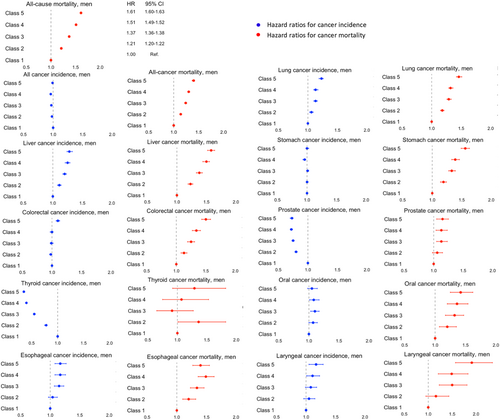
Figure 2 shows the aHRs for the effect of income on cancer incidence, cancer-specific mortality, and all-cause mortality among men after adjusting for all covariates. Detailed results are shown in Tables S4 and S5. Low income was associated with a significantly higher incidence of lung, liver, esophageal, and laryngeal cancers but a lower incidence of prostate and thyroid cancers among men. Low income was also related to a significant increase in cancer-specific mortality for most cancers except for thyroid cancer.
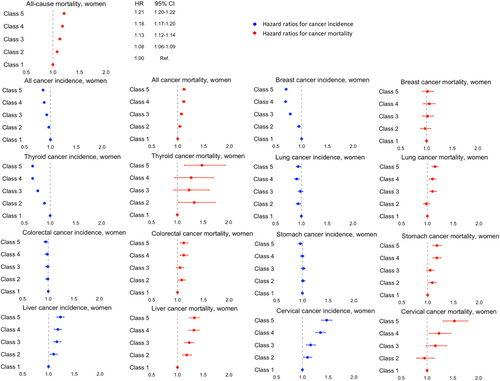
Among women, low income was associated with a higher incidence of liver and cervical cancers but a lower incidence of cancer overall, and thyroid, breast, and lung cancers. An increased risk of cancer-specific mortality corresponding to lower income levels in a gradient manner was also found, except for breast cancer (Figure 3 and Tables S6 and S7).
3.2 Effect of combined unhealthy lifestyle
Table 2 presents the aHRs for the effect of combined unhealthy lifestyle on cancer in men and women. Higher unhealthy lifestyle scores resulted in a dose–response increased risk of cancer incidence, cancer-specific mortality, and all-cause mortality in both sexes. Similar results were found for cancer incidence and cancer-specific mortality for most cancer types, except for thyroid cancer in both sexes, prostate cancer in men, and breast cancer in women.
| Unhealthy score | HRsa (95% CI) among men | p-trendb | HRsa (95% CI) among women | p-trendb | ||||||||
|---|---|---|---|---|---|---|---|---|---|---|---|---|
| 0 | 1 | 2 | 3 | 4 (unhealthy) | 0 | 1 | 2 | ≥3 (unhealthy) | ||||
| Cancer incidence | Cancer incidence | |||||||||||
| All cancer | Ref. | 1.16 (1.15–1.18) | 1.32 (1.30–1.33) | 1.47 (1.45–1.49) | 1.61 (1.57–1.64) | <0.0001 | All cancer | Ref. | 0.99 (0.98–1.00) | 1.02 (1.01–1.03) | 1.09 (1.06–1.12) | <0.0001 |
| Lung cancer | Ref. | 1.68 (1.61–1.75) | 2.27 (2.19–2.36) | 2.68 (2.57–2.79) | 2.91 (2.73–3.11) | <0.0001 | Breast cancer | Ref. | 0.93 (0.91–0.95) | 0.91 (0.88–0.93) | 0.86 (0.80–0.93) | <0.0001 |
| Stomach cancer | Ref. | 1.22 (1.19–1.26) | 1.39 (1.36–1.43) | 1.54 (1.50–1.59) | 1.71 (1.63–1.80) | <0.0001 | Colorectal cancer | Ref. | 1.01 (0.98–1.05) | 1.09 (1.05–1.12) | 1.31 (1.20–1.42) | <0.0001 |
| Colorectal cancer | Ref. | 1.14 (1.11–1.18) | 1.28 (1.24–1.32) | 1.49 (1.44–1.54) | 1.66 (1.57–1.76) | <0.0001 | Stomach cancer | Ref. | 1.02 (0.99–1.06) | 1.04 (1.01–1.08) | 1.17 (1.07–1.28) | 0.0008 |
| Liver cancer | Ref. | 1.32 (1.27–1.38) | 1.58 (1.52–1.64) | 1.9 (1.82–1.98) | 2.29 (2.14–2.45) | <0.0001 | Lung cancer | Ref. | 0.96 (0.92–1.00) | 0.98 (0.94–1.03) | 1.77 (1.61–1.94) | <0.0001 |
| Oral cavity cancer | Ref. | 1.2 (1.10–1.31) | 1.44 (1.32–1.56) | 1.74 (1.58–1.91) | 2.13 (1.84–2.48) | <0.0001 | Liver cancer | Ref. | 1.09 (1.03–1.15) | 1.3 (1.22–1.38) | 1.64 (1.44–1.87) | <0.0001 |
| Esophagus cancer | Ref. | 1.52 (1.36–1.70) | 2.19 (1.97–2.44) | 3.45 (3.08–3.86) | 4.61 (3.94–5.38) | <0.0001 | Cervical cancer | Ref. | 1.01 (0.96–1.07) | 1.13 (1.06–1.21) | 1.52 (1.32–1.75) | <0.0001 |
| Larynx cancer | Ref. | 2.02 (1.73–2.36) | 2.76 (2.37–3.21) | 3.86 (3.29–4.52) | 4.41 (3.53–5.53) | <0.0001 | Thyroid cancer | Ref. | 0.94 (0.92–0.96) | 0.91 (0.89–0.93) | 0.67 (0.62–0.72) | <0.0001 |
| Thyroid cancer | Ref. | 0.97 (0.93–1.01) | 1 (0.96–1.04) | 1.01 (0.96–1.06) | 0.91 (0.82–1.01) | 0.4955 | ||||||
| Prostate cancer | Ref. | 0.9 (0.88–0.93) | 0.85 (0.83–0.88) | 0.84 (0.81–0.87) | 0.87 (0.80–0.94) | <0.0001 | ||||||
| Cancer mortality | Cancer mortality | |||||||||||
| All cancer death | Ref. | 1.3 (1.28–1.33) | 1.6 (1.58–1.63) | 1.87 (1.83–1.91) | 2.11 (2.04–2.19) | <0.0001 | All cancer death | Ref. | 1.06 (1.04–1.09) | 1.16 (1.14–1.19) | 1.66 (1.58–1.74) | <0.0001 |
| Lung cancer | Ref. | 1.78 (1.71–1.86) | 2.58 (2.48–2.69) | 3.1 (2.97–3.24) | 3.31 (3.09–3.54) | <0.0001 | Breast cancer | Ref. | 0.99 (0.91–1.07) | 1.05 (0.96–1.16) | 1.22 (0.96–1.55) | 0.1235 |
| Stomach cancer | Ref. | 1.23 (1.17–1.30) | 1.4 (1.33–1.48) | 1.54 (1.45–1.63) | 1.61 (1.45–1.78) | <0.0001 | Colorectal cancer | Ref. | 1.07 (1.00–1.14) | 1.2 (1.13–1.29) | 1.56 (1.35–1.80) | <0.0001 |
| Colorectal cancer | Ref. | 1.15 (1.09–1.22) | 1.28 (1.21–1.36) | 1.52 (1.42–1.62) | 1.8 (1.61–2.02) | <0.0001 | Stomach cancer | Ref. | 1.08 (1.01–1.15) | 1.07 (1.00–1.15) | 1.39 (1.19–1.62) | 0.0048 |
| Liver cancer | Ref. | 1.33 (1.27–1.40) | 1.61 (1.54–1.69) | 1.97 (1.88–2.07) | 2.55 (2.36–2.75) | <0.0001 | Lung cancer | Ref. | 1.03 (0.98–1.09) | 1.13 (1.07–1.19) | 2.52 (2.29–2.77) | <0.0001 |
| Oral cavity cancer | Ref. | 1.25 (1.06–1.46) | 1.66 (1.42–1.94) | 2.16 (1.83–2.56) | 2.55 (1.97–3.31) | <0.0001 | Liver cancer | Ref. | 1.16 (1.09–1.25) | 1.41 (1.31–1.51) | 2.01 (1.74–2.32) | <0.0001 |
| Esophageal cancer | Ref. | 1.48 (1.30–1.68) | 2.12 (1.86–2.40) | 3.24 (2.83–3.70) | 4.21 (3.48–5.10) | <0.0001 | Cervical cancer | Ref. | 1.04 (0.90–1.20) | 1.1 (0.94–1.30) | 2.17 (1.61–2.91) | 0.0022 |
| Laryngeal cancer | Ref. | 1.55 (1.15–2.09) | 2.63 (1.97–3.50) | 3.61 (2.66–4.89) | 4.69 (3.05–7.20) | <0.0001 | Thyroid cancer | Ref. | 1.03 (0.80–1.34) | 1.35 (1.03–1.77) | 0.91 (0.44–1.89) | 0.0299 |
| Thyroid cancer | Ref. | 1.34 (0.90–2.01) | 1.53 (1.03–2.28) | 1.54 (0.97–2.43) | 1.21 (0.47–3.13) | 0.076 | ||||||
| Prostate cancer | Ref. | 1.11 (1.01–1.21) | 1.21 (1.11–1.33) | 1.31 (1.17–1.45) | 1.32 (1.06–1.64) | <0.0001 | ||||||
| All-cause mortality | Ref. | 1.24 (1.22–1.25) | 1.45 (1.43–1.46) | 1.66 (1.64–1.68) | 1.81 (1.77–1.85) | <0.0001 | All-cause mortality | Ref. | 1.14 (1.13–1.15) | 1.23 (1.21–1.24) | 1.77 (1.73–1.81) | <0.0001 |
- a Hazard ratios adjusted for age, income, residential area, insurance subscriber types, CCI, and chronic viral hepatitis for liver cancer.
- b p for linear trend was calculated by modeling the combined score as a continuous variable.
3.3 Association of income with unhealthy lifestyle
The more deprived groups had higher odds of ever smoking, heavy alcohol consumption, physically inactive, and having extreme BMI. Lower income groups also had higher odds of having multiple unhealthy lifestyle factors than did the highest income group (Table S8).
3.4 Joint effect of income and unhealthy lifestyle on cancer
Figure 4 shows the joint effect of income and unhealthy lifestyle on cancer-specific mortality among men. For all-cancer death, a dose–response increase was observed for aHRs across all lifestyle categories and poverty levels when comparing to the combined healthiest and wealthiest reference group. The 95% CI of the aHR for each group did not overlap, indicating different risks of all-cancer death. The most deprived individuals with unhealthiest behaviors experienced the highest risk (aHR = 2.10 [2.05–2.14]). For cancer-specific mortality, the joint effect was most robust for head and neck cancer, with aHRs of 4.75 (3.50–6.45), 4.07 (3.58–4.63), and 2.79 (2.36–3.31) for laryngeal, esophageal, and oral cancer, respectively, followed by lung (aHR 2.83 [2.71–2.95]), liver (aHR 2.45 [2.32–2.58]), stomach (aHR 1.92 [1.81–2.05]), and colorectal cancers (aHR 1.85 [1.72–1.99]).
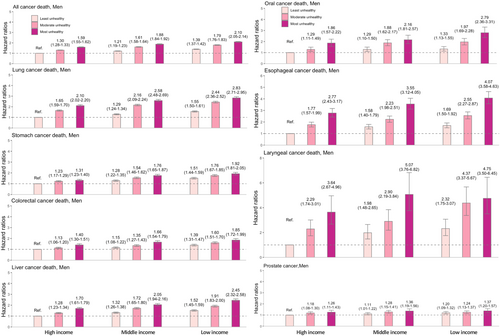
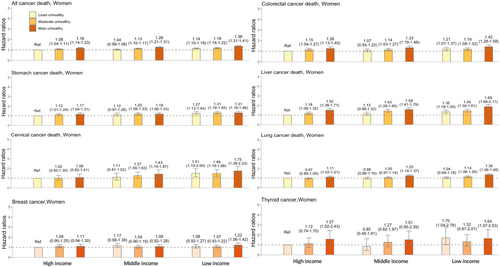
Figure 5 shows the joint effect on cancer-specific mortality in women, with the results not being as substantial as those in men. For all-cancer death, the risk among the unhealthiest and poorest women was 1.36-fold higher (aHR = 1.36 [1.31–1.41]). For cancer-specific mortality, the strongest effect was observed in liver (aHR 1.89 [1.69–2.11]) and cervical cancers (aHR 1.75 [1.38–2.23]).
We also observed the joint effect of income and unhealthy lifestyle on the incidence of lung, liver, oral cavity, esophageal, and laryngeal cancers in men and liver and cervical cancers in women (Figures S2 and S3). The joint association was stronger in men than in women.
For all-cause mortality, the lowest income and unhealthiest men had a 2.24-fold higher risk (aHR = 2.24 [2.22–2.27]), while women in these groups showed a 1.54-fold higher risk (aHR = 1.54 [1.52–1.58]) (Figure S4) than their corresponding reference groups.
4 DISCUSSION
We found that low income was associated with an elevated risk that followed a social gradient for all-cause mortality, all-cancer death, and death due to most cancers. Low income appeared to have a varied association with cancer incidence depending on cancer type in both sexes. Combined unhealthy lifestyles showed a dose–response increased risk of all-cause mortality, cancer incidence, and cancer-specific mortality for most cancers; in addition, lower income groups were more likely to engage in multiple unhealthy behaviors. Individuals with the lowest income and unhealthiest lifestyles were most vulnerable to all-cause mortality, cancer incidence, and mortality from several cancers, and this joint effect appeared to be stronger with cancer-specific mortality than with cancer incidence, and stronger in men than in women.
Overall, the effect of income on health outcomes is relatively consistent with the findings of previous studies.30, 33 The effect of income on incidence varied by cancer type: those highly related to modifiable risk factors, including smoking (lung cancer in men), heavy alcohol consumption (head and neck cancer), and infections (hepatitis virus for liver cancer and human papillomavirus [HPV] for cervical cancer) showed a significantly higher incidence among the poor. The unequal distribution of unhealthy lifestyle risk factors among income groups may contribute to social inequalities in these cancers.1 After adjusting for these modifiable risk factors, the results were attenuated but still consistent. In contrast, cancers that may involve over-screening and overdiagnosis, including thyroid and breast cancers in women and prostate cancer in men, showed a higher incidence among the rich,1 possibly due to better accessibility to screening. One study revealed that Korean women with higher household incomes had more frequent thyroid cancer screening42; another identified inequalities in breast cancer screening among Korean women from 2005 to 2015.43 A Swedish study also found that higher income men had a higher probability of detecting prostate cancer during routine check-ups.44 However, the lower income group showed a higher cancer-specific mortality rate for most cancers, which could result from poorer access to screening and appropriate treatment, leading to a higher proportion of late-stage cases.45, 46
We found that individuals with unhealthy lifestyles had poorer health outcomes, as in previous studies.27, 28 Multiple unhealthy behaviors (including smoking, alcohol drinking, physical inactivity, unhealthy diet, abnormal sleep duration, and television viewing time) were found to be strongly associated with CVDs and all-cause mortality28; in addition, healthy lifestyle (non-smoking, non-drinking, physical activity, maintaining a healthy diet, and a waist-to-hip ratio <0.90 for men and <0.85 for women) reduced liver cancer risk by 43% in the Chinese.27 However, one study found no significant association between multiple unhealthy behaviors and cancer-specific death among Koreans.47 This difference could be due to the shorter follow-up time (average: 6.01 years) in their study than in ours (average: 16.5 years).
For breast and thyroid cancers in women and prostate cancer in men, we found a lower risk of incidence among unhealthy individuals, possibly due to less participation in healthcare services such as cancer screening. It was found that people with multiple unhealthy behaviors were less likely to visit a general practitioner48; additionally, Chinese people who habitually smoked, drank alcohol, and were physically inactive had poor health-seeking behavior.49 In addition, it was suggested that obese Korean women are less likely to follow recommended screening schedules for breast and cervical cancers,50 and smoking was found to be associated with a lower rate of breast cancer screening among Korean women.51
We found that the poorest people with unhealthiest lifestyles were most vulnerable to all-cause death, cancer-related death, and several cancers. Here, the increase in all-cause mortality was 2.24-fold (2.22–2.27) among men and 1.54-fold (1.52–1.58) among women, which is smaller than in previous Western studies. In the United States, adults with low SES and the unhealthiest lifestyles had a 3.53-fold (3.01–4.14) higher risk of all-cause death than those with high SES and healthy lifestyles; in the United Kingdom, the increase was 2.65-fold (2.39–2.94).29 This might be due to differences in SES assessment, lifestyle factors, source population, and health policies.
We observed a stronger joint effect of SES and lifestyle factors on cancer-specific mortality than on cancer incidence. This could be because the discrepancy in cancer-specific mortality is driven not only by the inequality in cancer incidence and related causes but also by factors such as late diagnosis and poorer access to treatment among low-SES groups.5, 11, 46 Koreans of the lowest SES were more likely to be diagnosed at later stages for stomach, colorectal, and female breast cancer46; other studies have also shown higher odds for cervical (OR 1.46 [1.28–1.67])52 and breast cancer (OR 2.25 [1.97–2.58]).53 In addition, low SES is associated with poorer access to cancer care, healthcare delay, and lower-quality treatment,54, 55 with high-income patients using healthcare services more frequently and mostly at tertiary hospitals with better medical care compared to low-income patients.55
These findings imply that cancer-specific mortality could be a more meaningful endpoint than cancer incidence for investigating cancer disparities. Additionally, more comprehensive strategies are required to reduce inequalities in cancer care, such as by increasing the screening rate among low-income groups. Participants in cancer screening had higher age-standardized prevalence rates of early-stage cancer by income group than that of non-participants.56 In addition, improving cancer awareness and access to appropriate and quality treatment for marginalized populations could reduce inequalities in cancer care. The Financial Aid Program for Cancer Patients (FAPCP), a government initiative to provide financial aid to patients with cancer, was established in Korea in 2002. However, 87.6% of FAPCP recipients still reported significant financial burdens, and 10.2% changed or discontinued treatment because of medical expenses.57 Therefore, the FAPCP should broaden its benefits and support services, especially for the most vulnerable cancer patients, to help minimize these inequalities. In addition, policies should target the social determinants of health and promote lifestyle adjustment particularly among disadvantaged groups to improve population health and minimize social disparities.
This study has several limitations. First, our study lacked information on education level and occupation to assess overall SES. Second, our data lacked information on diet, a risk factor for several malignancies. We also lacked information on other risk factors, including secondary smoking, reproductive factors, Helicobacter pylori and HPV infection, genetic factors, and family history of specific cancers. Third, our unhealthy lifestyle score implies that each factor has equal risk for each outcome; Hence, further studies using weighted scores specific to each cancer outcome are needed. Fourth, we lacked information regarding cancer screening and stages to better comprehend social inequalities in cancer. Fifth, due to only including participants who received health examinations (i.e., 30% of the eligible population),58 this cohort study was unable to represent the entire Korean population. Finally, SES and lifestyle behaviors may have changed over time, affecting the results. Therefore, the effect of income trajectory on health could be a topic for future studies. Income can change over time during a person's life, and the effect on health might vary largely due to the increase or decrease trend of income. Several studies on income fluctuations suggested that long-term income might have a stronger relation to health than baseline income.59, 60
In conclusion, our study proved that income and combined healthy lifestyle behaviors (including smoking, heavy alcohol drinking, being physically inactive, and having an unhealthy BMI) were independently associated with a significantly increased risk of all-cause mortality, cancer mortality, and cancer incidence of several cancers. The effect on cancer-specific incidence and mortality varies by sex and cancer type. We also found that lower income groups have higher odds of having multiple unhealthy behaviors compared to the highest income group. In addition, the combined effect of income and unhealthy lifestyle results in an elevated risk of health outcomes, with individuals of the lowest income and the unhealthiest lifestyle experiencing the highest risk of all-cause mortality, cancer mortality, and cancer incidence of several cancer types. These results suggest that policies should both target social determinants of health and promote lifestyle adjustment among the population, particularly among disadvantaged groups, in order to improve population health and minimize social health disparities.
AUTHOR CONTRIBUTIONS
Chi Lan Tran: Conceptualization (equal); formal analysis (lead); investigation (equal); methodology (lead); writing – original draft (lead). Kui Son Choi: Writing – review and editing (equal). Sun young Kim: Writing – review and editing (equal). Jin-Kyoung Oh: Conceptualization (equal); investigation (equal); writing – review and editing (equal).
FUNDING INFORMATION
This work was supported by the National Cancer Center (grant number: NCC-2210862). The funder had no role in the study design, data collection, analysis, decision to publish, or preparation of the manuscript.
CONFLICT OF INTEREST STATEMENT
The authors declare no conflict of interest.
ETHICS STATEMENT
Using anonymous secondary data, this study was exempted from review by the Institutional Review Board of the National Cancer Center, Korea (NCC2022-0180).
CONSENT STATEMENT
Informed consent was waived for the same reason.
Open Research
DATA AVAILABILITY STATEMENT
The datasets generated and analyzed during the current study cannot be shared because NHIS prohibits the transfer, rental, or sale of the database to third parties except for researchers who have been approved for access. NHIS data are available upon request from the National Health Insurance Sharing Service, https://nhiss.nhis.or.kr/.


