Gene mutation analysis using next-generation sequencing and its clinical significance in patients with myeloid neoplasm: A multi-center study from China
Abstract
Background
Myeloid neoplasms (MN) tend to relapse and deteriorate. Exploring the genomic mutation landscape of MN using next-generation sequencing (NGS) is a great measure to clarify the mechanism of oncogenesis and progression of MN.
Methods
This multicenter retrospective study investigated 303 patients with MN using NGS from 2019 to 2021. The characteristics of the mutation landscape in the MN subgroups and the clinical value of gene variants were analyzed.
Results
At least one mutation was detected in 88.11% of the patients (267/303). TET2 was the most common mutation in the cohort, followed by GATA2, ASXL1, FLT3, DNMT3A, and TP53. Among patients with myeloid leukemia (ML), multivariate analysis showed that patients aged ≥60 years had lower overall survival (OS, p = 0.004). Further analysis showed TET2, NPM1, SRSF2, and IDH1 gene mutations, and epigenetic genes (p < 0.050) presented significantly higher frequency in older patients. In patients with myelodysplastic syndrome (MDS) and myelodysplastic neoplasms (MPN), univariate analysis showed that BCORL1 had a significant impact on OS (p = 0.040); however, in multivariate analysis, there were no factors significantly associated with OS. Differential analysis of genetic mutations showed FLT3, TP53, MUC16, SRSF2, and KDM5A mutated more frequently (p < 0.050) in secondary acute myeloid leukemia (s-AML) than in MDS and MPN. TP53, U2AF1, SRSF2, and KDM5A were mutated more frequently (p < 0.050) in s-AML than in primary AML. KDM5A was observed to be restricted to patients with s-AML in this study, and only co-occurred with MUC16 and TP53 (2/2, 100%). Another mutation was MUC16, and its co-occurrence pattern differed between s-AML and AML. MUC16 mutations co-occurred with KDM5A and TP53 in 66.7% (2/3) of patients with s-AML and co-occurred with CEBPA in 100% (4/4) of patients with AML.
Conclusions
Our results demonstrate different genomic mutation patterns in the MN subgroups and highlight the clinical value of genetic variants.
1 BACKGROUND
Myeloid neoplasms (MN) are clonal disorders of hematopoietic stem cells, including myeloid leukemia (ML), myelodysplastic syndrome (MDS), myelodysplastic neoplasms (MPN), and myelodysplastic syndrome/myeloid leukemia (MDS/MPN), which mainly include acute myeloid leukemia (AML) and chronic myeloid leukemia (CML).1 Despite being derived from homologous myeloid progenitors, this group of diseases represents a highly heterogeneous state in cytogenetic and molecular alterations and shares a tendency of progression to high malignancy of AML, which is known as secondary acute myeloid leukemia (s-AML), and is associated with poor prognosis and relapses.2
Detecting genetic alterations in MN is a routine practice for accurate diagnosis and targeted therapeutic approaches.2-4 Traditional testing methods, including Sanger sequencing, real-time polymerase chain reaction (PCR), reverse transcription (RT)-PCR, chromosome karyotype analysis, and fluorescence in situ hybridization (FISH),5 provide appropriate molecular results but require large amounts of nucleic acids to evaluate individual genes.6 With its considerable sensitivity and measurement capability, next-generation sequencing (NGS) has gradually become a validated tool for detecting genetic variants.7 Recent advances in NGS have revealed that SF3B1, ASXL1, and TP53 mutations are helpful in the diagnosis of MDS.8 TP53 and ASXL1 mutations are associated with poor prognosis and a high risk of s-AML transformation.9 FLT3, JAK2, and IDH mutations have been used in the choice of targeted drugs for AML.10 Moreover, NGS is a powerful tool that has been applied in micro residual disease testing of MN.8, 11, 12
Despite the varied knowledge of the molecular genetics of hematological neoplasms, the prognostic relevance and clinical value of genetics are not entirely consistent with heterogeneity and complexity. Thus, we undertook a multi-center research and applied NGS to explore the characteristics of the genomic mutation landscape in subgroups of MN and clarify the prognostic relevance and value of these gene variants.
2 MATERIALS AND METHODS
2.1 Patients and samples
This study was conducted by the Department of Hematology of the First Affiliated Hospital of Chongqing Medical University, in cooperation with other hematology centers in the southwest region of China. All patients were recently diagnosed with MN at the study centers between 2019 and 2021, including ML, MDS, MPN, and MDS/MPN. According to the WHO classification, the diagnosis and classification were based on multidisciplinary approaches; s-AML was defined as AML with antecedent hematological disease. Cytogenetic risk stratification was based on the revised 2017 European Leukemia Net risk stratification.13 Finally, 303 patients with MN were enrolled in the study, and patient characteristics and clinical outcomes were recorded, including age, sex, blood routine test results, chromosomal karyotypes, and treatments. All samples (peripheral blood or bone marrow) from patients underwent NGS analysis with informed consent. The study protocol was approved by the ethics committee of the study centers (2021-342).
2.2 Targeted sequencing and analysis
2.2.1 Panels selection
The gene panels used in this study were chosen based on prognostic and diagnostic significance and covered nine major functional categories that indicate the important genetic events in MN pathogenesis.14 In this study, we screened a 130-gene commercial panel of recurrent gene variants in hematologic malignancies with potential significance in MN, including DNA methylation-associated genes, transcription factors genes, spliceosome-complex genes, activated signaling genes, cohesin-complex genes, chromatin modifier genes, regulation of cell cycle, differentiation, and proliferation genes, tumor suppressor genes, and apoptosis genes (Table 1).
| Functional Cluster | Genes |
|---|---|
| DNA methylation-associated genes | DNMT3A, TET2, KDM5A, DOT1L, KMT2A, KMT2C, KMT2D |
| Transcription factors genes | RUNX1, CEBPA, EP300, CREBBP, IDH1, IDH2, IKZF1, MYC, ETV6, NCOR1, CUX1, GATA1, WT1, GATA2, RB1, MECOM, PML, NCOR2, CRLF2, IL7R, NFE2, PAX5, SRP72 |
| Spliceosome-complex genes | DKC1, SRSF2, SF3B1, U2AF1, ZRSR2, SF1, PRPF40B, SF3A1, PRPF8, U2AF2, ZFP36L1 |
| Activated signaling genes | FLT3, HRAS, NRAS, KRAS, CBL, KIT, NF1, PTPN11, ABL1, ROBO1, MPL, PDGFRA, ROBO2, STAT3, SETBP1, JAK1, MYD88, CSF3R, JAK2, JAK3, FBXW7, CALR, NOTCH1, NOTCH2, CCND1, GNAS, PTEN, TYK2, SMARCA2, ZAP70 |
| Cohesin-complex genes | RAD21, SMC1A, SMC3, STAG1, STAG2, MUC16, CTCF |
| Chromatin modifier genes | ASXL1, ASXL2, EZH2, BCOR, PHF6, ARID1A, ARID1B, BCORL1, KDM6A, ATRX |
| Cell cycle, differentiation, and proliferation regulation genes | ATG2B, CDKN2A, COL12A1, FAT1, GFI1, RARA, BRAF, SH2B3/LNK, PTPRT, DDX11, NPM1, NT5C2, PPM1D, SUZ12, TERT, SMN1 |
| Tumor suppressor genes | ATM, BLM, TP53, BRCA1, BRCA2 |
| Apoptosis genes | HAX1, TERC |
| Others | AKNRD26, PBRM1, EPPK1, PIGA, CROCC, TTN, CSMD1, WAC, DDX41, CCND2, DIS3, ZMYM3, BRINP3, CELA2A, GSKIP, SBDS, ZNF608, ETNK1 |
2.2.2 DNA extraction and identification
Bone marrow or peripheral blood (2 mL) were collected in an EDTA tube, and centrifugal separation was performed with erythrocyte lysates to obtain mononuclear cells. This was followed by DNA extraction using the Blood Genomic DNA extraction kit (0.1–1 mL; Beijing Tian Yuan Biotech Co., Ltd.). DNA concentration of the samples was quantified using a Qubit fluorometer (Thermo Fisher Scientific).
2.2.3 Library preparation and analysis
Library preparation was performed by amplification and capture using the NGS gene panel detection library construction kit (Shanghai yuanqi Bio-pharmaceutical Technology Co., Ltd.) and PE150 sequencing on Nextseq 550 Sequencing System (Illumina). The primary data were aligned to the human reference genome at NCBI, Clinvar, dbSNP (V138), COSMIC, and Human Genome database (HG19) with the determination of point mutations (SNV), insertions and deletions (INDEL), and pathogenic mutations.
2.3 Statistical analyses
The endpoint was defined as the date of death or the last follow-up date, and overall survival (OS) was measured from the time of initial diagnosis to the endpoint. All statistical procedures were performed using the software packages SPSS (version 26.0; IBM Corporation) and GraphPad Prism (Datamatics 8.0). A non-parametric test (Mann–Whitney U test) was used to compare the frequency of mutation among different diseases, and the COX proportional hazards regression model was used to identify the prognostic value of genetic variants. χ2 test and Fisher's exact test were used for categorical variables. p-values <0.05 were considered statistically significant.
3 RESULTS
3.1 Patient cohort and clinical characteristics
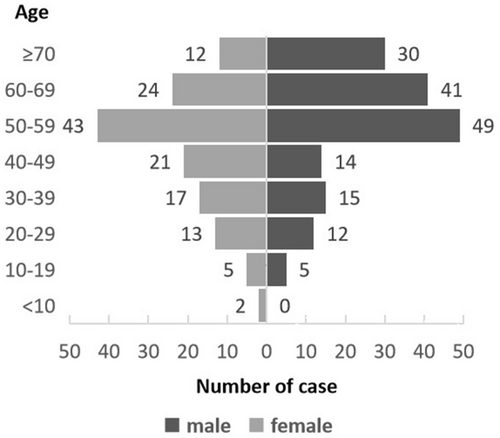
A total of 303 patients with MN were retrospectively enrolled in the study, and their clinical characteristics are summarized in Table 2. The cohort included 173 patients with ML, 118 with MDS, two with MPN, and 10 with MDS/MPN. Within ML, 165 patients were diagnosed with AML (23 patients were defined as having s-AML with antecedent hematological disorders of MDS or MPN, and 142 patients were defined as having de novo AML). Another eight patients had other types of ML (four patients with MAL, two with BAL, and two with CML). The median age of the patients was 55 years (range 6–86 years), with 54.78% (166/303) males and 45.22% (137/303) females. The highest proportion of patients aged 50–59 years was 30.36% (92/303), and this proportion gradually decreased in the two age groups. (Figure 1).
| Clinical variables | MN median (range; count%) | ML | MDS | MPN and MDS/MPN |
|---|---|---|---|---|
| Total number (number) | 303 | 173 | 118 | 12 |
| Sex (female/male) | 137/166 | 83/90 | 51/67 | 3/9 |
| Median age (years old) | 55 (6–86) | 54 (9–86) | 56.50 (6–86) | 59.50 (50–75) |
| Median WBC count (×109/L) | 3.46 (0.69–682.70) | 9.34 (0.69–682.7) | 2.29 (0.70–32.82) | 19.32 (3.16–253.43) |
| Median hemoglobin (g/L) | 77 (17–165) | 78 (28–147) | 74 (16.40–165) | 71.50 (48–106) |
| Median platelets (×109/L) | 45 (2–4384) | 43 (2–4384) | 46.50 (3–405) | 121.50 (22–598) |
| Myeloid neoplasm subtype | ||||
| AML | 165 | |||
| s-AML | 23 | |||
| de novo AML | 142 | |||
| MAL | 4 | |||
| BAL | 2 | |||
| CML | 2 | |||
| MDS | 118 | |||
| MDS-MLD | 34 | |||
| MDS-SLD | 5 | |||
| MDS-RS-MLD | 6 | |||
| MDS-5q- | 3 | |||
| MDS-EB1 | 34 | |||
| MDS-EB2 | 22 | |||
| MDS-U | 14 | |||
| MPN | 2 | |||
| CMML | 2 | |||
| MPN/MDS | 8 | |||
| Chromosomal karyotypes | ||||
| Good | 56 | 28 | 27 | 1 |
| Intermediate | 180 | 95 | 75 | 10 |
| Poor | 67 | 50 | 16 | 1 |
| Number of mutation | ||||
| 0 | 36 | 14 | 21 | 1 |
| 1 | 49 | 29 | 19 | 1 |
| 2 | 50 | 30 | 19 | 1 |
| ≥3 | 167 | 100 | 59 | 8 |
| Treatments | ||||
| Chemotherapy and demethylation therapy | 180 | 136 | 38 | 6 |
| HSCT | 25 | 20 | 5 | 0 |
| Supportive treatment | 98 | 17 | 75 | 6 |
| Median follow-up term (months) | 3 (0–197) | 3 (0–197) | 2.5 (0.1–80) | 1.75 (0.2–81) |
- Abbreviations: AML, acute myeloid leukemia; BAL, Biphenotype cellular leukemia; CML, Chronic myeloid leukemia; CMML, chronic myelomonocytic leukemia; HSCT, hematopoietic stem cell transplantation; MAL, Mixed cellular leukemia; MDS, myelodysplastic syndrome; MDS-5q-, myelodysplastic syndrome with isolated del(5q); MDS-EB1, myelodysplastic syndrome with excess blasts one; MDS-EB2, myelodysplastic syndrome with excess blasts two; MDS-MLD, myelodysplastic syndrome with single lineage dysplasia; MDS-RS-MLD, myelodysplastic syndrome with sideroblasts and multilineage dysplasia; MDS-SLD, myelodysplastic syndrome with multilineage dysplasia; MDS-U, myelodysplastic syndrome unclassifiable; MN, myeloid neoplasm; MPN, myeloproliferative neoplasm; WBC, white cell count.
According to chromosomal karyotype classification,15 18.48% (56/303), 59.41% (180/303), and 22.11% (67/303) of the patients were classified into the good prognosis group, intermediate group, and poor prognosis group, respectively (Table 2). All patients underwent NGS analysis; 296 test samples were bone marrow samples and seven samples were peripheral blood samples. At least one mutated gene was identified in 88.11% (267/303) of the patients, and complex variations (more than three gene mutations) were detected in 62.54% (167/303).
The treatments included symptomatic support therapy, chemotherapy, demethylation therapy, and stem cell transplantation (autologous hematopoietic stem cell transplantation (HSCT) and allogeneic HSCT). Approximately 59.41% (180/303) of the patients received chemotherapy and demethylation therapy, 8.25% (25/303) received stem cell transplantation, and 32.34% (98/303) received supportive therapy with blood transfusion and anti-infection treatment. All patients completed the follow-up plans with a median follow-up time of 3 months (Table 2).
3.2 Gene mutation landscape in the MN subgroups
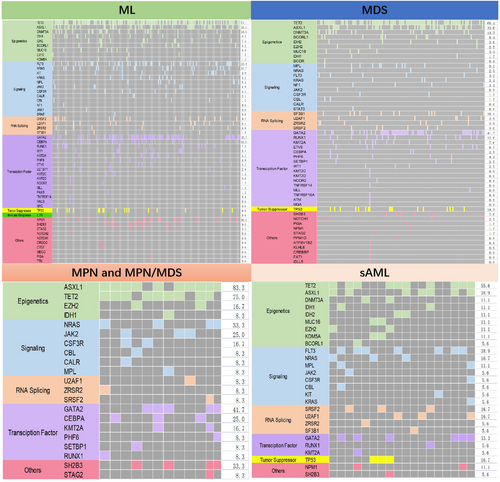
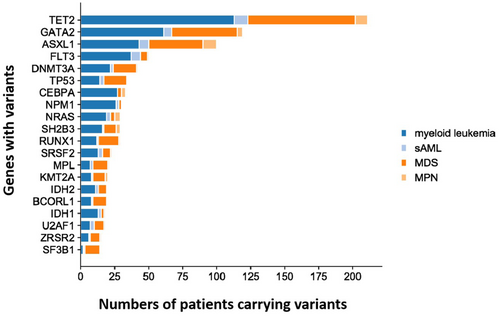
The distribution of mutations in the subgroups is depicted in the mutation landscape (Figure 2). As expected, the three common variants in the ML cohort were TET2 (71.1%), GATA2 (38.7%), and ASXL1 (28.9%); in MDS, TET2 (66.4%), GATA2 (41.2%), and ASXL1 (33.6%); and in MPN and MPN/MDS, ASXL1 (83.3%), TET2 (75%), NRAS (33.3%), and SH2B3 (33.3%). The most common variants in patients with s-AML were TET2 (55.6%), FLT3 (38.9%), ASXL1 (38.9%), and GATA2 (33.3%). The top 20 common gene variants were TET2, GATA2, ASXL1, FLT3, DNMT3A, TP53, CEBPA, NPM1, NRAS, SH2B3, RUNX1, SR2B3, RUNX1, SRSF2, MPL, KMT2A, IDH2, BCORL1, IDH1, U2AF1, ZRSR2, and SF3B1, while other genes exhibited variation at extremely low frequency. The mutation status in the different subgroups is shown as bar graphs (Figure 3).
3.2.1 Mutational co-occurrence and mutual exclusion patterns
Co-occurrence and mutual exclusion of high-frequency variants in the subgroups were analyzed. In patients with ML, significant co-occurrence was detected between TET2 mutations and GATA2, FLT3, ASXL1, NPM1, and CEBPA mutations. GATA2 with FLT3, NPM1, and CEBPA mutations regularly occurred. Regarding the mutual exclusion of gene variants, the data from TP53 was a standout; we could not identify co-occurrence with NPM1, FLT3, or CEBPA mutations and low frequency with other gene variants (Figure 4A).
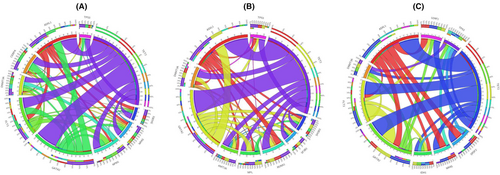
In MDS, MPN, and MDS/MPN, TET2 significantly co-occurred with GATA2 and ASXL1 variants. GATA2 and ASXL1 also co-occurred. In the mutual exclusion pattern, TP53 had low frequency compared with other gene variants and had no co-occurrence with SH2B3, SF2B1, and MPL (Figure 4B).
In s-AML, the co-occurrence of TET2 with GATA2 and ASXL1 mutations was significant, and GATA2 and ASXL1 also co-occurred. In contrast, mutual exclusivity was observed between TP53 and FLT3, FLT3 and ASXL1, ASXL1 and DNMT3, and FLT3 and SRSF2 (Figure 4C).
3.3 Prognostic analysis
The mean OS of patients with ML was 9.36 ± 1.42 months, while the OS of MDS and MPN patients was 9.06 ± 1.42 months, with no significant difference (p = 0.617). The relevance between prognosis, clinical characteristics, and gene variants was evaluated. In univariate analysis, the prognostic factors with p < 0.200 were considered essential and were enrolled in multivariate analysis. Patients with ML, s-AML, MDS, and MPN (including MDS/MPN) were analyzed.
3.3.1 Prognostic analysis of ML
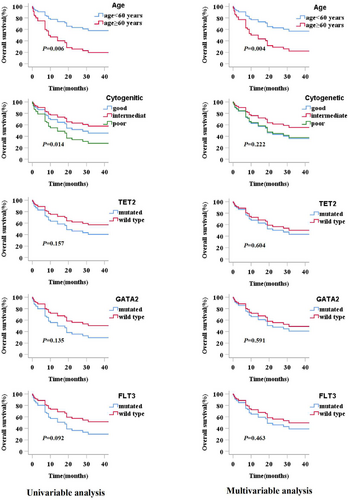
Age, WBC count, chromosomal karyotypes, stem cell transplantation, and gene variants were included for survival analysis. Univariate analysis showed older patients (age ≥ 60 years) and complex karyotypes had significant negative impacts on the OS of patients with ML (p = 0.006). TET2, GATA2, and FLT3 mutations were considered as other essential factors (p < 0.200) and were included in the multivariate analysis. In the multivariate analysis, only age (≥60 years) was observed to have a significant unfavorable impact on OS (p = 0.004), and older patients with ML demonstrated lower OS (Table 3). Survival curves for all factors included in the multivariate analysis are shown in Figure 5.
| Variables | OS(ML) | |||
|---|---|---|---|---|
| Univariate analysis HR(CI 95%) | p value | Multivariate analysis HR(CI 95%) | p value | |
| Age ≥ 60 years | 2.519 (1.302–4.873) | 0.006* | 0.375 (0.192–0.734) | 0.004* |
| WBC≥100 × 109/L | 1.805 (0.545–5.979) | 0.334 | ||
| Chromosomal karyotypes | ||||
| Good versus poor | 0.618 (0.224–1.701) | 0.343 | 1.046 (0.342–3.199) | 0.937 |
| moderate versus poor | 0.430 (0.218–0.847) | 0.014* | 0.609 (0.274–1.350) | 0.222 |
| Stem cell transplants(yes versus no) | 0.837 (0.324–2.165) | 0.714 | ||
| Gene mutation(yes versus no) | 1.472 (0.348–6.228) | 0.599 | ||
| TET2 mutated versus wt | 1.612 (0.832–3.122) | 0.157 | 1.215 (0.582–2.535) | 0.604 |
| GATA2 mutated versus wt | 1.784 (0.836–3.811) | 0.135 | 1.256 (0.547–2.885) | 0.591 |
| ASXL1 mutated versus wt | 1.469 (0.767–2.815) | 0.246 | ||
| FLT3 mutated versus wt | 1.819 (0.908–3.646) | 0.092 | 1.343 (0.611–2.955) | 0.463 |
| CEBPA mutated versus wt | 0.785 (0.306–2.014) | 0.614 | ||
| NPM1 mutated versus wt | 1.182 (0.460–3.033) | 0.729 | ||
| NRAS mutated versus wt | 0.870 (0.308–2.455) | 0.793 | ||
| DNMT3A mutated versus wt | 0.885 (0.313–2.502) | 0.817 | ||
| SH2B3 mutated versus wt | 0.667 (0.087–5.140) | 0.698 | ||
| TP53 mutated versus wt | 1.575 (0.554–4.482) | 0.394 | ||
- Note: COX proportional hazard regression analysis was used for evaluations of each variables.
- Abbreviations: ML, myeloid leukemia; OS, overall survival; WBC, white blood cell; Wt, wide-type.
- * Statistical difference (p < 0.05) was observed.
To further explore the inferior prognosis in older patients with ML, genetic mutation events between the younger and older patient groups were compared. High-frequency mutated genes and functional classifications were also included. TET2 (55.77% vs. 38.84%, p = 0.040), NPM1 (26.92% vs. 10.74% p = 0.007), SRSF2 (19.23% vs. 3.31% p = 0.000), IDH1 (19.23% vs. 2.48% p = 0.000), and epigenetic genes (82.69% vs. 66.12%, p = 0.000) presented significantly higher frequency in older (≥60 years) patients (Table 4).
| Genes events | Status | Patients of age < 60 years (n) | Patients of age ≥ 60 years (n) | χ 2 | p value |
|---|---|---|---|---|---|
| TET2 | Mutation | 47 | 29 | ||
| Wide-type | 74 | 23 | 4.23 | 0.040* | |
| GATA2 | Mutation | 30 | 13 | ||
| Wide-type | 91 | 39 | 0.001 | 0.977 | |
| ASXL1 | Mutation | 24 | 17 | ||
| Wide-type | 97 | 35 | 3.325 | 0.068 | |
| FLT3 | Mutation | 28 | 15 | ||
| Wide-type | 93 | 37 | 0.634 | 0.426 | |
| CEBPA | Mutation | 21 | 7 | ||
| Wide-type | 100 | 45 | 0.407 | 0.524 | |
| NPM1 | Mutation | 13 | 14 | ||
| Wide-type | 108 | 38 | 7.228 | 0.007* | |
| NRAS | Mutation | 15 | 6 | ||
| Wide-type | 106 | 46 | 0.025 | 0.874 | |
| DNMT3A | Mutation | 14 | 9 | ||
| Wide-type | 107 | 43 | 1.039 | 0.308 | |
| SH2B3 | Mutation | 6 | 1 | ||
| Wide-type | 115 | 51 | 0.863 | 0.353 | |
| TP53 | Mutation | 11 | 6 | ||
| Wide-type | 110 | 46 | 0.246 | 0.620 | |
| SRSF2 | Mutation | 4 | 10 | ||
| Wide-type | 117 | 42 | 12.401 | 0.000* | |
| IDH1 | Mutation | 3 | 10 | ||
| Wide-type | 118 | 42 | 14.685 | 0.000* | |
| Epigenetic genes | Mutation | 80 | 43 | ||
| Wide-type | 41 | 9 | 4.864 | 0.027* | |
| Transcription factors genes | Mutation | 62 | 19 | ||
| Wide-type | 59 | 33 | 3.157 | 0.076 | |
| Activated signaling genes | Mutation | 56 | 26 | ||
| Wide-type | 65 | 26 | 0.202 | 0.653 |
- * Statistical difference (p < 0.05) was observed.
3.3.2 Prognostic analysis of MDS, MPN, and MDS/MPN
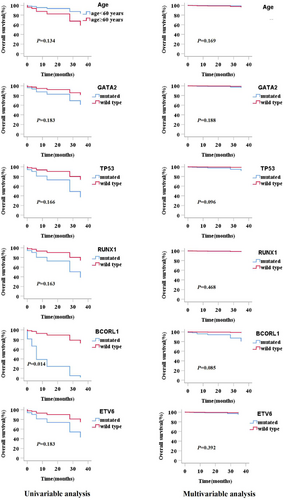
Clinical prognostic factors included age, WBC count, chromosomal karyotypes, treatments, gene variants, and single mutated genes. In univariate analysis, patients with BCORL1 mutations showed a significantly reduced OS (p = 0.040); however, other factors showed no significant impact on survival. According to the p value in the univariate analysis, age and GATA2, TP53, RUNX1, and ETV6 mutations were considered in the multivariate analysis (Table 5). In multivariate analysis, all factors showed p ≥ 0.050, which indicated that clinical features and gene variants were not effective prognostic factors of MDS and MPN in the study. The survival curves for all factors included in the multivariate analysis are shown in Figure 6.
| Variables | OS(MDS and MPN) | |||
|---|---|---|---|---|
| Univariate analysis HR (CI 95%) | p value | Multivariate analysis HR (CI 95%) | p value | |
| Age ≥ 60 years | 0.355 (0.092–1.376) | 0.134 | 0.366 (0.088–1.532) | 0.169 |
| WBC≥100 × 109/L | 22.843 (0–4.670E+23) | 0.671 | ||
| Chromosomal karyotypes | ||||
| Good versus poor | 0 (0–3.151 E+230) | 0.962 | ||
| Moderate versus poor | 5.810 (0.119–2.840) | 0.501 | ||
| Demethylation therapy versus supportive treatment | 2.115 (0.435–10.294) | 0.353 | ||
| Gene mutation(yes versus no) | 0.914 (0.113–7.367) | 0.933 | ||
| TET2 mutated and wt | 1.052 (0.292–3.782) | 0.939 | ||
| GATA2 mutated and wt | 2.394 (0.663–8.649) | 0.183 | 2.437 (0.646–9.188) | 0.188 |
| ASXL1 mutated and wt | 0.630 (0.133–2.983) | 0.561 | ||
| DNMT3A mutated and wt | 1.843 (0.384–8.842) | 0.443 | ||
| TP53 mutated and wt | 3.199 (0.617–16.585) | 0.166 | 4.491 (0.766–26.342) | 0.096 |
| RUNX1 mutated and wt | 3.103 (0.634–15.195) | 0.163 | 2.023 (0.302–13.559) | 0.468 |
| SF3B1 mutated and wt | 0.044 (0–1509.585) | 0.558 | ||
| MPL mutated and wt | 0.929 (0.115–7.498) | 0.945 | ||
| SH2B3 mutated and wt | 1.485 (0.314–7.032) | 0.618 | ||
| BCORL1 mutated and wt | 12.400 (1.124–136.750) | 0.040* | 12.317 (0.862–186.072) | 0.085 |
| KMT2A mutated and wt | 0.046 (0–3.187E+06) | 0.730 | ||
| ETV6 | 2.886 (0.606–13.743) | 0.183 | 2.674 (0.282–25.399) | 0.392 |
- Note: COX proportional hazard regression analysis was used for evaluations of each variables.
- Abbreviations: MDS, myelodysplastic syndrome; MPN, myeloproliferative neoplasm; OS, overall survival; WBC, white blood cell.
- * Statistical difference (p < 0.05) was observed.
3.3.3 Prognostic analysis of s-AML
Patients with s-AML were the smallest subgroup. Additionally, we performed further analysis for potential prognostic factors, especially for the high frequency of gene variants. However, in the univariate analysis, survival was not significantly different based on factors such as age, WBC count, and gene variants (Table 6).
| Variables | OS(s-AML) | |
|---|---|---|
| Univariate analysis HR(CI 95%) | p value | |
| Age ≥ 60 years | 0.775 (0.242–2.481) | 0.667 |
| WBC≥10 × 109/L | 0.696 (0.223–2.178) | 0.534 |
| TET2 mutated and wt | 0.703 (0.210–2.353) | 0.568 |
| GATA2 mutated and wt | 2.059 (0.395–10.729) | 0.391 |
| ASXL1 mutated and wt | 0.799 (0.237–2.688) | 0.716 |
| FLT3 mutated and wt | 1.490 (0.428–5.189) | 0.531 |
| NRAS mutated and wt | 2.353 (0.471–11.762) | 0.297 |
| SRSF2 mutated and wt | 1.827 (0.530–6.292) | 0.340 |
| U2AF1 mutated and wt | 0.118 (0.014--0.996) | 0.050 |
| TP53 mutated and wt | 0.232 (0.036–2.234) | 0.232 |
- Abbreviations: OS, overall survival. WBC, white blood cell.
3.4 Differential analysis of gene variants among MN subgroups
3.4.1 Comparison of mutational burden between the subgroups
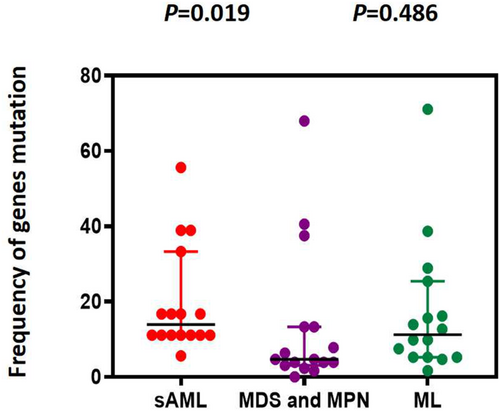
We selected and integrated the top 10 most common gene variants between ML, MDS, and MPN to evaluate the gene mutational burden; however, there was no significant difference (p = 0.486). In contrast, the mutational burden in s-AML was higher than that in the MDS and MPN subgroups (p = 0.019; Figure 7).
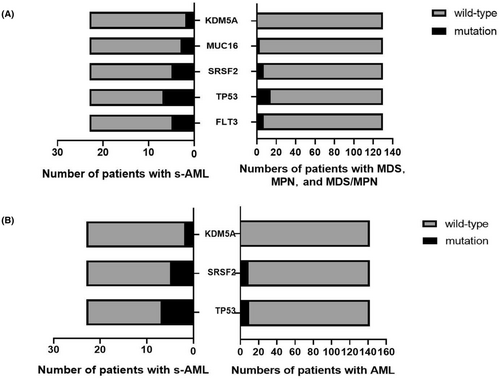
To further understand the diversity of gene variants, we integrated high-frequency gene variants into two subgroups for comparison. Thirteen variants were selected among s-AML, MDS, and MPN. FLT3 (p = 0.019), TP53 (p = 0.020), MUC16 (p = 0.044), SRSF2 (p = 0.007), and KDM5A (p = 0.022) mutations were significantly more frequent in s-AML (Table 7, Figure 8A). Simultaneously, 18 gene variants were screened and integrated between s-AML and de novo AML; TP53 (p = 0.003), U2AF1 (p = 0.049), SRSF2 (p = 0.029), and KDM5A (p = 0.019) mutations displayed higher frequencies in s-AML (Table 8, Figure 8B).
| Genes | Status | Patients with MDS and MPN (n) | Patients with s-AML (n) | χ 2 | p value |
|---|---|---|---|---|---|
| TET2 | Wild-type | 73 | 9 | ||
| Mutation | 57 | 14 | 2.277 | 0.131 | |
| GATA2 | Wild-type | 72 | 19 | ||
| Mutation | 38 | 4 | 1.375 | 0.241 | |
| ASXL1 | Wild-type | 91 | 16 | ||
| Mutation | 39 | 7 | 0.002 | 0.967 | |
| FLT3 | Wild-type | 123 | 18 | ||
| Mutation | 7 | 5 | 5.146 | 0.023* | |
| NRAS | Wild-type | 123 | 19 | ||
| Mutation | 7 | 5 | 2.614 | 0.106 | |
| TP53 | Wild-type | 116 | 16 | ||
| Mutation | 14 | 7 | 4.830 | 0.028* | |
| SRSF2 | Wild-type | 123 | 18 | ||
| Mutation | 7 | 5 | 5.146 | 0.023* | |
| U2AF1 | Wild-type | 123 | 19 | ||
| Mutation | 7 | 4 | 2.614 | 0.106 | |
| NPM1 | Wild-type | 128 | 22 | ||
| Mutation | 2 | 1 | 0.389 | ||
| MUC16 | Wild-type | 127 | 20 | ||
| Mutation | 3 | 3 | 0.044* | ||
| IDH2 | Wild-type | 124 | 22 | ||
| Mutation | 6 | 1 | 0.000 | 1.000 | |
| EZH2 | Wild-type | 126 | 21 | ||
| Mutation | 4 | 2 | 0.222 | ||
| KDM5A | Wild-type | 130 | 21 | ||
| Mutation | 0 | 2 | 0.022* |
- * Statistical difference (p < 0.05) was observed.
| Genes | Status | Number of patients in AML (n) | Patients in s-AML (n) | χ 2 | p value |
|---|---|---|---|---|---|
| TET2 | Wild-type | 81 | 9 | ||
| Mutation | 61 | 14 | 2.561 | 0.110 | |
| GATA2 | Wild-type | 104 | 19 | ||
| Mutation | 38 | 4 | 0.916 | 0.339 | |
| ASXL1 | Wild-type | 109 | 16 | ||
| Mutation | 33 | 7 | 0.558 | 0.455 | |
| FLT3 | Wild-type | 107 | 18 | ||
| Mutation | 35 | 5 | 0.002 | 0.968 | |
| TP53 | Wild-type | 132 | 16 | ||
| Mutation | 10 | 7 | 9.326 | 0.002* | |
| U2AF1 | Wild-type | 135 | 19 | ||
| Mutation | 7 | 4 | 3.140 | 0.076 | |
| SRSF2 | Wild-type | 133 | 18 | ||
| Mutation | 9 | 5 | 4.226 | 0.040* | |
| NRAS | Wild-type | 126 | 19 | ||
| Mutation | 16 | 4 | 0.241 | 0.624 | |
| DNMT3A | Wild-type | 124 | 19 | ||
| Mutation | 18 | 3 | 0.000 | 1.000 | |
| IDH2 | Wild-type | 130 | 22 | ||
| Mutation | 12 | 1 | 0.068 | 0.795 | |
| EZH2 | Wild-type | 141 | 21 | ||
| Mutation | 1 | 2 | 0.051 | ||
| MUC16 | Wild-type | 138 | 20 | ||
| Mutation | 4 | 3 | 0.057 | ||
| NPM1 | Wild-type | 116 | 22 | ||
| Mutation | 26 | 1 | 1.891 | 0.169 | |
| IDH1 | Wild-type | 129 | 23 | ||
| Mutation | 13 | 0 | 1.198 | 0.274 | |
| KDM5A | Wild-type | 142 | 21 | ||
| Mutation | 0 | 2 | 0.019* | ||
| BCORL1 | Wild-type | 134 | 23 | ||
| Mutation | 8 | 0 | 0.414 | 0.520 | |
| SH2B3 | Wild-type | 135 | 23 | ||
| Mutation | 7 | 0 | 0.595 | ||
| CEBPA | Wild-type | 115 | 22 | ||
| Mutation | 27 | 1 | 2.071 | 0.150 |
- * Statistical difference (p < 0.05) was observed.
3.5 Two special differential genes in s-AML
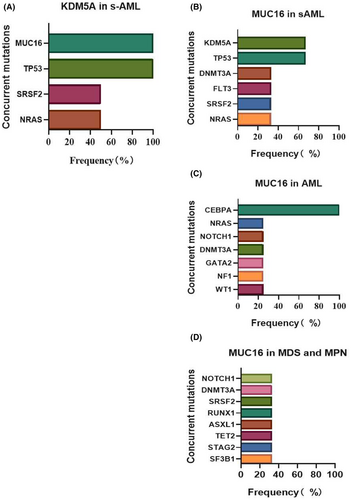
KDM5A and MUC16 mutations were present at low frequencies in MN, but with a higher frequency in s-AML compared to other subgroups. KDM5A mutation was only identified in two patients with s-AML (8.69%, 2/23), and always co-occurred with MUC16 and TP53 mutations (100% 2/2), and co-occurred with SRSF2 and NRAS in 50% (1/2) patients (Figure 9A). MUC16 mutations occurred in three patients with s-AML (13.04%, 3/23), along with KDM5A and TP53 mutations (66.7% 2/3). Other concurrent mutations included DNMT3A, FLT3, SRSF2, and NRAS (Figure 9B). However, MUC16 mutations were found in four de novo AML patients (2.81%, 4/142), and co-occurred with CEBPA in all of the patients. Other concurrent mutations included NRAS, NOTCH1, DNMT3A, GATA2, NF1, and WT1 (Figure 9C). In MDS and MPN, MUC16 mutations occurred in three patients (2.31%, 3/130), but there were no particularly prominent concurrent mutations (Figure 9D).
4 DISCUSSION
Genetic alterations are critical in MN pathogenesis and many gene variants have been identified to guide diagnosis, prognosis, and precise treatment. Our results revealed that 88.11% of patients with MN had at least one pathogenic gene mutation detected by NGS; the sensitivity was consistent with that of a previous study.16 TET2 gene mutation was the most common in MN, followed by GATA2, ASXL1, FLT3, DNMT3A, and TP53. The gene mutation structure was differed slightly from a recent study; the study demonstrated ASXL1, SRSF2, and TET2 mutations were more common.17 NPM1, DNMT3A, FLT3, and NRAS had a high mutation frequency in AML.6, 18 In this study, epigenetic abnormalities were the most prominent in ML, where TET2, ASXL1, GATA2, and FLT3 had the highest mutation frequency (≥20%), followed by NPM1, NRAS, and DNMT3A (10%–20%); the results were slightly different from those of previous studies; however, these genes are common in AML.
We found that older patients with ML had shorter survival time in the final Cox regression model. Further analysis showed a higher incidence of genetic mutation events in the older patient group, which could explain the lower OS. Previous epidemiological surveys on AML also found that older patients had poorer OS than younger patients,19-21 gene mutations of myeloid transcription factor were prominent in younger patients, and epigenetic mutations were prominent in older patients.22, 23 In addition, another study confirmed RUNX1, TP53, IDH 2, and SF3B1 gene mutations and epigenetic genes were more frequent in older patients.24 TET2 is considered an age-associated mutation that contributes to myeloid expansion.25
In addition, the intermediate group had superior OS compared to the good and poor karyotype groups, which demonstrated the diversity and complexity of the prognostic factors in ML. This may be related to the different treatment methods used in different karyotype groups. Patients in the intermediate group received more allogeneic HSCT than those in the good group, which improved the overall survival; in the good group, autologous HSCT or constant chemotherapy was recognized as an appropriate treatment. This indicates that allogeneic HSCT is an effective method to improve the OS of patients with ML. Unfortunately, genetic mutations have no significant prognostic significance compared to the wild type in ML. However, some studies have demonstrated different results; ASXL1, RUNX1, TP53, and FLT3-ITD mutations are associated with poor prognosis,21 and DNMT3A, IDH1, and IDH2 mutations have not been clearly defined as prognostic factors.9 TET2 and GATA2 are commonly mutated genes in MN; however, the value of TET2 was not accordant. In AML studies, patients with TET2 mutations may be more sensitive to cytotoxic therapy; however, TET2 is not an independent prognostic marker.26
Regarding the gene mutation landscape of MDS, a recent study reported that TET2, SF3B1, ASXL1, SRSF2, and RUNX1 were highly mutated in MDS patients,27 which is consistent with our study. In MPN and MDS/MPN, ASXL1 mutations appeared with the highest frequency, whereas JAK2, CARL, and MPL mutations were present at low frequencies, similar to previous studies.28 Another study investigating 426 MDS patients showed that CBL, IDH2, ASXL1, DNMT3A, and TP53 were associated with shorter OS and poor prognosis.29 SRSF2 and RUNX1 mutations were associated with reduced survival in MDS30; however, the SF3B1 mutation was a predictor of favorable prognosis in MDS and MDS/MPN.31, 32 TET2 and GATA2 mutations are controversial in MDS.33 Clinical features seemed to have no impact on prognosis in patients with MDS, MPN, and MDS/MPN. However, patients with the BCORL1 mutation had a significantly reduced OS (p = 0.04); BCORL1 (BCL6 corepressor-like1) gene is a transcriptional corepressor that helps inhibit E-cadherin.34 BCORL1 mutation is a low-frequency mutation associated with a poor prognosis in MDS and an incidence of AML transformation as reported previously.35, 36
FLT3, TP53, SRSF2, MUC16, and KDM5A mutations were more frequent in s-AML than in MDS and MPN. Furthermore,TP53, U2AF1, SRSF2, and KDM5A mutations were significantly more frequent in s-AML than in ML. These differential gene variants may be mutations that promote disease progression. According to previous reports, NGS detection revealed that TP53, SRSF2, and TET2 mutations were poor prognostic factors; especially SRSF2 mutations, which could accelerate the transformation of MPN to AML.37 Moreover, in an MDS study, the results indicated that NRAS, KRAS, PTPN11, and FLT3 mutations promote the transformation of MDS, while NPM1, WT1, and IDH2 mutations were common in MDS-transformed s-AML.38 TP53, RUNX1, ETV6, EZH2, and ASXL1 are high-risk genes that promote the transformation of MDS. ASXL1, EZH2, and SRSF2 mutations were associated with poor prognosis in primary myelofibrosis (PMF), and the patients could easily transform to s-AML.39 U2AF1 is a recurrent somatic mutation in the splicing factor, and at a low frequency in AML and MDS, U2AF1 can activate immune pathways and affect myeloid malignancies.40, 41 Most studies have shown that patients with U2AF1 mutations were associated with poor survival in MDS and AML, but this was still controversial.39, 42-44
KDM5A is a low-frequency gene and was observed in two patients with s-AML. It is a pathogenic gene and a marker for efficacy response in a variety of tumors.45 A study of acute promyelocytic leukemia (APL) indicated that KDM5A contributes to the blockage of cell differentiation.46 Similarly, a recent study suggested that KDM5A is associated with cell apoptosis in AML cell lines and may be a potential target for demethylation therapy in AML.47 However, the clinical value of s-AML has rarely been reported. MUC16 (also known as CA-125) plays an important role in tumorigenesis, proliferation, migration, and invasion and is an important target for the diagnosis and treatment of gynecological tumors.48, 49 Both in vitro and in vivo studies have proven that this marker may be a potential approach for treating hard-to-cure AML.49 It was interesting to find concurrent mutations KDM5A and MUC16 in s-AML; however, all MUC16 mutations co-occurred with CEBPA in AML. The prominent concurrent mutation differences between diseases may be related to different pathogeneses, and future studies are needed to confirm this hypothesis. The limitation of this study is the limited number of cases in the s-AML and MPN subgroups; therefore, it is challenging to fully clarify the role of gene variants in the pathogenesis and prognosis of MN.
In summary, this study provides a detailed analysis of gene profiles in MN subgroups and highlights the prognostic relevance and value of these genetic variants. These results provide evidence for further research on the function of genes in the clonal evolution of MN. Future studies are needed to dynamically monitor the changes in gene mutations at different disease stages using NGS and confirm the hypothesis that differentially expressed genes may be involved in the development of s-AML.
AUTHOR CONTRIBUTIONS
Junnan Li: Data curation (equal); formal analysis (lead); investigation (equal); methodology (lead); software (lead); validation (equal); visualization (equal); writing – original draft (lead). Li Pei: Project administration (equal); resources (equal); writing – review and editing (equal). Simin Liang: Conceptualization (equal); data curation (equal); investigation (equal); software (equal). Shuangnian Xu: Project administration (equal); resources (equal). Yi Wang: Project administration (equal); resources (equal). Xiao Wang: Project administration (equal); resources (equal). Yi Liao: Project administration (equal); resources (equal). Qian Zhan: Data curation (equal); resources (equal). Wei Cheng: Resources (equal). Zesong Yang: Resources (equal). Xiaoqiong Tang: Resources (equal). Hongbin Zhang: Resources (equal). Qing Xiao: Project administration (equal). Jianbin Chen: Project administration (equal); supervision (equal). Lin Liu: Project administration (equal); supervision (equal). Li Wang: Conceptualization (lead); data curation (equal); formal analysis (equal); funding acquisition (lead); investigation (equal); methodology (equal); project administration (lead); resources (equal); supervision (lead); visualization (equal); writing – review and editing (lead).
FUNDING INFORMATION
This work was supported by the Natural Science Foundation Project of Chongqing (cstc2018jcyjAX0688, Supported by Natural Science), the Science and Health joint project of Chongqing (2018ZDXM001), and the Education Commission Foundation of Chongqing (KJ1702017), Key Projects of Science and Technology Commission in Yuzhong District of Chongqing(20190121).
CONFLICT OF INTEREST STATEMENT
The authors declare that they have no conflict of interest.
ETHICS STATEMENT
This study was approved according to the ethical guidelines of the First Affiliated Hospital of Chongqing Medical University (2021-342) and was performed according to the Declaration of Helsinki. Written informed consent was obtained from the patients.
Open Research
DATA AVAILABILITY STATEMENT
The datasets generated and analyzed during the current study are publicly available from the corresponding author upon reasonable request.


