Prognostic nomogram in patients with epithelioid sarcoma: A SEER-based study
Di Zhang, Jintao Hu, and Zhuojie Liu have contributed equally to the work and are joint first authors.
Abstract
Objective
The prognostic factors for patients with epithelial sarcoma remain unclear. The study aims to develop a practical clinical nomogram that predicts prognosis in patients with ES using the Surveillance, Epidemiology, and End Results (SEER) database.
Methods
We extracted clinical data from 2004 to 2015 from the SEER database about patients with ES. All patients were randomly divided into training cohort and validation cohort. Kaplan–Meier analyses were used to compare outcomes between different subgroups. In order to estimate the chance of survival for patients with ES, we developed a nomogram. Nomogram performance was evaluated by discrimination and calibration. Additionally, an analysis of decision curves was conducted to evaluate the clinical usefulness of this newly developed model.
Results
In the primary cohort,320 met the inclusion criteria to be entered into this study. The median OS was 66.000 months (range 34.704 to 94.296 months), and the 1-, 3-, and 5-year OS rates were 70.7%, 56.1%, and 50.4%, respectively. For the validation cohort, we studied 136 consecutive patients. Age, primary site, grade, AJCC (American Joint Committee on Cancer) T, AJCC M, and surgery were included in the nomogram. The C-index values for the training set and validation set were 0.817 and 0.832, respectively. The calibration plots showed good agreement between the prediction and the observation. Based on the clinical decision curve, the model has a good clinical net benefit for ES patients.
Conclusions
It is the first study that developed an effective survival prediction model for patients with ES. Using this nomogram can assist in clinical decision-making as it has satisfactory accuracy. Even so, additional external validation is needed.
1 INTRODUCTION
Epithelioid sarcoma (ES) is a rare subtype of soft tissue sarcoma with highly malignant first described by Enzinger in 1970.1, 2 It is thought that the occurrence of ES is correlated with the loss of expression of the SMARCB1/INI1 protein.3, 4 It was found to account for less than 1% of all soft tissue sarcomas.5 Despite its slow growth, the tumor is prone to recurrence postoperatively and lymphatic system metastasis. Epithelioid sarcoma has an unfavorable prognosis in general. According to previous reports, the 5-year overall survival rate ranged from 32 to 92%.5-14 ES typically occurs in young males, predominantly in the distal part of the upper extremity. Surgical resection is the main treatment for ES in many cases. Study have been conducted to investigate the efficacy of surgery, out of 23 patients diagnosed with ES, 16 had a significantly better prognosis after radical surgery than the 7 who underwent conservative treatment.5 Recent studies have shown that Tazemetostat is effective in treating epithelioid sarcoma, whereas chemotherapy and radiotherapy have limited effect on sarcoma. Although there are studies exploring the prognostic factors of the disease, there is no prognostic model that can be applied to clinical work to provide a quantitative assessment of patient prognosis.
2 METHODS
2.1 Data source
The SEER database contains millions of patient records, which encompass a period ranging from 1973 to 2018. These records represent over 30% of the total U.S. population. All cases were obtained from 18 local cancer registries. We attempt to find the independent risk factors affecting prognosis and develop a nomogram to predict the survival of patients with ES based on clinicopathological data. We used the SEER database to identify all cases of ES diagnosed between 2004 and 2015 based on ICD-O-3.15 Inclusion criteria were as follows: (1) Patients diagnosed with epithelioid sarcoma in the SEER database and (2) the years of diagnosis ranged from 2004 to 2015. Exclusion criteria were as follows: (1) Patients with a history of other cancer; (2) no evidence of primary tumor; and (3) patients with unknown information of primary site, chemotherapy, survival months, or other important demographic, clinical, pathologic, and treatment variables. Patients with ES who met the criteria were randomly assigned to training cohorts and validation cohorts. We collected the following information: age, race, gender, tumor location, tumor size, T stage, N stage, M stage, survival time, and survival status. The racial categories included black, white, and others. We classified the primary site as superficial appendicular locations, deep appendicular locations, superficial axial locations, and deep axial locations. In terms of laterality, three categories can be distinguished: right-origin of primary, left-origin of primary, and others. Grade is divided into the following categories: G1-G2, G3-G4, and unknown. Furthermore, In the T stage, there were T1, T2, and TX. According to the 6th edition of the AJCC staging system, the T0 stage means no evidence of primary tumor, and these patients were excluded from this study. N0, N1, and Nx constitute the N stage. No metastasis is indicated by M0, positive metastasis by M1, and unknown by MX. One-, three-, and five-year overall survival (OS) rates were the study endpoints.
2.2 Statistical analysis
A patient's survival time is defined as the period between the time of diagnosis until the last follow-up or death. Statistical significance is defined as p < 0.05 in two-sided analyses. Survival curves are calculated using Kaplan–Meier method. Based on the log-rank test, we evaluated the survival differences between the subgroups. To identify prognostic variables, the Cox regression model with hazard ratios (HRs) and 95% confidence intervals (CIs) was used in the training cohort. A multivariate analysis using forward stepwise regression was conducted using variables selected in univariate regression with a p-value < 0.05. We chose T, N, and M variables instead of stage variables to avoid multicollinearity in the multivariate analysis. Identification and calibration measurements were used to verify the nomogram model. We calculated the C-index, which quantifies the difference between observations and predictions, and shows the predictive power of the model. ROC curves (Receiver operating characteristic curve) and calibration curves are plotted to verify the discrimination and calibration of the model. The calibration plot of the model displays the calibration between the predicted and actual rates of survival. Additionally, decision curve analysis (DCA) was performed to evaluate the clinical effectiveness and benefit of the prediction model. We used IBM SPSS Statistics 23 and R software (version 4.0.3) for our statistical analyses.
3 RESULT
3.1 Patient baseline characteristics
From 2004 to 2015, SEER recorded 622 patients with ES. Our analysis involved 456 patients (320 in the development group and 136 in the validation group; Table 1) who met the research criteria. Table 1 shows the baseline characteristics of the study population. There was complete information on the survival times and causes of death of all patients. In the training group, the 1-year, 3-year, and 5-year overall survival rates were 70.7%, 56.1%, and 50.4%. The mean age was 44.73. A large majority of patients are white, around 77.7%. The proportion of females is smaller than that of males. More than half of patients (60.9%) with sarcoma have metastases distant from the primary tumor. A total of 237 cases (70.4%) were surgically treated.
| Variable | Primary cohort (n = 320) | Validation cohort (n = 136) | p-value | |||
|---|---|---|---|---|---|---|
| No. of patients | % | No. of patients | % | |||
| Age, yearsa | 0.310 | |||||
| Mean | 44.730 | 42.570 | ||||
| SD | 20.300 | 21.930 | ||||
| Sexb | 0.020 | |||||
| Male | 184 | 57.500 | 62 | 45.590 | ||
| Female | 136 | 42.500 | 74 | 54.410 | ||
| Raceb | 0.315 | |||||
| White | 251 | 77.680 | 106 | 77.940 | ||
| Black | 37 | 12.840 | 21 | 15.440 | ||
| Other | 32 | 9.480 | 9 | 6.620 | ||
| Lateralityb | 0.465 | |||||
| Right—origin of primary | 118 | 36.880 | 42 | 30.880 | ||
| Left—origin of primary | 84 | 26.250 | 40 | 29.410 | ||
| Other | 118 | 36.880 | 54 | 39.710 | ||
| Primary sitec | 0.209 | |||||
| Superficial axial | 96 | 30.000 | 28 | 20.590 | ||
| Deep axial | 60 | 18.750 | 28 | 20.590 | ||
| Superficial appendicular | 158 | 49.380 | 77 | 56.620 | ||
| Deep appendicular | 6 | 1.880 | 3 | 2.210 | ||
| Gradeb | 0.247 | |||||
| Grades I-II | 24 | 7.500 | 7 | 5.150 | ||
| Grades III-IV | 132 | 41.250 | 67 | 49.260 | ||
| Unknown | 164 | 51.250 | 62 | 45.590 | ||
| AJCC Tb | 0.932 | |||||
| T1 | 100 | 31.250 | 44 | 32.350 | ||
| T2 | 159 | 49.690 | 68 | 50.000 | ||
| Unknown | 61 | 19.060 | 24 | 17.650 | ||
| AJCC Nb | 0.881 | |||||
| N0 | 196 | 61.250 | 82 | 60.290 | ||
| N1 | 37 | 11.560 | 18 | 13.240 | ||
| Unknown | 87 | 27.190 | 36 | 26.470 | ||
| AJCC Mb | 0.810 | |||||
| M0 | 195 | 60.940 | 82 | 60.290 | ||
| M1 | 55 | 17.190 | 21 | 15.440 | ||
| Unknown | 70 | 21.880 | 33 | 24.260 | ||
| Surgeryb | 0.588 | |||||
| Yes | 237 | 74.060 | 104 | 76.470 | ||
| No | 83 | 25.940 | 32 | 23.530 | ||
| Radiationb | 0.904 | |||||
| Yes | 129 | 40.310 | 54 | 39.710 | ||
| No | 191 | 59.690 | 82 | 60.290 | ||
| Chemotherapyb | 0.900 | |||||
| Yes | 96 | 30.000 | 40 | 29.410 | ||
| No | 224 | 70.000 | 96 | 70.590 | ||
| Survival monthsa | 0.350 | |||||
| Mean | 54.480 | |||||
| SD | 52.110 | |||||
| Vital statusb | 0.923 | |||||
| Alive | 149 | 46.560 | 64 | 47.060 | ||
| Death | 171 | 53.440 | 72 | 52.940 | ||
- Abbreviation: AJCC, American Joint Committee on Cancer.
- a Independent samples t-test.
- b Chi-square test.
- c Fisher's precision probability test.
3.2 Univariate and multivariate cox regression analysis
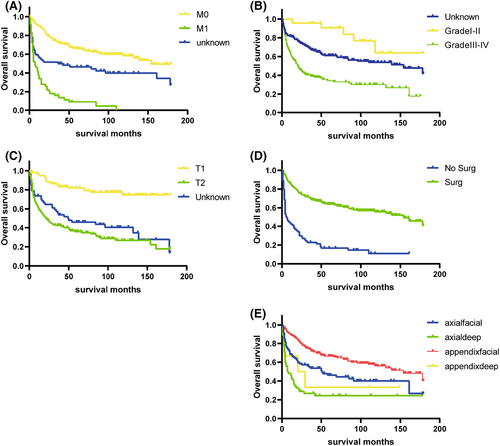
Results of univariate and multivariate Cox regression for OS were stated in Table 2. Kaplan–Meier survival curves were plotted for the five categorical variables of primary site, grade, AJCC T, AJCC M, and surgery. The differences in the ES survival time distributions were examined using the log-rank method. (Figure 5) The differences in the overall survival time distributions between groups for these variables were statistically significant (p < 0.05).The variables in the univariate Cox regression that were statistically significant (p < 0.05) were incorporated into the multivariate analysis. In the multivariate analysis of OS, variables including age, primary site, grade, AJCC T, AJCC M, and surgery were all statistically significant. According to multivariate analysis, the outcomes were improved in patients with younger age, superficial Primary site, well-differentiated stage, lower T and M stage, surgery.
| Variable | Univariate analysis | Multivariate analysis | ||||
|---|---|---|---|---|---|---|
| HR | 95% CI | p-value | HR | 95% CI | p-value | |
| Age | 1.032 | 1.024–1.041 | <0.001 | 1.022 | 1.014–1.031 | <0.001 |
| Sex | 0.310 | |||||
| Male | 1(ref) | |||||
| Female | 0.854 | 0.628–1.160 | 0.311 | |||
| Primary site | <0.001 | 0.004 | ||||
| Superficial axial | 1(ref) | 1(ref) | ||||
| Deep axial | 2.208 | 1.486–3.279 | <0.001 | 1.637 | 1.045–2.564 | 0.031 |
| Superficial appendicular | 0.562 | 0.392–0.805 | 0.002 | 0.742 | 0.513–1.074 | 0.113 |
| Deep appendicular | 1.194 | 0.432–3.299 | 0.733 | 1.670 | 0.587–4.754 | 0.336 |
| Race | 0.560 | |||||
| White | 1(ref) | |||||
| Black | 1.176 | 0.748–1.848 | 0.483 | |||
| Other | 1.248 | 0.771 –2.021 | 0.367 | |||
| Grade | <0.001 | <0.001 | ||||
| Unknown | 1(ref) | 1(ref) | ||||
| Grades I-II | 0.445 | 0.194–1.023 | 0.057 | 0.486 | 0.206–1.148 | 0.100 |
| Grades III-IV | 2.039 | 1.495–2.781 | <0.001 | 1.841 | 1.313–2.581 | <0.001 |
| Laterality | <0.001 | |||||
| Right—origin of primary | 1(ref) | |||||
| Left—origin of primary | 0.506 | 0.325–0.786 | 0.002 | |||
| Other | 1.596 | 1.146–2.223 | 0.006 | |||
| AJCC T | <0.001 | 0.003 | ||||
| T1 | 1(ref) | 1(ref) | ||||
| T2 | 5.157 | 3.253–8.173 | <0.001 | 2.325 | 1.385–3.905 | 0.002 |
| Unknown | 4.034 | 2.391–6.807 | <0.001 | 2.162 | 1.224–3.817 | 0.009 |
| AJCC N | <0.001 | |||||
| N0 | 1(ref) | |||||
| N1 | 1.843 | 1.171–2.901 | 0.008 | |||
| Unknown | 2.137 | 1.536–2.974 | <0.001 | |||
| AJCC M | <0.001 | <0.001 | ||||
| M0 | 1(ref) | 1(ref) | ||||
| M1 | 5.996 | 4.149–8.666 | <0.001 | 2.668 | 1.759–4.046 | <0.001 |
| Unknown | 2.311 | 1.592–3.356 | <0.001 | 1.345 | 0.862–2.101 | 0.192 |
| Surgery | <0.001 | <0.001 | ||||
| No | 1(ref) | 1(ref) | ||||
| Yes | 0.224 | 0.164–0.305 | <0.001 | 0.399 | 0.276–0.575 | <0.001 |
| Radiation | 0.598 | |||||
| No | 1(ref) | |||||
| Yes | 1.081 | 0.797 –1.465 | 0.616 | |||
| Chemotherapy | <0.001 | |||||
| No | 1(ref) | <0.001 | ||||
| Yes | 2.549 | 1.877–3.461 | <0.001 | |||
- Abbreviation: AJCC, American Joint Committee on Cancer.
3.3 Construction and validation of prognostic nomogram
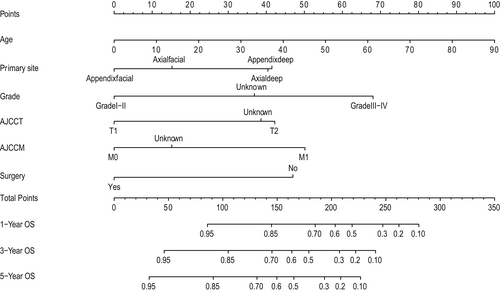
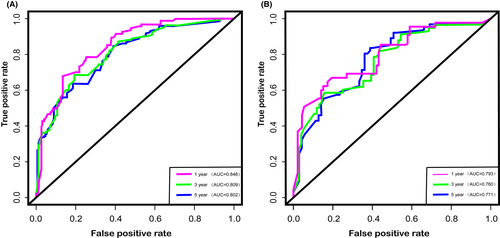
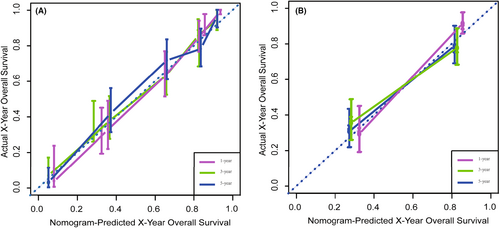
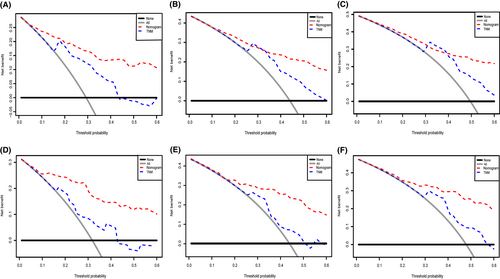
We depict the model incorporating six independent factors that affect overall survival. (Figure 1) The C-index of this model was 0.82, which represents an ideal correspondence between the predictions and the observed outcomes for survival at 1, 3, and 5 years. ROC plots were generated using the “survivalROC” package for the training and validation group at different times, with the death rate expressed as a continuous variable. AUC was calculated for each plot. (Figure 2) In the training set, the prognostic model accurately predicted 1-, 3-, and 5-year mortality with AUCs of 0.846, 0.809, and 0.802, respectively. In the validation set, AUC values at 1, 3, and 5 years were 0.793, 0.760, and 0.771, respectively. The result shows this model is highly accurate. Figure 3 showed the calibration plots of the nomogram. The DCA results indicate the model provides good net benefits to ES patients. (Figure 4).
4 DISCUSSION
According to our knowledge, no existing epithelioid sarcoma prognosis prediction nomogram has been developed and validated before this study. Nomograms rely on easy-to-use digital interfaces, better accuracy, and more clear prognoses to help doctors make better decisions. Currently, nomograms are widely used in clinical work as prognostic devices. The prognostic predictors for the nomogram were age, primary tumor site, grade, surgery, T stage, and M stage. (Figure 1).
In terms of the ability to predict the prognosis of patients, we compared our prediction model with the TNM staging system. In training and validation cohorts, the C-index was 0.818 and 0.832 for predicting OS, while the C-index for TNM stage was 0.744 and 0.724. In terms of predicting the 1-year, 3-year, and 5-year OS, the areas under the curves of our model are 0.846, 0.809, and 0.802, respectively, while the areas under the curves of TNM stages are 0.838, 0.777, and 0.784, respectively. From the results of the above, we can easily find that our model based on more clinical information has a better predictive effect than the TNM staging system.
Using the SEER database, we created a prognostic model to determine the prognosis of ES patients based on large-sample data. A total of 456 patients were enrolled in this study. This study supports previous research that elderly patients have a poorer prognosis.16 It may be due to the fact that elderly patients tend to have multiple comorbid conditions, such as coronary artery disease and hypertension, which are associated with a worse prognosis. Additionally, primary tumor site was identified as an independent factor for prognosis (p < 0.05). According to a previous study by Livi et al.17 patients with tumor sites distal to the body have a better prognosis. This study revealed that tumors deepen into the fascia have a worse prognosis, which is in line with previous studies.13 Previous studies have suggested that deep tumor localization is an independent risk factor for local recurrence-free survival.7 It is possible to hypothesize that ES with deep-seated location may be difficult to diagnose because these patients do not have obvious symptoms.9 Conversely, Ross et al18 reported that the primary tumor site had no impact on patient survival. There has previously been debate about grading for ES.19, 20 In our study, the grade was significant in both univariate and multivariate regression analyses and was an independent risk factor. However, there were far fewer patients in the validation and training cohort at the lower grade than at the higher grade. Results, therefore, need to be interpreted with caution. The majority of cases with reported values were high grade. Thus, it may help explain why ES has such a poor prognosis. T stage and M stage are independent risk factors for OS. Studies on the topic indicate that tumors larger than 5 cm tend to have worse outcomes.2, 21 Tumors that measure more than 5 cm should receive adjuvant radiation.18 The study by Spillane et al13 reported that there was a significant improvement in distant metastasis-free survival in smaller ES (<5 cm) but the size was not a significant predictor of overall survival. Some scholars also propose that the multifocality of ES lesions prevents precise measurements of tumor size.7 Prognosis is usually less favorable for patients with distant metastases of ES at the time of diagnosis.5, 13, 22 A high number of distant metastases have been observed in patients with ES, which range from 40% to 57%,5, 7, 13, 18 and these metastases may be resistant to intensive treatment. Our analyses indicated that patients with localized and regional ES fared better than those with distant metastases. Although ES has a high rate of metastatic spread to regional lymph nodes, ranging from 10% to 65% in the literature,5, 10, 18, 22-24 N stage did not contribute significantly to OS in our study. Previous studies have mentioned that nodal metastasis resection is not very effective in extending the survival time.25 The current studies support the point of previous research that surgical interventions had a positive impact on patient outcomes.5, 14 In the past, surgical treatment including amputation has always been the mainstay of ES patients. Recently, researchers have found that Tazemetostat has the potential to improve outcomes in patients with advanced ES in a prospective clinical trial of 62 patients.26 Tazemetostat has been approved by the FDA for treating epithelioid sarcoma. Targeted treatment for epithelioid sarcoma, this drug is the first of its kind.27 With the development of targeted drugs, ES patients will have access to more treatment options.
Our research shows that the model efficiently predicts the survival of patients with ES, thereby improving the accuracy of clinical decision-making. There are some limitations to our study that should be noted. Firstly, stages were organized based on the 6th AJCC staging system, which could limit its effectiveness. Secondly, our nomogram was constructed based on the SEER database, where partial patient information is necessarily lost. As a result, there may be fewer qualified cases, which may increase the selection bias. Lastly, the study is a retrospective cohort study. In the current situation, given that ES is a very rare soft tissue sarcoma, the most reliable way to study the prognosis of this disease is using public database. Yet, the prognostic nomogram we constructed needs to be validated by further prospective cohort studies.
5 CONCLUSION
It is the first study that developed an effective survival prediction model for patients with ES. Using this nomogram can assist clinical decision-making as it has satisfactory accuracy. Even so, additional external validation is needed.
AUTHOR CONTRIBUTION
Study design: DZ, JH, and ZL. Methodological development: DZ and JH. Data acquisition and statistical analysis: DZ, JH, ZL, HW, and HC. Study Research guidance and supervision: CL. All authors contributed to the article and approved the submitted version, and wrote the manuscript.
FUNDING INFORMATION
This work was supported by the Science and Technology Program of Guangzhou(202102010259).
CONFLICT OF INTEREST
The authors declare that they have no conflicts of interest related to this paper.
ETHICS STATEMENT
No personal identifying information was used in the study. Hence, we did not require Institutional Review Board approval or patient informed consent.
AUTHORSHIP CLARIFIED
All authors agreed with the content, all gave explicit consent to submit, and we obtained consent from the responsible authorities at the institution where the work has been carried out, before the work is submitted.
Open Research
DATA AVAILABILITY STATEMENT
All data were downloaded from the SEER (https://seer.cancer.gov/). Data from this study are available to any interested researchers upon reasonable request to the corresponding author.


