Identification of the key genes associated with chemotherapy sensitivity in ovarian cancer patients
Hui Zheng and Meiqin Zhang contributed equally to this article.
Funding information
This study was supported by National Natural Science Foundation of China, grant number 81572552, 81772774, 81772808, 81800190 and Shanghai Science and Technology Commission, grant number 19ZR1410300.
Abstract
Background
Ovarian cancer (OC) is the deadliest gynecological cancer. The absence of biomarkers in early detection and chemotherapy resistance is a principal cause of treatment failure in OC.
Methods
In this study, next generation sequencing (NGS) was used to sequence the mRNA of 44 OC patients including 14 chemotherapy insensitive and 18 sensitive patients. Differentially expressed genes (DEGs) from OC patients (compared with healthy controls) and chemotherapy sensitive patients (compared with chemotherapy insensitive patients) were identified by edgeR v3.12.0 in R v3.2.2, which were enriched using Gene Ontology (GO) database and Kyoto Encyclopedia of Genes and Genomes pathway (KEGG). The common DEGs in cancer occurring and chemotherapy sensitivity were further screened. Among them, genes participating in chemotherapy sensitivity associated pathways were regarded as chemotherapy sensitivity-related key genes. Quantitative real-time PCR (qPCR) and immunohistochemistry (IHC) were used to verify the expression of the key genes.
Results
We found 1588 DEGs between OC patients and healthy controls (HCs), which were mainly enriched in cell cycle pathway. Meanwhile, 249 DEGs were identified between chemotherapy sensitive and insensitive OC patients, which were mainly enriched in MAPK signaling pathway, ERBB signaling pathway, TNF signaling pathway, and IL-17 signaling pathway. Thirty-five DEGs were shared in chemotherapy sensitivity group and cancer occurring group. Among them, there are five genes (JUND, JUNB, MUC5B, NRG1, and NR4A1) participating in the above four chemotherapy sensitivity-related pathways. It is remarkable that JUND is in the upstream of MUC5B in IL-17 signaling pathway and their expressions were verified by qPCR and IHC.
Conclusions
The expression levels of the key genes related to chemotherapy sensitivity might be used as biomarkers to predict the treatment outcome and as a target to improve prognosis.
1 INTRODUCTION
Ovarian cancer (OC) is one of the most fatal tumors in women. The main treatment methods are surgery and chemotherapy with paclitaxel and platinum.1 However, about 25% of OC patients will be resistant to chemotherapy drugs within 6 months,2 even worse, most OC patients eventually develop severe drug resistance after long-term treatment, resulting in high recurrence rate and poor prognosis.3 Therefore, it is urgent to uncover the molecular mechanism of chemotherapy resistance in OC.
Chemotherapy resistance in OC is mainly through reducing drug accumulation, increasing cellular detoxification, stimulating DNA repair, altering intrinsic apoptosis pathways, and regulating autophagy.4-8 These biological processes involve in multiple genes and multiple pathways. Gene mutation site,9-12 mRNA expression level,13-15 transcription factor,16 miRNA,17-19 long non-coding RNA,20, 21 epigenetic regulation22, 23 were widely studied to predict the chemotherapy response in OC. However, until now, there is no representative biomarker to predict the chemotherapy efficacy of OC in the clinic due to the complex mechanism of chemotherapy resistance coupled with the genetic heterogeneity of ovarian cancer patients. Thus, the key genes associate with chemotherapy sensitivity still need to be explored.
Here, we used next generation sequencing (NGS) combining bioinformatics technology to identify more chemotherapy sensitivity-related key genes, which can be as targets to increase chemotherapy sensitivity.
2 MATERIALS AND METHODS
2.1 Clinical samples
Tissue samples from ovarian cancer patients without drug treatment were collected at Fudan University Shanghai Cancer Center from December 25, 2012 to August 31, 2017. Samples were stored at −80℃ until RNA isolation. The patients who recurred within 6 months after chemotherapy were regarded as chemotherapy insensitivity. Instead, the patients who did not recur over 6 months were regarded as chemotherapy sensitivity. A total of 44 patients (range, 30-79 years old) were recruited including 14 chemotherapy insensitive and 18 sensitive patients. The pathological stage was defined according to UICC/AJCC and TNM classification system (https://www.uicc.org/resources/tnm), details were shown in Table 1. The research was authorized by the Ethics Committee of Fudan University Shanghai Cancer Center and informed consent was obtained from all patients.
| Patient | Age (y) | UICC staging | PFS (mo) | Chemotherapy sensitivity |
|---|---|---|---|---|
| 1 | 57 | IIIC | No records | Insensitive |
| 2 | 57 | IIIC | 36 | Sensitive |
| 3 | 59 | IIIC | 43 | Sensitive |
| 4 | 50 | IIIC | 4 | Insensitive |
| 5 | 57 | IIIC | 29 | Sensitive |
| 6 | 65 | IIIC | 61 | Sensitive |
| 7 | 55 | IIIC | 8 | Insensitive |
| 8 | 67 | IV | 3 | Insensitive |
| 9 | 58 | IC | 64 | Sensitive |
| 10 | 51 | IV | 17 | Insensitive |
| 11 | 72 | IIIC | 54 | Sensitive |
| 12 | 39 | IIIC | 27 | Sensitive |
| 13 | 57 | IIIC | 1 | Indeterminacy |
| 14 | 58 | None | 14 | Sensitive |
| 15 | 46 | IV | 13 | Sensitive |
| 16 | 42 | IIIC | No records | Insensitive |
| 17 | 64 | IIIC | 31 | Sensitive |
| 18 | 55 | IIIC | 4 | Indeterminacy |
| 19 | 45 | IIIC | 58 | Indeterminacy |
| 20 | 57 | IIIC | 13 | Insensitive |
| 21 | 58 | IIIC | 26 | Sensitive |
| 22 | 28 | None | 15 | Sensitive |
| 23 | 58 | IIIC | 16 | Sensitive |
| 24 | 53 | IIIC | No records | No records |
| 25 | 61 | IV | 11 | Insensitive |
| 26 | 79 | None | No records | No records |
| 27 | 52 | IIIC | 22 | Sensitive |
| 28 | 59 | IIIC | 9 | Indeterminacy |
| 29 | 50 | IIIC | 23 | Sensitive |
| 30 | 62 | IV | 20 | Sensitive |
| 31 | 64 | IIIb | 9 | Indeterminacy |
| 32 | 30 | None | 7 | Insensitive |
| 33 | 50 | None | 9 | Indeterminacy |
| 34 | 59 | None | 21 | Sensitive |
| 35 | 44 | IIIC | 23 | Sensitive |
| 36 | 50 | None | 13 | Insensitive |
| 37 | 49 | III | 8 | Indeterminacy |
| 38 | 30 | IV | 4 | Insensitive |
| 39 | 64 | IIIC | 9 | Insensitive |
| 40 | 48 | None | 9 | Insensitive |
| 41 | 51 | IIIC | No records | No records |
| 42 | 60 | IIIC | 4 | Indeterminacy |
| 43 | 56 | IIIC | 14 | Insensitive |
| 44 | 40 | None | 10 | Indeterminacy |
2.2 RNA isolation and sequencing
RNA was isolated from tumor tissues using TriReagent (Ambion Inc). Agarose gel electrophoresis was performed to determine the extent of RNA degradation and contamination. The purity of the RNA was also measured by Nanodrop (ND-1000). The concentration was precisely quantified by Qubit. The integrity was assayed by Agilent 2100 and samples with a RIN value of 7 or above were used for further analysis. Small RNA sequencing libraries were created according to the IlluminaHTruSeq TM Small RNA Sample Preparation protocol. Segment sizes were selected by AMPure XP beads, and PCR enrichment was conducted to obtain the final cDNA library. HiSeq sequence was conducted after the library passed the inspection.
2.3 Identification of DEGs
The quality of RNAseq data was controlled by Fastp software. RNA-seq data of OC tissues was blasted to the Hg19 human reference genome by STAR software. Quantification and standardization of genes used RSEM software (count FPKM TPM). The read count data were then analyzed to identify DEGs in OC tissues and normal tissues through edgeR v3.12.0 in R v3.2.2 with false positive discovery (FDR) correction. The read count data of normal tissues belong to the Common Fund's Genotype-Tissue Expression (GTEX) (http://commonfund.nih.gov/GTEx/), the largest international normal tissue database. In addition, the read count data were also analyzed to identify DEGs in chemotherapy sensitive and insensitive tissues by the same method. The SVA software was used to eliminate the batch effect. The genes meeting the conditions of |log2 fold change (logFC)| >2 and P < .01 were considered as DEGs.
2.4 Enrichment analysis of DEGs
Gene Ontology (GO) database (http://www.geneontology.org/) and Kyoto Encyclopedia of Genes and Genomes pathway (KEGG) (http://www.kegg.jp) were used to enrich the DEGs in cancer occurring and chemotherapy sensitivity group separately. We utilized r packages “org.Hs.eg.db47” and “clusterProfile48” to identify the proteins belonging to corresponding pathway. P < .05 set as the threshold.
2.5 Real-time PCR
RNA was extracted from tissues with ovarian cancer using DNA/RNA isolation kit (TIANGEN). Concentrations and purity of RNA were analyzed using a NanoDrop ND-1000 Spectrophotometer. Up to 1 μg total RNA from each sample was reverse transcribed to cDNA using a PrimeScriptTM RT reagent kit (Takara). The following primer pairs were used to evaluate the relative expression level of each mRNA: β-actin: F: 5′-AAGGTGACAGCAGTCGGTT-3′, R: 5′-TGTGTGGACTTGGGAGAGG-3′; JUND: F: 5′-CAAGGACGAGCCACAGACG-3′, R: 5′-CCGTGTTCTGACTCTTGAGGG-3′; MUC5B: F: 5′-AACTGCACCGTGTACCTCTG-3′, R: 5′-TCGTGTTGATGCGGACTTGA-3′. All primers were purchased from Sangon Biotech. Quantitative PCR assays were performed using Hieff UNICON Power qPCR SYBR Green Master Mix (YEASEN) and Applied Biosystems QuanStudio Dx Real-Time PCR system. For each sample, 20 μL reactions were set up containing 10 μL 2× SYBR mix, 0.4 μL PCR forward primer (10 μM), 0.4 μL PCR reverse primer (10 μM), 2 μL template cDNA, and 7.2 μL RNase-free water. All PCR reactions were performed in triplicate. The following cycling protocol was used: 95°C for 3 minutes, then 40 cycles with a two-step programme (95°C for 10 seconds, 60°C for 30 seconds), and completed with a product dissociation cycle. The relative expression values for each target gene are shown as 2−ΔCt.
2.6 Immunohistochemical staining and evaluation
Formalin-fixed and paraffin-embedded sections were dewaxed in xylene and hydrated in grade alcohol, followed by inhibition of endogenous peroxidase activities with methanol containing 0.3% H2O2. After boiling in 10 mmol/L of citrate buffer (pH 6.0) for antigen retrieval and cooling down, the sections were blocked with 1% BSA and incubated overnight at 4°C with rabbit polyalonal antibody to JunD (Abcam, ab28837, 1:200) and MUC5B (Abcam, ab87376, 1:100). On the second day, these sections were incubated for another 45 minutes at 37°C. After washing with PBS, the sections were incubated with HRP-conjugated secondary antibody (Shanghai Long Island Biotech) for 1 hour at room temperature, followed by reaction with diaminobenzidine, and counterstaining with hematoxylin.
3 RESULTS
3.1 OC-related biological processes and pathways
A total of 1588 DEGs were identified between 44 OC and 133 healthy controls (HCs) (belonging to GTEX), including 945 up-regulated genes and 643 down-regulated genes in OC compared with HCs as shown in volcano plot (Figure 1A). The heat map successfully clustered the two groups of samples separately (Figure 1B).
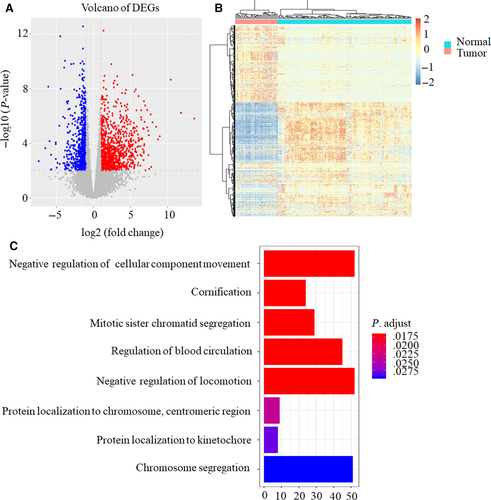
GO analysis showed that several biological processes, such as cellular component movement, cornification, mitotic sister chromatid segregation, blood circulation, locomotion, protein localization, and chromosome segregation were associated with OC occurring (Figure 1C). KEGG results demonstrated that cell cycle pathway was related to OC occurring (Table 2).
| ID | Pathway | P value | Genes |
|---|---|---|---|
| hsa04110 | Cell cycle | .000120948 | E2F2, CDC14B, ORC1, TGFB2, CDC45, CDC6, ABL1, E2F1, MCM4, CCND3, TTK, CDC20, PKMYT1, CCNA1, CCNB1, ESPL1, BUB1B, CCNB2, PTTG1, PLK1, BUB1, CDK1, SFN |
Taken together, the mechanism of OC occurring is complex involving multiple genes and biological processes.
3.2 Chemotherapy sensitivity-related biological processes and pathways
A total of 249 DEGs were identified between 18 chemotherapy sensitive OC patients and 14 chemotherapy insensitive OC patients, 108 genes were up-regulated and 141 genes were down-regulated in chemotherapy sensitive OC patients compared with chemotherapy insensitive OC patients as shown in volcano plot (Figure 2A).
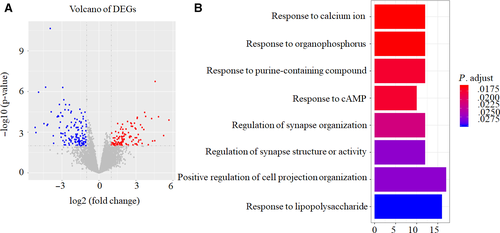
Furthermore, GO analysis demonstrated that DEGs mainly participated in the following biological processes: responding to calcium ion, organophosphorus, purine-containing compound, cAMP, lipopolysaccharide, regulating of synapse organization, structure or activity, and positive regulating of cell projection organization (Figure 2B).
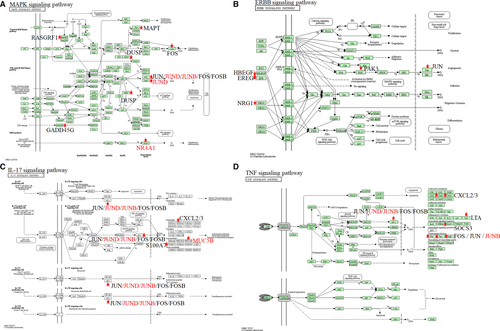
KEGG analysis showed that DEGs were mainly enriched in four cancer-related signaling pathways including MAPK signaling pathway (Figure 3A), ERBB signaling pathway (Figure 3B), IL-17 signaling pathway (Figure 3C) and TNF signaling pathway (Figure 3D). MAPK and ERBB pathway were reported to be associated with cisplatin resistance in OC patients. MAPK inhibitors combined with miR-139-5p or metformin could improve cisplatin sensitivity in cisplatin-resistant ovarian cancer.24, 25 NRF2 could affect the sensitivity of ovarian cancer cells to rapatinib and erotinib by regulating the ERBB signaling pathway.26 IL-17 and TNF signaling pathway were identified to be related with chemotherapy sensitivity in ovarian cancer patients for the first time.
3.3 Key genes associated with chemotherapy sensitivity in OC patients
To identify the crucial genes that were associated with chemotherapy sensitivity in OC, we picked out 35 DEGs which were shared in both chemotherapy sensitivity group and OC occurring group (Table 3). Among them, five common DEGs (MUC5B, NR4A1, JUND, NRG1, and JUNB) participating in the four chemotherapy sensitivity-related signaling pathways were regarded as key chemotherapy sensitive genes (Figure 3). We found that JUND, JUNB, NR4A1, and NRG1 were down-regulated in chemotherapy sensitive OC patients while MUC5B was up-regulated in chemotherapy sensitive OC patients.
| Chemotherapy sensitivity vs insensitivity | Ovarian cancer vs healthy controls | ||||
|---|---|---|---|---|---|
| Name | ENSG | LogFC | P value | LogFC | P value |
| PON1 | ENSG00000005421 | 1.833847 | .008056 | 3.841751 | .00087 |
| GABRP | ENSG00000094755 | 1.879524 | .009199 | 6.357848 | .00017 |
| TSPAN12 | ENSG00000106025 | −1.50372 | .001892 | 2.66721 | .000167 |
| WNT3 | ENSG00000108379 | 1.45233 | .008192 | −1.77304 | .006368 |
| CYP27B1 | ENSG00000111012 | −1.87876 | .005665 | 1.905459 | .003234 |
| REEP6 | ENSG00000115255 | −1.44408 | .000177 | 1.561005 | .001993 |
| MUC5B | ENSG00000117983 | 3.194437 | .005183 | 5.930497 | .000787 |
| PAEP | ENSG00000122133 | 3.097212 | 9.58E-05 | 13.58829 | 1.56E-06 |
| NR4A1 | ENSG00000123358 | −3.9535 | 2.23E-11 | −2.98467 | .001218 |
| SLC12A5 | ENSG00000124140 | 1.676727 | .002127 | 4.846811 | .000172 |
| PDE11A | ENSG00000128655 | 4.557034 | 1.80E-07 | −3.52042 | 9.74E-05 |
| UNC13A | ENSG00000130477 | −1.92861 | .004804 | 4.392345 | 1.26E-08 |
| JUND | ENSG00000130522 | −1.06396 | .000781 | −1.18872 | .00886 |
| RIDA | ENSG00000132541 | −1.15846 | .001495 | 1.725161 | 2.37E-06 |
| CCNA1 | ENSG00000133101 | −1.8558 | .00352 | 3.134505 | .000824 |
| ADAMTS8 | ENSG00000134917 | −1.58246 | .006785 | −2.73841 | .004266 |
| FAM129A | ENSG00000135842 | 1.027988 | .001155 | 1.553927 | .006426 |
| KLF4 | ENSG00000136826 | −1.28913 | .001771 | −2.14326 | .002117 |
| CTSV | ENSG00000136943 | −1.2422 | .008885 | 5.136691 | 6.79E-05 |
| SLC38A4 | ENSG00000139209 | −3.13203 | .00018 | 3.060874 | .002518 |
| ASXL3 | ENSG00000141431 | −2.13847 | .006873 | −1.64258 | .004782 |
| PRDM16 | ENSG00000142611 | −2.10995 | .002232 | −4.42514 | 1.04E-08 |
| CSRNP1 | ENSG00000144655 | −1.54792 | 2.03E-05 | −1.68077 | .003687 |
| AKAP6 | ENSG00000151320 | −1.70078 | .000439 | −2.50857 | 6.06E-07 |
| NRG1 | ENSG00000157168 | −2.76012 | .001689 | −3.44511 | .001391 |
| COX6B2 | ENSG00000160471 | 1.839231 | .005223 | 3.009415 | .002123 |
| ATF3 | ENSG00000162772 | −2.2823 | 3.72E-05 | −2.99682 | .000605 |
| JUNB | ENSG00000171223 | −1.5749 | .000159 | −2.57489 | .002806 |
| APLN | ENSG00000171388 | 1.220806 | .008744 | −4.08733 | 1.16E-06 |
| PER1 | ENSG00000179094 | −1.28081 | .000103 | 1.871473 | .000631 |
| EDARADD | ENSG00000186197 | 1.288147 | .002622 | 3.464221 | .000759 |
| KRT16 | ENSG00000186832 | −2.44136 | .002875 | 5.150993 | .00058 |
| C11orf96 | ENSG00000187479 | −1.95876 | .000101 | −2.61812 | .000162 |
| COL25A1 | ENSG00000188517 | −1.7561 | .008887 | −2.17127 | .009636 |
| PPP1R14C | ENSG00000198729 | −1.44426 | .009574 | 4.903514 | .000209 |
Note
- The bold letters represent genes involved in chemotherapy sensitive pathways.
3.4 Gene expression verified by qPCR and IHC
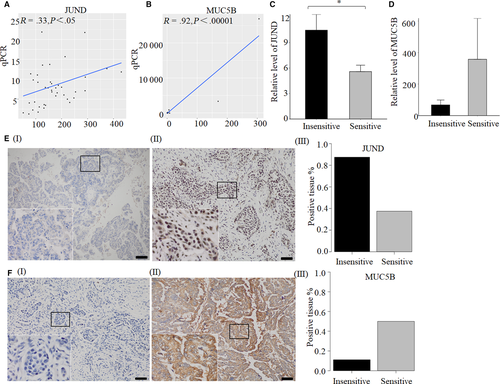
JUND and MUC5B are involved in IL-17 signaling pathway, and JUND is in the upstream of MUC5B. So we think these two genes are worth to be studied. Their expression levels were further verified by qPCR and IHC. The results of NGS and qPCR existed significant correlation for JUND (n = 40, R = .33, P < .05) and MUC5B (n = 38, R = .65, P < .0001) (Figure 4A,B). The relative expression level of JUND was decreased significantly in 13 sensitive tissues compared with 14 insensitive tissues (P < .05) (Figure 4C). While the relative level of MUC5B was increased in 13 sensitive tissues but without statistically significant (P = .29) (Figure 4D). IHC was performed in eight sensitive tissues and eight insensitive tissues to verify the expression level of JUND and MUC5B. The results showed that, the positive rate of JUND expression in the chemotherapy sensitive group was 37.5%, which was lower than chemotherapy insensitive group (87.5%) (Figure 4E). Fifty percent of samples were positive expression of MUC5B in chemotherapy sensitive group, while the positive rate was 11.1% in chemotherapy insensitive group (Figure 4F).
4 DISCUSSION
In this study, JUND, JUNB, MUC5B,27 NRG128 and NR4A129 were identified as the key genes associated with chemotherapy sensitivity in OC by NGS and bioinformatics technology. These genes are involved in four chemotherapy sensitivity-related signaling pathways (MAPK signaling pathway,24, 25 ERBB signaling pathway,26 TNF signaling pathway, and IL-17 signaling pathway). Especially, JUND and MUC5B are negative correlated in IL-17 signaling pathway. Ju et al27 also showed that MUC5B was a down-regulated gene in chemotherapy resistant epithelial ovarian cancer. Here, we further found its upstream gene JUND associated with chemotherapy for the first time. We showed that JUND was down-regulated in chemotherapy sensitive patients. Furthermore, the differential expression of JUND in qPCR and IHC was much significant. Thus, JUND will be a good marker to predict chemotherapy effect. Our results also provide a basis for additionally functional studies that inhibiting of JUND expression may increase chemotherapy sensitivity in OC patients.
JunD and JunB are sub-units of activator protein-1 (AP-1) which plays an important role in the regulation of cell proliferation, apoptosis and angiogenesis.30 In our study, JUNB gene was also down-regulated in chemotherapy sensitive patients, which was consistent with JUND expression. The high expression of JUNB may predict a poor prognosis for patients with OC was also reported by Teng et al.31
NRG1 gene encodes Neuregulin-1 protein, one of the ligands for members of the ErbB/epidermal growth factor-receptor family. It was reported that down-regulation of NRG1 expression could sensitize ovarian tumors to low cisplatin concentration.28 Our analysis by NGS and bioinformatics also showed that NRG1 gene was down-regulated in chemotherapy sensitive OC patients. NR4A1 gene encodes a member of the steroid-thyroid hormone-retinoid receptor superfamily which acts as a nuclear transcription factor to induce apoptosis. Its role in ovarian cancer has not been determined. A study showed that NR4A1 expression was significantly lower in platinum-resistant tumors in patients with metastatic OC, and low NR4A1 staining was associated with poorer prognosis.29 However, our results demonstrated that NR4A1 was a down-regulated gene in chemotherapy sensitive OC patients. Another literature also reported that high expression of NR4A1 in high grade serous ovarian cancers had worse prognosis.32 The discordance in these studies about the relationship between NR4A1 and chemotherapy is perhaps induced by the limited clinical samples. We should expand samples for further study.
In summary, TNF signaling pathway and IL-17 signaling pathway were firstly identified as OC chemotherapy sensitivity-related pathways. JUND was firstly identified as key genes associated with chemotherapy sensitivity in OC patients. In IL-17 signaling pathway, JUND/JUNB might transcriptional regulate MUC5B to influence the chemotherapy sensitivity in OC patients. We will further study the interaction between JUND/JUNB and MUC5B in vivo and in vitro to uncover the mechanism of chemotherapy sensitivity in ovarian cancer. More samples will be collected to verify the conclusions. Our findings provide a valuable reference for prediction of chemotherapy response in ovarian cancer patients.
ACKNOWLEDGMENTS
The authors thank the National Natural Science Foundation of China and Shanghai Science and Technology Commission for funding supporting.
CONFLICT OF INTEREST
The authors declare that they have no competing interests.
AUTHOR CONTRIBUTIONS
Hui Zheng contributed to study design, data acquisition and analysis, literature search, figures, and writing. Meiqin Zhang contributed to provision of study materials or patients, analysis, and interpretation of data. Shuang Ma contributed to literature search, figures, and writing. Wenting Yang contributed to data collection and analysis. Suhong Xie and Yanchun Wang contributed to technical support. Yixuan Liu, Jinyan Kai, and Qian Ma contributed to some basic experiments. Renquan Lu and Lin Guo contributed to study concept and design, administrative support, data interpretation, and article revision.
ETHICS APPROVAL AND CONSENT TO PARTICIPATE
The research was authorized by the Ethics Committee of Fudan University Shanghai Cancer Center and informed consent was obtained from all patients.
Open Research
DATA AVAILABILITY STATEMENT
The data that support the findings of this study are available from the corresponding author upon reasonable request.


