NLRC and NLRX gene family mRNA expression and prognostic value in hepatocellular carcinoma
Abstract
Nucleotide-binding oligomerization domain (NOD)-like receptor (NLR)C and NLRX family proteins play a key role in the innate immune response. The relationship between these proteins and hepatocellular carcinoma (HCC) remains unclear. This study investigated the prognostic significance of NLRC and NLRX family protein levels in HCC patients. Data from 360 HCC patients in The Cancer Genome Atlas database and 231 patients in the Gene Expression Omnibus database were analyzed. Kaplan–Meier analysis and a Cox regression model were used to determine median survival time (MST) and overall and recurrence-free survival by calculating the hazard ratio (HR) and 95% confidence interval (CI). High NOD2 and low NLRX1 expression in tumor tissue was associated with short MST (P = 0.012 and 0.014, respectively). A joint-effects analysis of NOD2 and NLRX1 combined revealed that groups III and IV had reduced risk of death from HCC as compared to group I (adjusted P = 0.001, adjusted HR = 0.31, 95% CI = 0.16–0.61 and adjusted P = 0.043, adjusted HR = 0.63, 95%CI = 0.41–0.99, respectively). NOD2 and NLRX1 expression levels are potential prognostic markers in HCC following hepatectomy.
Introduction
Hepatocellular carcinoma (HCC) is the most common type of liver cancer and the fifth most common malignancy worldwide, ranking as the third leading cause of cancer-related death 1. The 5-year relative survival rate for HCC is approximately 7% 1. About half of the 782,500 liver cancer cases newly diagnosed worldwide in 2012 were in China 2, 3. Infection with hepatitis B and C viruses (HBV and HCV, respectively) is the major cause of hepatocarcinogenesis 4. Other risk factors include cirrhosis, aflatoxin exposure, hemochromatosis, obesity, diabetes mellitus, and metabolic factors 4. In addition, the high frequency of late-stage disease, metastasis, de novo tumor formation in the diseased liver 5, high rate of recurrence 6, and aberrant gene expression 7, 8 contribute to poor patient prognosis.
The dysregulation of various genes has been linked to HCC prognosis 9, 10. We hypothesized that certain gene families are associated with HCC prognosis; a literature search revealed that only few have been identified 11, 12. Nucleotide-binding oligomerization domain (NOD)-like receptors (NLRs) are cystosolic pattern recognition receptors (PRRs) and include five subfamilies—that is, NLRA, NLRB, NLRC, NLRP, and NLRX. These receptors play an important role in monitoring the intracellular microenvironment and mediating inflammation and pathogen clearance 13. The NLRC family has five members—that is, NOD1, NOD2, NLRC3, NLRC4, and NLRC5 13. NOD1 and NOD2 are important components of the innate immune system that protects organisms from Helicobacter pylori infection 14 and function as pattern-recognition molecules that initiate intracellular signaling pathways in response to pathogen-associated molecular patterns 15. NLRC3 was identified as a negative regulator of type I interferon and proinflammatory cytokine production 16. In contrast, the functions of NLRC4 are not well understood 17. NLRC5 is negative regulator of nuclear factor κB and type I interferon pathways, and is thus important for innate immune system homeostasis 18. NLRX1, the only NLR localized in mitochondria and the sole member of the NLRX family, was found to stimulate reactive oxygen species production following Shigella flexneri infection 19.
Abnormal inflammation is considered as an indicator of tumorigenesis and malignancy. Four major families of PRR—that is, toll-like receptors (TLRs), C-type lectin receptors, RIG-I-like receptors, and NLRs—have been implicated in cell proliferation, angiogenesis, tissue remodeling and repair, and tumorigenesis 20. Most studies of PRR signaling in malignancies to date have focused on TLR family members. However, recent studies indicate that NLR family members play a direct or indirect role in cancer cell death, angiogenesis, invasion, and metastasis 21, 22. The present study investigated the prognostic value of NLRC and NLRX family proteins in HCC.
Material and Methods
Patient information
We used an online resource (http://merav.wi.mit.edu/; accessed February 10, 2017) to identify genes of the NLRC and NLRX families that are differentially expressed between normal liver tissue and primary liver tumors. We then used the online website (http://www.oncolnc.org/; accessed September 2, 2017) and The Cancer Genome Atlas (TCGA), (http://tcga-data.nci.nih.gov/tcga) to obtain information on mRNA expression levels of NOD1, NOD2, NLRC3, NLRC4, NLRC5, and NLRX1 at a 75% cutoff; the results presented here are based in part on data generated by TCGA Research (http://cancergenome.nih.gov/) 23. Clinical data of 360 patients were also downloaded, including race, gender, age, body mass index (BMI), tumor-node-metastasis (TNM) stage, survival time (days), and survival status.
Gene expression profiles were obtained from an independent dataset (GSE14520) in the National Center for Biotechnology Information Gene Expression Omnibus (GEO) (https://www.ncbi.nlm.nih.gov/geo/query/acc.cgi?acc=GSE14520, accessed February 15, 2017) database 24. The dataset contained expression profiles generated from [HT_HG-U133A] Affymetrix HT Human Genome U133A 24 and [HT_HG-U133A_2] Affymetrix HT Human Genome U133A_2.0 25 arrays. To avoid a batch effect, we selected a profile from the former array that had more patients (n = 231 HCC patients) than the latter. Furthermore, the GeneMANIA website (http://genemania.org/; accessed February 18, 2017) was used to analyze interaction networks of the two NLR families 26.
Functional enrichment analysis of NLRC and NLRX families
The Database for Annotation, Visualization, and Integrated Discovery (DAVID) v.6.7 (https://david-d.ncifcrf.gov/, accessed February 25, 2017) 27, 28 was used for functional enrichment analyses, including gene ontology (GO) functional analysis and Kyoto Encyclopedia of Genes and Genomes (KEGG) pathway analysis. The former included biological process (BP) and molecular function (MF) terms; in the latter, no results were returned for NLRC and NLRX families.
Survival analysis
In TCGA database, mRNA expression levels in 360 HCC patients were divided into two groups at a cutoff value of 75%; low and high expression groups comprised 270 and 90 patients, respectively. The same cutoff value was applied to the GEO database in order to ensure a reasonable comparison between the two databases. Median survival time (MST) was used to evaluate the prognosis of HCC patients in TCGA database, whereas overall survival (OS) and recurrence-free survival (RFS) were used to assess that of patients in the GEO database. Sex, age, and TNM stage were adjusted in the Cox proportional hazards regression model in TCGA database, whereas gender, age, HBV infection status, alanine aminotransferase (ALT) status, main tumor size, multinodule status, cirrhosis, alphafetoprotein (AFP) level, and Barcelona Clinic Liver Cancer (BCLC) stage were adjusted in the Cox proportional hazards regression model in the GEO database.
Joint-effects analysis
Only NOD2 and NLRX1 were statistically significant in TCGA database. We carried out a joint-effects analysis of the combination of NOD2 and NLRX1.
The combination of NOD2 and NLRX1 included group I (high NOD2 and low NLRX1 expression), group II (high NOD2 and high NLRX1 expression), group III (low NOD2 and high NLRX1 expression), and group IV (low NOD2 and low NLRX1 expression).
Sex, age, and TNM stage were adjusted in the Cox proportional hazards regression model according to the combination of genes in TCGA database.
Statistical analysis
Pearson correlation coefficients were used to assess correlations among NOD1, NOD2, NLRC3, NLRC4, NLRC5, and NLRX1 genes. Kaplan–Meier survival analysis and the log-rank test were used to calculate MSTs and P values. Uni- and multivariate survival analyses were performed using the Cox proportional hazards regression model. Hazard ratios (HRs) and 95% confidence intervals (CIs) were calculated with the Cox proportional hazards regression model with adjustment for influential clinical characteristics such as gender, age, HBV infection status, ALT status, main tumor size, multinodule status, cirrhosis, TNM stage, and AFP level. P < 0.05 was considered as statistically significant. Vertical scatter plots and survival curves were plotted using GraphPad Prism v.5.0 (La Jolla, CA). Statistical analyses was performed with SPSS software v.22.0 (IBM, Chicago, IL).
Results
Characteristics of patients in TCGA and GEO databases
Detailed characteristics of the 360 patients in TCGA are shown in Table 1. Race, gender, age, BMI, were not associated with MST. On the other hand, TNM stage, NOD2 and NLRX1 levels showed significant associations with MST (P <0.001; adjusted P= 0.014 and 0.011, respectively).
| Variables | Patients (n = 360) | No. of events (%) | MST (moths) | HR (95% CI) | Log-rank P |
|---|---|---|---|---|---|
| Race | 0.176 | ||||
| Asian | 155 | 44 (28.4%) | NA | Ref. | |
| White+others | 196 | 78 (39.8%) | 47 | 1.29 (0.89–1.88) | |
| MissingĐ | 9 | ||||
| Gender | 0.311 | ||||
| Male | 244 | 78 (32.0%) | 83 | Ref. | |
| Female | 116 | 48 (41.4%) | 52 | 1.21 (0.84–1.73) | |
| Age(year) | 0.362 | ||||
| <60 | 168 | 54 (32.1%) | 84 | Ref. | |
| ≥60 | 189 | 70 (37.0%) | 56 | 1.18 (0.83–1.68) | |
| Missing† | 3 | ||||
| BMI | 0.496 | ||||
| ≤25 | 193 | 66 (34.2%) | 82 | Ref. | |
| >25 | 137 | 45 (32.8%) | 71 | 0.88 (0.60–1.28) | |
| Missingý | 30 | ||||
| TNM stage | <0.001 | ||||
| A+B | 252 | 66 (26.2%) | 84 | Ref. | |
| C+D | 87 | 48 (55.2%) | 26 | 2.48 (1.71–3.61) | |
| MissingĹ | 21 | . | |||
| NOD1 | 0.197 | ||||
| Low | 270 | 89 (33.0%) | 71 | Ref | |
| High | 90 | 37 (41.1%) | 50 | 1.29 (0.88–1.89) | |
| NOD2 | 0.012 | ||||
| Low | 270 | 82 (30.4%) | 83 | Ref | |
| High | 90 | 44 (48.9%) | 47 | 1.60 (1.11–2.30) | |
| NLRC3 | 0.043 | ||||
| Low | 270 | 103 (38.1%) | 54 | Ref | |
| High | 90 | 23 (25.6%) | 82 | 0.63 (0.40–0.99) | |
| NLRC4 | 0.700 | ||||
| Low | 270 | 92 (34.1%) | 60 | Ref. | |
| High | 90 | 34 (37.8%) | 56 | 1.08 (0.73–1.60) | |
| NLRC5 | 0.277 | ||||
| Low | 270 | 98 (36.3%) | 56 | Ref. | |
| High | 90 | 28 (31.1%) | 60 | 0.79 (0.52–1.21) | |
| NLRX1 | 0.015 | ||||
| Low | 270 | 103 (38.1%) | 52 | Ref. | |
| High | 90 | 23 (25.6%) | 85 | 0.57 (0.36–0.90) |
- BMI, body mass index; TNM stage, tumor, node and metastasis stage; MST, median survival time; HR, hazard ratio; 95% CI, 95% confidence interval; Ref, reference; NOD,=nucleotide-binding oligomerization domain; NLRC= nucleotide-binding oligomerization domain-like receptors family CARD domain containing; NLRX1, nucleotide-binding oligomerization domain-like receptors family member X1; MissingĐ, information of race was unavailable in 9 patients; Missing†,information of age was unavailable in 3 patients; Missingý, information of BMI was unavailable in 30 patients; MissingĹ, information of TNM stage was unavailable in 21 patients.
- Bold value in all the tables were statistically significant (P ≤ 0.05).
The characteristics of the 231 patients in the GEO database are shown in Table 2. Sex, main tumor size, multinodule status, cirrhosis, BCLC stage, and AFP level were significantly associated with OS (P = 0.048, <0.001, 0.003, 0.002, 0.001, and 0.001, respectively), whereas gender, main tumor size, cirrhosis, and BCLC stage were significantly associated with RFS (P = 0.001, 0.019, 0.016, and <0.001, respectively).
| Variables | Patients (n = 231) | Overall survival | Recurrence-free survival | ||||
|---|---|---|---|---|---|---|---|
| MST (months) | HR (95%CI) | Log-rank P | MST (months) | HR (95%CI) | Log-rank P | ||
| Gender | 0.048 | 0.001 | |||||
| Male | 191 | NA | Ref. | 40 | Ref. | ||
| Female | 30 | NA | 0.59 (0.34–1.00) | NA | 0.47 (0.29–0.75) | ||
| MissingƷ | 10 | ||||||
| Age | 0.852 | 0.937 | |||||
| ≤60 | 181 | NA | Ref. | 46 | Ref. | ||
| >60 | 40 | NA | 0.96 (0.65–1.44) | 37 | 1.01 (0.73–1.41) | ||
| MissingƷ | 10 | ||||||
| HBV-virus status | 0.147 | 0.090 | |||||
| AVR-CC | 56 | NA | Ref. | 30 | Ref. | ||
| CC+NO | 162 | NA | 0.80 (0.56–1.09) | 48 | 0.78 (0.59–1.04) | ||
| Missingƛ | 13 | ||||||
| ALT | 0.710 | 0.088 | |||||
| ≤50U/L | 130 | NA | Ref. | 53 | Ref. | ||
| >50U/L | 91 | NA | 1.06 (0.78–1.44) | 40 | 1.25 (0.97–1.61) | ||
| MissingƷ | 10 | ||||||
| Main tumor size | <0.001 | 0.019 | |||||
| ≤5 cm | 140 | NA | Ref. | 51 | Ref. | ||
| >5 cm | 80 | 53 | 1.87 (1.38–2.55) | 30 | 1.37 (1.05–1.78) | ||
| Missingƥ | 11 | ||||||
| Multinodular | 0.003 | 0.135 | |||||
| Yes | 45 | 48 | Ref. | 27 | Ref. | ||
| No | 176 | NA | 0.59 (0.42–0.84) | 49 | 0.79 (0.58–1.08) | ||
| MissingƷ | 10 | ||||||
| Cirrhosis | 0.002 | 0.016 | |||||
| Yes | 203 | NA | Ref. | 38 | Ref. | ||
| No | 18 | NA | 0.23 (0.09–0.63) | NA | 0.50 (0.28–0.89) | ||
| MissingƷ | 10 | ||||||
| BCLC stage | <0.001 | <0.001 | |||||
| 0+A | 168 | NA | Ref. | 58 | Ref. | ||
| B+C | 51 | 20 | 3.68 (2.66–5.06) | 18 | 2.84 (2.14–3.77) | ||
| MissingƜ | 12 | ||||||
| AFP | 0.001 | 0.093 | |||||
| ≤300 ng/ml | 100 | NA | Ref. | 49 | Ref. | ||
| >300 ng/ml | 118 | NA | 0.60 (0.44–0.81) | 31 | 0.80 (0.62–1.04) | ||
| Missingƛ | 13 | ||||||
| NOD1 | 0.862 | 0.379 | |||||
| Low | 187 | NA | Ref. | 42 | Ref. | ||
| High | 44 | NA | 0.97 (0.69–1.37) | 53 | 0.88 (0.65–1.18) | ||
| NOD2 | 0.262 | 0.449 | |||||
| Low | 169 | NA | Ref. | 46 | Ref. | ||
| High | 62 | NA | 1.21 (0.86–1.70) | 40 | 1.12 (0.84–1.50) | ||
| NLRX1 | 0.114 | 0.894 | |||||
| Low | 168 | NA | Ref. | 46 | Ref. | ||
| High | 63 | NA | 0.74 (0.51–1.08) | 43 | 1.02 (0.76–1.37) | ||
- AVR-CC, active viral replication chronic carrier; CC, chronic carrier; ALT, alanine aminotransferase; AFP, alpha fetoprotein; BCLC stage, Barcelona Clinic Liver Cancer; MissingƷ, information of gender, age, ALT, multinodular, cirrhosis was unavailable in 10 patients; Missingƥ, information of main tumor size was unavailable in 11 patients; MissingƜ, information of BCLC stage was unavailable in 12 patients; Missingƛ, information of HBV-virus status and AFP was unavailable in 13 patients.
- Bold value in all the tables were statistically significant (P≤0.05).
Correlation analysis of NLRC and NLRX family mRNA expression levels in TCGA and GEO databases
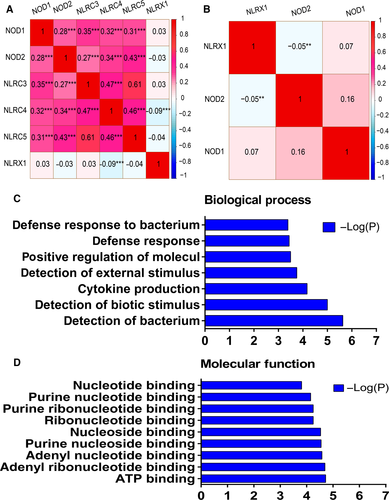
We calculated Pearson correlation coefficients between NLRC and NLRX families. In TCGA database, NOD1 was correlated with other NLRC family members (all P < 0.001) but not with the NLRX family member (P = 0.541), except for NRLC4 (P < 0.001, r = −0.09) (Fig. 1A). Only NOD1, NOD2, and NLRX1 expression data were available in the GEO database. NOD1 was correlated with NOD2 (P = 0.001) but not with the NLRX family member (P = 0.164); there was also no correlation between NOD2 and the NLRX family member (P = 0.341) (Fig. 1B).
GO functional annotation analysis of NLRC and NLRX families
To investigate biological functions of the NLRC and NLRX families, BP and MF were evaluated in the GO analysis (Fig. 1C and D). In the KEGG pathway analysis, DAVID did not identify any associations between NLRC and NLRX families.
Survival analysis of NLRC and NLRX family mRNA expression levels in TCGA and GEO databases
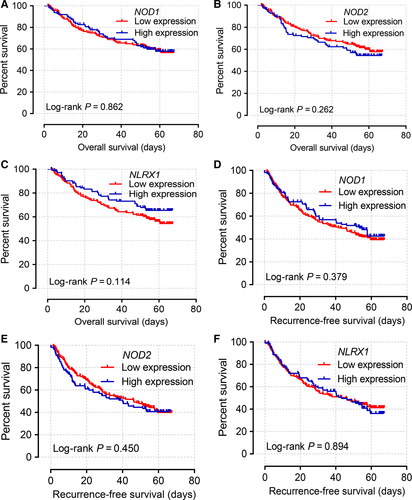
The characteristics of patients in TCGA database related to prognosis including age, gender, and TNM stage were analyzed with a multivariate Cox proportional hazards regression model. NOD2 and NLRX1 showed significant associations with MST (adjusted P = 0.014, adjusted HR = 1.64, 95% CI = 1.11–2.44; adjusted P = 0.011, adjusted HR = 0.53, 95% CI = 0.33–0.86, respectively) (Table 3). For patients in the GEO database, characteristics such as gender, age, HBV viral infection status, ALT status, main tumor size, multinodule status, cirrhosis, AFP level, and BCLC stage were analyzed with a multivariate Cox proportional hazards regression model. NOD1, NOD2, and NLRX1 were not significantly associated with OS or RFS (Table 4).
| Gene | Patients (n = 360) | MST (months) | Crude HR (95%CI) | Crude P | Adjusted HR§ (95%CI) | Adjusted P§ |
|---|---|---|---|---|---|---|
| NOD1 | ||||||
| Low | 270 | 71 | Ref | 0.197 | Ref. | 0.183 |
| High | 90 | 50 | 1.29 (0.88–1.89) | 1.32 (0.88–1.97) | ||
| NOD2 | ||||||
| Low | 270 | 83 | Ref. | 0.012 | Ref. | 0.014 |
| High | 90 | 47 | 1.60 (1.11–2.30) | 1.64 (1.11–2.44) | ||
| NLRC3 | ||||||
| Low | 270 | 54 | Ref. | 0.043 | Ref. | 0.207 |
| High | 90 | 82 | 0.63 (0.40–0.99) | 0.74 (0.46–1.19) | ||
| NLRC4 | ||||||
| Low | 270 | 60 | Ref. | 0.700 | Ref. | 0.461 |
| High | 90 | 56 | 1.08 (0.73–1.60) | 1.17 (0.77–1.79) | ||
| NLRC5 | ||||||
| Low | 270 | 56 | Ref. | 0.277 | Ref. | 0.168 |
| High | 90 | 60 | 0.79 (0.52–1.21) | 0.73 (0.47–1.14) | ||
| NLRX1 | ||||||
| Low | 270 | 52 | Ref. | 0.015 | Ref. | 0.011 |
| High | 90 | 85 | 0.57 (0.36–0.90) | 0.53 (0.33–0.86) | ||
- Adjusted P§, adjustment for gender, age, TNM stage.
- Bold value in all the tables were statistically significant (P ≤ 0.05).
| Gene | Patients | Overall survival | Recurrence-free survival | ||||||
|---|---|---|---|---|---|---|---|---|---|
| (n = 231) | Crude HR (95% CI) | Crude P | Adjusted HR (95%CI) | Adjusted P | Crude HR (95%CI) | Crude P | Adjusted HRa(95%CI) | AdjustedPa | |
| NOD1 | 0.862 | 0.210 | 0.379 | 0.051 | |||||
| Low | 187 | Ref. | Ref. | Ref. | Ref. | ||||
| High | 44 | 0.97 (0.69–1.37) | 0.79 (0.55–1.14) | 0.88 (0.65–1.18) | 0.74(0.54–1.00) | ||||
| NOD2 | 0.262 | 0.390 | 0.449 | 0.759 | |||||
| Low | 169 | Ref. | Ref. | Ref. | Ref. | ||||
| High | 62 | 1.21 (0.86–1.71) | 1.17 (0.82–1.65) | 1.12 (0.84–1.50) | 1.05 (0.78–1.41) | ||||
| NLRX1 | 0.114 | 0.056 | 0.894 | 0.768 | |||||
| Low | 168 | Ref. | Ref. | Ref. | Ref. | ||||
| High | 63 | 0.74 (0.51–1.08) | 0.68 (0.46–1.01) | 1.02 (0.76–1.37) | 0.96 (0.71–1.29) | ||||
- a Adjusted P, adjustment of gender, age, HBV-virus status, ALT, main tumor size, multinodular, cirrhosis, AFP, and BCLC stage.
Analysis of mRNA expression levels in TCGA and GEO databases
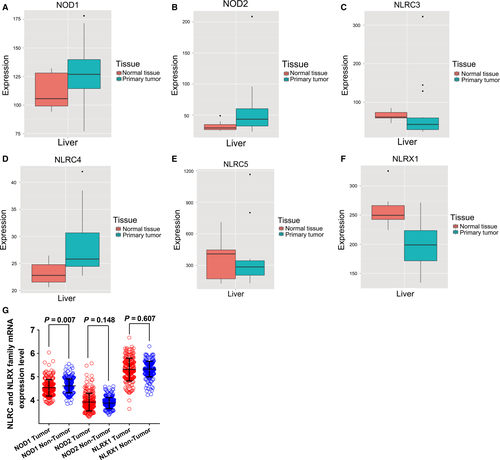
Box plots of the expression levels of six genes were downloaded from an online website (Fig. 2A–F). NLRC3, NLRC5, and NLRX1 were highly expressed in normal liver tissue whereas the expression in primary liver tumors was low. Scatter plots of NOD1, NOD2, and NLRX1 mRNA expression level in the GEO database revealed that only NOD1 expression differed significantly between tumor and nontumor tissue (P = 0.007; Fig. 2G).
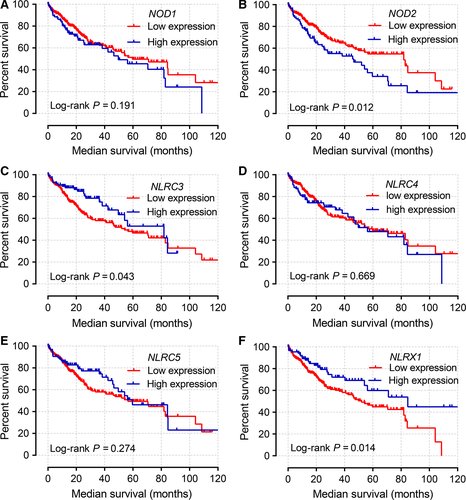
Kaplan–Meier curves of mRNA expression levels in TCGA database at a cutoff of 75% are shown in Figure 3. NOD2, NLRC3, and NLRX1 all had significant P values at this cutoff value (P = 0.011, 0.043, and 0.014, respectively).
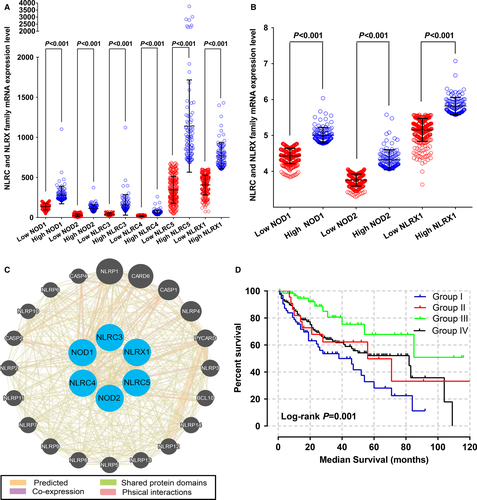
Kaplan–Meier curves of mRNA expression levels in the GEO database at 75% cutoff are shown in Figure 4. NOD1, NOD2, and NLRX1 did not have significant P values for OS and RFS (all P > 0.05). Scatter plots of the expression levels of six genes in the TCGA and GEO databases at a 75% cutoff are shown in Figure 5A and B.
Joint-effects analysis of NLRC and NLRX family mRNA expression levels in TCGA database
We carried out a joint-effects analysis for the combination of NOD2 and NLRX1. In the joint-effects analysis of the combination of NOD2 and NLRX1, group I had the shortest MST of 38 months (adjusted P = 0.007), whereas group III had the longest MST of 85 months (adjusted P = 0.001, adjusted HR = 0.31, 95% CI = 0.16–0.61) (Table 5). Interaction networks among NOD1, NOD2, NLRC4, NLRC5, and NLRX1 are shown in Figure 5C. Kaplan–Meier survival curves of the analyses of two genes are shown in Figures 5D.
| Group | NOD2 expression | NLRX1 expression | Patients (n = 360) | MST (months) | Crude P | Crude HR (95% CI) | Adjusted P* | Adjusted HR* (95% CI) |
|---|---|---|---|---|---|---|---|---|
| I | High | Low | 67 | 38 | 0.005 | Ref. | 0.007 | Ref. |
| II | High | High | 23 | 56 | 0.142 | 0.59 (0.29–1.20) | 0.228 | 1.61 (0.27–1.36) |
| III | Low | High | 67 | 85 | 0.001 | 0.32 (0.17–0.62) | 0.001 | 0.31 (0.16–0.61) |
| IV | Low | Low | 203 | 82 | 0.022 | 0.62 (0.42–0.93) | 0.043 | 0.63 (0.41–0.99) |
- Adjusted P*, adjustment for gender, age, TNM stage.
- Bold value in all the tables were statistically significant (P ≤ 0.05).
Discussion
In this study, we investigated the association between NLRC and NLRX family genes and HCC. We determined that the mRNA expression levels of these two NLR families are associated with distinct prognoses. Thus, the mRNA expression levels of NLRC and NLRX family genes alone or in combination—especially NOD2, and NLRX1 combined—can predict HCC prognosis.
NLR family genes are known to regulate the formation of the inflammasome and pro-inflammatory chemokines and cytokines that are involved in the host response to pathogens 29, 30. However, there is little known about the relationship between these gene families and cancer, especially HCC. NOD1 is an important factor in the defense against Pseudomonas aeruginosa 31, Listeria monocytogenes 32, and H. pylori 33 infection and has been linked to Crohn's disease 34, 35, inflammatory bowel disease 36, and Behcet's disease 36. NOD2 was found to be associated with Crohn's disease 37, ischemic cardiovascular disease 38, Blau syndrome 39, allergic rhinitis 40, and artherosclerosis 41. NLRC3 is a biomarker for colorectal cancer 42; NLRC4 was related to enterocolitis 43, recurrent macrophage activation syndrome 44, and familiar cold autoinflammatory syndrome 45; and NLRC5 has been implicated in chronic periodontitis 46. NLRX1 was found to be associated with risk of gastric cancer in the Chinese population 47. Interestingly, the other four genes in the NLRC and NLRX gene families did not show any direct or indirect associations with HCC, with the exception of NOD1/NOD2 pathway, which acted synergistically with NLRP3.
In this study, we found that NOD2 was highly expressed in primary liver tumors, which was associated with shorter MST. In contrast, NLRX1 was expressed at low levels in primary liver tumors, which was also linked to short MST. In the joint-effects analyses, groups I, had the shortest MST. In theory, the opposite trend in expression level for each gene should be associated with the best prognosis. Strikingly, this was only observed in group III.
AFP is a widely used serum diagnostic and prognostic biomarker for HCC. However, its prognostic value remains controversial. Serum AFP levels have been reported as an indicator of OS and RFS in HCC 48, 49. However, this was not confirmed in other studies 50-52. Its sensitivity for HCC screening ranges from 41 to 65% at a cutoff of 20 ng/mL 53-56. In recent years, various biomarkers have emerged for diagnosing HCC and predicting patient outcome, including glypican 3 and insulin-like growth factor (IGF)II mRNA 57, Keap1 and pNrf2 58, 3-microRNA and AFP 59, CXCL1 60, minichromosome maintenance complex -7 61, and IGF1 receptor 62, among others.
Mitochondria release molecules such as cytochrome c and apoptosis-inducing factor into the cytosol 63 and are associated with autophagy 64. Exogenous substances applied to HCC cell lines can affect the release of these molecules and thereby alter caspase-independent apoptosis signaling (i.e., the mitochondrial pathway) 65. Mitochondrial NLRX1 expression is altered in liver tissue in HCC, suggesting that it could affect apoptosis in HCC, although the detailed mechanisms remain to be determined.
There were some limitations to our study that need to be recognized. Firstly, larger sample sizes are needed in order to increase the reliability of the findings. Secondly, more clinical data concerning tumor progression and prognosis such as smoking and drinking status, Child–Pugh scoring, presence of cirrhosis, transarterial chemoembolization, antitherapy status, radical resection status, pathological differentiation diagnosis, main tumor size, numbers of tumors, status of tumor capsules, regional invasion, intrahepatic metastasis, and vascular invasion should be included to better evaluate the relationship between the two NLR gene families and HCC. Thirdly, the more commonly used indices of OS and RFS should be applied to the evaluation of HCC prognosis. Fourth, further investigations focusing on functional part needs to be well explored in multi-center, multi-racial countries. And functional validation in a well-designed clinical trial will be further studied in our future researches.
Conclusion
Our study demonstrates that NOD2, and NLRX1 may be potential prognostic biomarkers of HCC and their combination showed a strong interaction and better predictive value for HCC prognosis. Due to the small sample size and incomplete clinical information in this study, further well-designed and larger sample size studies are necessary to validate our results.
Conflict of Interest
None declared.


