Meiotic nuclear divisions 1 (MND1) fuels cell cycle progression by activating a KLF6/E2F1 positive feedback loop in lung adenocarcinoma
Abstract
Background
Considering the increase in the proportion of lung adenocarcinoma (LUAD) cases among all lung cancers and its considerable contribution to cancer-related deaths worldwide, we sought to identify novel oncogenes to provide potential targets and facilitate a better understanding of the malignant progression of LUAD.
Methods
The results from the screening of transcriptome and survival analyses according to the integrated Gene Expression Omnibus (GEO) datasets and The Cancer Genome Atlas (TCGA) data were combined, and a promising risk biomarker called meiotic nuclear divisions 1 (MND1) was selectively acquired. Cell viability assays and subcutaneous xenograft models were used to validate the oncogenic role of MND1 in LUAD cell proliferation and tumor growth. A series of assays, including mass spectrometry, co-immunoprecipitation (Co-IP), and chromatin immunoprecipitation (ChIP), were performed to explore the underlying mechanism.
Results
MND1 up-regulation was identified to be an independent risk factor for overall survival in LUAD patients evaluated by both tissue microarray staining and third party data analysis. In vivo and in vitro assays showed that MND1 promoted LUAD cell proliferation by regulating cell cycle. The results of the Co-IP, ChIP and dual-luciferase reporter assays validated that MND1 competitively bound to tumor suppressor Kruppel-like factor 6 (KLF6), and thereby protecting E2F transcription factor 1 (E2F1) from KLF6-induced transcriptional repression. Luciferase reporter and ChIP assays found that E2F1 activated MND1 transcription by binding to its promoter in a feedback manner.
Conclusions
MND1, KLF6, and E2F1 form a positive feedback loop to regulate cell cycle and confer DDP resistance in LUAD. MND1 is crucial for malignant progression and may be a potential therapeutic target in LUAD patients.
Abbreviations
-
- ANOVA
-
- Analysis of Variance
-
- BSA
-
- bovine serum albumin
-
- CCLE
-
- Cancer Cell Line Encyclopedia
-
- CCNB1
-
- Cyclin B1
-
- CCND1
-
- Cyclin D1
-
- CCNE1
-
- Cyclin E1
-
- CDK2
-
- Cyclin-dependent kinase 2
-
- CDK4
-
- Cyclin-dependent kinase 4
-
- CDK6
-
- Cyclin-dependent kinase 6
-
- CDKN1A
-
- Cyclin-dependent kinase inhibitor 1A
-
- CDKN1B
-
- Cyclin-dependent kinase inhibitor 1B
-
- ChIP
-
- Chromatin immunoprecipitation
-
- ChIP-seq
-
- Chromatin immunoprecipitation sequencing
-
- CI
-
- Confidence Interval
-
- Co-IP
-
- Coimmunoprecipitation
-
- DDP
-
- cisplatin
-
- DSB
-
- DNA double-strand break
-
- E2F1
-
- E2F Transcription Factor 1
-
- EdU
-
- 5-Ethynyl-2′-deoxyuridine
-
- ENCODE
-
- Encyclopedia of DNA Elements
-
- FBS
-
- bovine serum
-
- FDR
-
- false discovery rate
-
- GEO
-
- Gene Expression Omnibus
-
- GO
-
- Gene Ontology
-
- GSEA
-
- Gene set enrichment analysis
-
- HBE
-
- human bronchial epithelial
-
- HBE
-
- human bronchial epithelial
-
- HOP2
-
- homologous pairing protein 2
-
- HR
-
- Hazard Ratio
-
- IHC
-
- immunohistochemistry
-
- KLF6
-
- kruppel-like factor 6
-
- LUAD
-
- Lung adenocarcinoma
-
- LV
-
- lentiviral
-
- MND1
-
- meiotic nuclear divisions 1
-
- MSigDB
-
- Molecular Signature Database
-
- OE-MND1
-
- overexpressing MND1
-
- OS
-
- overall survival
-
- PBS
-
- phosphate buffer saline
-
- RMA
-
- robust multichip average
-
- RSEM
-
- Expectation-Maximization
-
- RTCA
-
- real-time xCELLigence analysis system
-
- SD
-
- Standard Deviation
-
- ssGSEA
-
- single sample Gene set enrichment analysis
-
- SUGs
-
- significantly up-regulated genes
-
- TCGA
-
- The Cancer Genome Atlas
-
- TF
-
- transcription factor
-
- TMA
-
- Tissue microarray
-
- TOM
-
- topological overlap matrix
-
- TU
-
- transducing units
-
- WGCNA
-
- weighted gene co-expression network analysis
1 BACKGROUND
Lung cancer is the most common malignancy worldwide and has a high mortality rate [1]. Lung adenocarcinoma (LUAD), which accounts for 40% of all lung cancer cases, has become the main histological subtype in recent years [2-4]. Despite rapid developments in cancer diagnosis and treatment, the outcome of LUAD remains unfavorable with an estimated 5-year survival rate lower than 20% [1, 5]. Therefore, there is a great need to identify potential therapeutic targets and reliable prognostic biomarkers for LUAD patients.
Meiotic nuclear divisions 1 (MND1) is a meiosis-specific protein which promotes homologous chromosome pairing DNA double-strand break (DSB) repair during meiosis [6]. Several studies have shown that meiotic factors could be powerful targets for therapeutics and biomonitoring in oncology [7-10]. In cancer cells, the interaction of MND1 with homologous pairing protein 2 (HOP2) assists in the utilization of an alternative lengthening of telomeres in the absence of telomerase reactivation [11, 12] which drives tumor formation and enhances cell proliferation and the evolutionary potential of cancer cells [13, 14]. In addition, MND1 possesses a DNA repair function during vegetative cell growth [14, 15]. MND1 expression has been shown to be elevated in squamous cell lung cancer, serving as a possible biomarker for poor prognosis [16]. However, the function and mechanism of MND1 in LUAD malignant progression are still unclear.
Uncontrolled cell cycle progression is well known to be an important hallmark of cancer [17]. A series of changes in cell cycle-related genes lead to cell cycle dysregulation, which induces uncontrolled cell division and causes cancer development and progression [18]. Controlling cell cycle progression to stop cancer cells from proliferating has enormous therapeutic potential [19]. During the cell cycle, E2F transcription factor 1 (E2F1) is a key regulator that initiates a signaling cascade that promotes cell cycle processes by activating the transcription of many downstream genes, i.e., cyclin A, cyclin E, and Cell Division Cycle 25C [20-22]. Abnormalities in E2F1 expression and amplification are frequently detected in various cancer types, and it has been generally accepted that these genomic changes typically contribute to malignant progression and predict poor prognosis [23]. Nevertheless, the latent mechanism that regulates the overexpression of E2F1 in LUAD, remains largely unclear.
In this study, we aimed to explore the expression and impact of MND1 in LUAD and further investigate the underlying upstream and downstream mechanism to offer novel insight into LUAD malignant progression.
2 MATERIALS AND METHODS
2.1 Data source and preprocessing
A series of microarray datasets (GSE72094, GSE41271, GSE13213, GSE31210, GSE30219, GSE50081, GSE37745, and GSE42127) across different platforms were downloaded from the Gene Expression Omnibus (GEO) (https://www.ncbi.nlm.nih.gov/geo/). Data of 1375 LUAD patients with accompanying information were accessed, and the raw data from each dataset were processed. Probe IDs were mapped to gene symbols using the corresponding annotation files. Moreover, The Cancer Genome Atlas (TCGA) level 3 RNA-Seq by Expectation-Maximization (RSEM)-normalized RNA-seq data and clinical phenotype data were accessed from University of California, Santa Cruz (UCSC) Xena (https://xenabrowser.net/datapages/).
GEO and TCGA data were combined to identify significantly up-regulated genes. Data from 4 GEO datasets (GSE31210, GSE30219, GSE50081, and GSE37745) were integrated into one set because these data were produced by the same chip platform (Affymetrix HG-U133 Plus 2.0 Array, Affymetrix Inc, Santa Clara, CA, USA). All raw CEL files related to the 544 LUAD and 34 normal samples in the 4 datasets were downloaded, and the data were normalized using a robust multichip average (RMA) algorithm [24]. With a threshold of fold change > 2 and adjusted P < 0.0001, significantly up-regulated genes were screened out using the ‘Limma’ R package. A TCGA dataset containing 515 LUAD and 59 normal samples with RSEM-normalized read counts was used as another set for the screening of significantly up-regulated genes. With a fold change threshold > 2 and false discovery rate (FDR) Q < 0.0001, significantly up-regulated genes were acquired using the ‘DEseq2’ R package.
2.2 Bioinformatic analyses
The weighted gene co-expression network analysis (WGCNA) was used to structure a scale-free co-expression network based on the RNA-seq data from TCGA [25]. A total of 14 non-gray modules were identified via hierarchical clustering analysis. Gene significance was used to quantify the association between individual genes and MND1, and module membership represented the correlation between the module eigengenes and the gene expression profiles. The module with the highest correlation with MND1 was selected for further study. Genes with a gene significance > 0.4 were submitted to Metascape [26] for Gene Ontology (GO) enrichment visualization.
A GEO dataset (GSE69405) containing single-cell RNA-seq data of cells derived from a LUAD patient was used. The corresponding gene set was retrieved from the Molecular Signature Database [27], and a single sample Gene Set Enrichment Analysis (ssGSEA) was implemented to quantify the levels of cell cycle progression in 77 cells derived from the same patient without treatment. Pearson's correlation coefficients were used to depict the relationship between MND1 and cell cycle progression. In addition, Gene Set Enrichment Analysis (GSEA) [28] was implemented to support the hypothetical E2F1-MND1 signaling pathway using the gene set “hallmark.all.v6.1.symbols.gmt” based on single-cell RNA-seq data of the 77 LUAD cells clustered by MND1 expression level.
Normalized RNA-seq data of MND1 and E2F1 from TCGA and Cancer Cell Line Encyclopedia (CCLE, https://portals.broadinstitute.org/ccle) were used to analyze their correlation in both LUAD tissues and cell lines.
The E2F1 chromatin immunoprecipitation sequencing (ChIP-seq) enrichment in the MND1 promoter region was assessed in 4 cell lines (LNCaP, MCF-7, Epithelium cell, and Raji) in the Encyclopedia of DNA Elements (ENCODE) database.
2.3 Tissue collection
The International Ethical Guidelines for Biomedical Research Involving Human Subjects were followed during the collection of human tissues. This research was given permission by the Ethics Committees of Nanjing Medical University and Jiangsu Cancer Hospital (Nanjing, Jiangsu, China). All patients supplied written consent for the use of surgical samples in researches. Sixty-two pairs of tumor tissues and adjacent normal tissues were collected from patients who had undergone surgery and had been diagnosed with LUAD (T1N0M0-T3N3M0 stage, American Joint Committee on Cancer staging system, 7th edition) by experienced pathologists at the Department of Thoracic Surgery, Jiangsu Cancer Hospital between March, 2011 and June, 2015.
2.4 RNA extraction and qRT-PCR analysis
RNA extraction and qRT-PCR were carried out as previously described [29]. The PCR primer sequences are listed in Supplementary Table S1. Statistical significance was calculated on replicates from three independent experiments.
2.5 Tissue microarray (TMA) and immunohistochemistry (IHC)
A TMA containing 87 pairs of LUAD and adjacent normal tissues and other 6 LUAD tissues, was purchased from Shanghai BioChip Co. Ltd. (Shanghai, China). These patients had undergone surgery and had been diagnosed with LUAD by experienced pathologists between 2004 and 2009. Each spot was followed with case data, covering the sex and age of the patient and the pathological grade and clinical stage of the cancer (Supplementary Table S2).
The IHC assays of the TMA were implemented as formerly described [30]. The antibodies are listed in Supplementary Table S3. As describe before [31], the staining intensity was divided into 4 grades: 0 (no staining), 1 (weak staining), 2 (moderate staining), and 3 (strong staining). The final staining score was calculated by multiplying the percentage of positive cells by the intensity score (minimum 0, maximum 300).
2.6 Cell lines and cell culture
The LUAD cell lines (A549, PC9, NCI-H1299, SPC-A1, and NCI-H1975), DDP-resistant A549 (A549/DDP), and human bronchial epithelial (HBE) cells were purchased from Shanghai Institutes for Biological Science (Shanghai, China). DMEM or RPMI-1640 medium (KeyGene, Nanjing, Jiangsu, China), which was supplemented with 10% fetal bovine serum (FBS, Gibco, Carlsbad, CA, USA), was used to culture cells. All cells were grown in an incubator at 37°C in 5% CO2. We routinely detected of mycoplasma contamination. All cell lines were authenticated.
2.7 Cell proliferation, migration, and invasion assays
Cell proliferation was monitored using the Real-Time xCELLigence Analysis (RTCA, Roche Applied Science and ACEA Biosciences) system, 5-ethynyl-2'-deoxyuridine (EdU, RiboBio, Guangzhou, Guangdong, China), and colony formation, Transwell, Matrigel, and wound healing assays were performed as previously described [32, 33]. DDP (P4394, Sigma, Saint Louis, MI, USA) was dissolved in DMSO.
2.8 Cell cycle assays and apoptosis analysis
A549 and PC9 cells were fixed in 75% cold ethanol and treated with the Cell Cycle Assay Kit (FMS-CCC02, FCMACS, Nanjing, Jiangsu, China) according to the manufacturer's instructions. Cells suspended in phosphate buffer saline (PBS) were stained with an Annexin V-Alexa Fluor 647/PI Apoptosis Assay Kit (FMSAV647-100, FCMACS). A flow cytometer (FACScan; BD Biosciences, Mountainview, CA, USA) equipped with CellQuest software was used to analyze the cell cycle and apoptosis.
2.9 Protein preparation, Western blotting, and immunofluorescence
Protein preparation, Western blotting, and immunofluorescence were performed according to standard protocols [34, 35]. The antibodies are listed in Supplementary Table S3.
2.10 Co-immunoprecipitation (Co-IP)
Co-IP assays were performed with 5 μg of mouse IgG antibody, KLF6 antibody, or polyclonal MND1 antibody followed by a rabbit IgG antibody using the Pierce Co-IP kit (Kit No. 26149, Thermo Scientific Pierce, Rockford, IL, USA) following the manufacturer's descriptions. The antibodies are listed in Supplementary Table S3. Each experiment was repeated thrice.
2.11 Cell transfection
Plasmid vectors (pcDNA3.1-MND1-Flag, pcDNA3.1-KLF6-HA, pcDNA3.1-E2F1, and an empty vector, RiboBio) for transfection were prepared using DNA Miniprep kits (Qiagen, Hilden, Germany). Cell lines were cultured on 6-well plates and treated using Lipofectamine 3000 (Invitrogen, Carlsbad, CA, USA) according to the manufacturer's protocol. The corresponding siRNA sequences are listed in Supplementary Table S4.
2.12 Chromatin immunoprecipitation (ChIP)
A549 and PC9 cells were preserved with formaldehyde and fixated for 10 min to produce DNA-protein cross-links. Then, cell lysates were sonicated to produce chromatin fragments of 200-400 bp, which were immunoprecipitated with HA-Tag (2 μg) or E2F1 (2 μg). IgG (Millipore, Billerica, MA, USA, 2 μg) was used as the control. Precipitated chromatin DNA was recovered and analyzed by PCR. The primers used for the promoters are listed in Supplementary Table S1. All experiments were repeated three times.
2.13 Luciferase reporter assay
E2F1 and MND1 promoters were expanded by PCR and cloned into the pEZX-FR03-basic luciferase vector (RiboBio). Using PCR-mediated mutagenesis, KLF6-binding motifs were removed from the E2F1 promoter vectors, and E2F1-binding motifs were removed from the MND1 promoter vectors. All vectors were verified by sequencing. Cells were harvested after transfection for 48 h, and luciferase assays were carried out using the dual-luciferase reporter assay system (Promega, Madison, WI, USA). Each experiment was repeated thrice.
2.14 Lentiviral shRNA transfection
Lentiviral (LV)-shNC and LV-shMND1 plasmids were prepared by Umibio (Shanghai, China). The short hairpin RNA (shRNA) sequences used to silence the corresponding genes were the same as siMND1 #2. A549/DDP cells were cultured in RPMI-1640 with 10% FBS and containing 1 μg/mL DDP to maintain DDP-resistant. For stable transfection, A549 and A549/DDP cells were cultured overnight. Then, the appropriate LV at the titer of 4 × 10⁶ transducing units (TU)/mL was added, incubated for 48 h, and then challenged by puromycin selection.
2.15 Animal study
Four-week-old BALB/c male nude mice were purchased from Beijing Vital River Laboratory Animal Technology (Beijing, China). All animals were maintained under specific pathogen-free conditions and manipulated according to the protocols approved by Nanjing Medical Experimental Animal Care Commission (Nanjing, Jiangsu, China). A549 cells and A549/DDP cells infected stably with LV-shNC or LV-shMND1 were harvested and subcutaneously implanted in nude mice as described elsewhere [35].
When tumors grew to 50 mm3, mice injected with A549/DDP cells stably infected with LV-shNC or LV-shMND1 were randomized to normal saline and DDP groups. DDP (3 mg/kg body weight) was administered by intraperitoneal injection once every two days. Twenty-eight days after injection, animals were euthanized, and nodules were harvested. Nodule volume and weight were measured to evaluate the effects of different treatments. IHC staining was performed to visualize Ki-67, MND1, and E2F1 protein expression.
2.16 Statistical analyses
Data are presented as the mean ± standard deviation (SD). SPSS Statistics 20 (IBM Corp., Armonk, NY, USA), GraphPad Prism 8.0 (GraphPad Software Inc., San Diego, CA, USA), Stata 12 (StataCorp LLC, College Station, TA, USA), and R software (version 3.5.1, http://www.r-project.org) were used to analyze data and plot graphs. Meta-analysis was performed with 8 GEO datasets and a TCGA cohort to evaluate the prognostic value of MND1 based on a fixed-effects model. Student's t-test, one-way Analysis of Variance (ANOVA), or Chi-square test was used to analyze differences. The overall survival (OS) was defined as the duration from the date of surgery to death of any reason. The Kaplan-Meier method was used to plot OS curves, and the log-rank test was used to evaluate survival differences. A Cox proportional hazards model (Forward LR) was used to assess the significance of each parameter for OS. P < 0.05 was considered statistically significant.
3 RESULTS
3.1 Correlation between MND1 expression and clinical characteristics of LUAD
We assessed the TCGA and GEO datasets to characterize the expression of mRNAs in LUAD tissues and adjacent normal tissues. A total of 356 significantly up-regulated genes were identified after overlapping 424 significantly up-regulated genes in GEO datasets and 3008 significantly up-regulated genes in TCGA datasets, as robust significantly up-regulated genes in LUAD (Figure 1A & Supplementary Table S5), among which MND1 attracted our attention given its novelty described in literature [16]. As shown in Figure 1B, MND1 was significantly up-regulated in LUAD compared to adjacent normal tissues in the integrated GEO datasets (P < 0.001) and TCGA (P < 0.001).
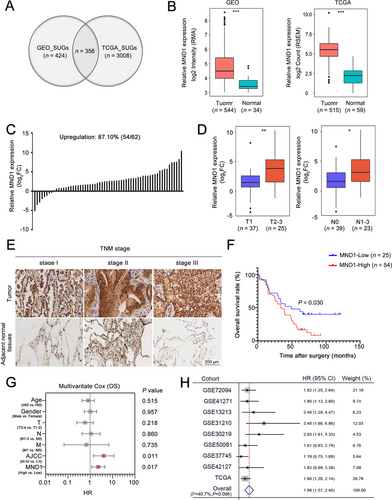
MND1 mRNA expression was further confirmed by qRT-PCR of 62 paired fresh tumor/normal tissues. MND1 was up-regulated in 54 (87.1%) LUAD tissues (Figure 1C). Patients with larger tumor size (T2-T3) and lymph node metastasis exhibited increased MND1 expression (P = 0.004 and P = 0.021, Figure 1D). MND1 protein levels were also evaluated using IHC in a LUAD TMA (after excluding missing data/dots, 79 tumor/normal pairs were included in further analysis). Increased expression of MND1 was observed in LUAD tissues compared with adjacent normal tissues (Figure 1E). Kaplan-Meier analysis showed that the LUAD patients with high MND1 expression (as determined by a cut-off score of the median) had worse OS than those with low MND1 expression (P = 0.030; Figure 1F). Multivariate Cox regression analysis revealed that high MND1 protein expression served as an independent risk factor for OS in LUAD [hazard ratio (HR) = 2.29, 95% confidence interval (CI) = 1.16-4.52, P = 0.017; Figure 1G]. Additionally, a meta-analysis performed based on 9 GEO datasets confirmed that LUAD patients with high levels of MND1 exhibited reduced OS (pooled HR = 1.99, 95% CI = 1.57-2.40, Figure 1H). These results indicate that up-regulated MND1 in LUAD is potentially oncogenic and is highly correlated with LUAD patient survival.
3.2 MND1 promotes the proliferation and migration of LUAD cell lines both in vitro and in vivo
MND1 mRNA and protein were highly expressed in LUAD cell lines compared with HBE cells. A549 and PC9 cells were chosen for further experiments given their relatively high expression (P < 0.001; Figure 2A). siMND1 #2 exhibited increased knockdown efficiency in both A549 and PC9 cells (Figure 2B). Cell proliferation was measured using the RTCA system and EdU and colony formation assays. These experiments showed that the proliferative ability was attenuated when MND1 was silenced in A549 and PC9 cells (Figure 2C-E). In addition, RTCA, Transwell, wound healing, and Matrigel assays also suggested that MND1 silencing inhibited the migratory and invasive abilities of LUAD cells (Supplementary Figure S1A-D). After verifying the overexpression efficiency (Figure 2F), exogenous overexpression of MND1 enhanced proliferation (Figure 2G-H) and colony formation (Figure 2I) as well as the migratory and invasive abilities of A549 and PC9 cells (Supplementary Figure S1E-H). Additionally, flow cytometry analysis indicated that MND1 silencing enhanced and MND1 overexpression reduced the apoptosis of LUAD cells (Supplementary Figure S1I).
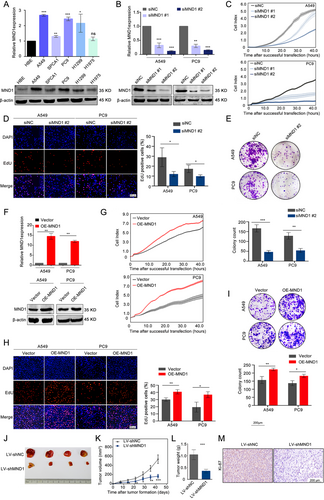
To investigate MND1 function in vivo, after estimating lentiviral shMND1 transfection efficiency (Supplementary Figure S2A-C), we constructed lentiviruses carrying shMND1 and shNC, and infected A549 cells were subcutaneously injected into nude mice. After 42 days, the mice were euthanized, with the tumor nodules harvested. As shown in Figure 2J-L, MND1 silencing inhibited the tumor growth in vivo. IHC analysis revealed remarkably reduced Ki67 staining in the LV-shMND1 group compared with the NC group (Figure 2M). The above data demonstrated that MND1 promotes the proliferation and migration of LUAD cells in vitro and in vivo.
3.3 MND1 regulates cell cycle progression by up-regulating E2F1 expression in LUAD cells
To further dissect the biological role of MND1 in LUAD, we performed WGCNA based on the RNA-seq data of 515 LUAD samples from TCGA. Using a power of β = 4 as the optimal soft threshold, a co-expression gene network was built and a total of 14 non-gray gene modules were generated (Figure 3A). Among these modules, the turquoise module, which depicted the highest correlation with MND1 (r = 0.56, P < 0.001), was considered the hub module of MND1 (Figure 3B). With a threshold of gene significance > 0.4, the hub genes extracted from the turquoise module were submitted for GO enrichment analysis. The enrichment results demonstrated that the main components were described as “Cell division” and “Cell cycle”, indicating that MND1 might exert its oncogenic role in cell cycle-related biological progression (Figure 3C). Additionally, MND1 mRNA expression was positively correlated with cell cycle progression in a total of 77 cells derived from a LUAD patient (r = 0.83, P < 0.001, Figure 3D).
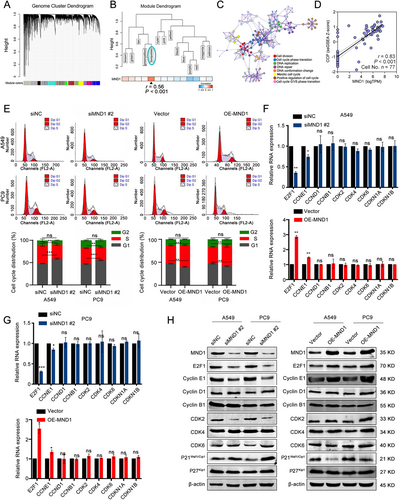
Flow cytometry analysis subsequently indicated that the proportion of LUAD cells in G1 phase was significantly increased when MND1 was silenced, and enforced overexpression of MND1 decreased the proportions of A549 and PC9 cells in G1 phase (Figure 3E). Conversely, silencing MND1 reduced the proportion of LUAD cells in S phase. Overexpression of MND1 up-regulated the proportion of LUAD cells in S phase. However, the proportion of LUAD cells in G2 phase was not affected after silencing or overexpressing MND1. Next, we further investigated the mRNA and protein levels of 9 critical genes, including E2F transcription factor 1 (E2F1), Cyclin E1 (CCNE1), Cyclin D1 (CCND1), Cyclin B1 (CCNB1), Cyclin-dependent kinase 2 (CDK2), Cyclin-dependent kinase 4 (CDK4), Cyclin-dependent kinase 6 (CDK6), Cyclin-dependent kinase inhibitor 1A (CDKN1A), and Cyclin-dependent kinase inhibitor 1B (CDKN1B), which are involved in G1 phase and G1/S transition when manipulating MND1 expression. We found E2F1 has the most pronounced change in both A549 and PC9 cells (Figure 3F-H). E2F1 promotes G1/S transition by activating the transcription of cyclin E1 [36], and cyclin E1 interacts with CDK2, a key marker for the G1/S checkpoint, to form a complex that promotes the G1/S transition [37]. As shown in Figure 3H, the protein levels of E2F1, cyclin E, and CDK2 increased, whereas P21 decreased, indicating that G1/S phase progression was activated. Therefore, we assume that MND1 might regulate G1/S cell cycle progression via up-regulating E2F1 expression.
3.4 MND1 activates E2F1 transcription by competitively binding to KLF6
Given that MND1 is not considered a transcription factor, we assumed that it might affect E2F1 expression by binding with other proteins. We therefore performed mass spectrometry and found that the transcription factor KLF6 might bind to MND1 (Figure 4A). Furthermore, immunofluorescence staining revealed the co-localization of MND1 and KLF6 in the cellular nucleus (Figure 4B). Co-IP experiments also proved the direct binding of both endogenous and exogenous MND1 with KLF6 (Figure 4C & Supplementary Figure S2D). Considering that KLF6 was previously reported as a negative regulator of E2F1 transcription by binding to the specific site (-485/-468) in the E2F1 promoter region [34], we hypothesized that MND1 competitively binds to KLF6 and relieves the transcriptional repression of E2F1.
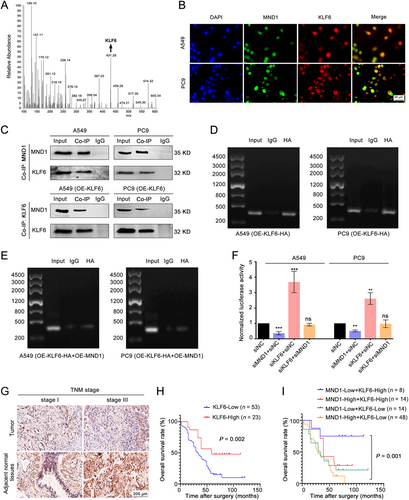
To investigate how MND1 and KLF6 proteins affect E2F1 transcription, we performed ChIP and ChIP-PCR assays. KLF6 directly interacted with E2F1 by binding to a specific site in the promoter (-485/-468) (Figure 4D). We found that the binding of KLF6 to the E2F1 promoter was diminished by MND1 overexpression, whereas exogenous overexpression of KLF6 rescued its binding to the E2F1 promoter (Figure 4E). A dual-luciferase reporter system constructing E2F1 full-length promoter (−2000 to +0 nt) was used to further clarify the relationship among MND1, KLF6, and E2F1. As shown in Figure 4F, silencing MND1 inhibited luciferase activity, whereas silencing KLF6 enhanced it. Silencing MND1 partially rescued the siKLF6-induced E2F1 transcription activation. These data suggested that KLF6 suppressed E2F1 transcription and MND1 alleviated this effect by competitively binding to KLF6.
We then detected KLF6 expression in LUAD samples. qRT-PCR and IHC staining assays showed that KLF6 was significantly down-regulated in most LUAD tissues (Supplementary Figure S3A-B, Figure 4G), and patients with high KLF6 levels exhibited better prognosis (Figure 4H). Combined with MND1 staining results, we observed that patients with both low MND1 and high KLF6 expression exhibited the best prognosis among all subgroups (Figure 4I), indicating the synergistic regulation of MND1 and KLF6 in LUAD progression.
3.5 MND1 promotes LUAD cell proliferation via KLF6-mediated regulation of E2F1
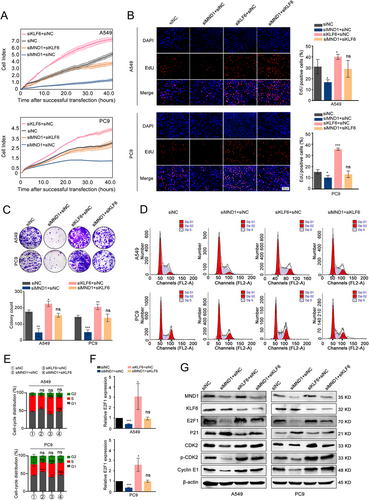
To determine whether the proliferative role of MND1 depends on the KLF6-mediated regulation of E2F1, we performed rescue experiments. The knockdown efficiency of two designed siRNAs was measured in both A549 and PC9 cell lines, and siKLF6 #2 was chosen for further study (Supplementary Figure S3C-D). As demonstrated by RTCA, EdU, and colony formation assays, siKLF6 rescued the antiproliferation effect induced by MND1 knockdown (Figure 5A-C). In addition, flow cytometry assays showed that siKLF6 could partially relieve the increase of the proportions in G1 phase caused by MND1 knockdown (Figure 5D-E). Phospho-CDK2 (Thr160) activity is maximal during S phase and is induced by interaction with cyclin E during the early stages of DNA synthesis to permit the G1/S transition [38]. We further observed that KLF6 silencing increased E2F1 expression and influenced its downstream targets in the G1 phase in LUAD cells (Figure 5F-G).
3.6 E2F1 transcriptionally activates MND1 to create a positive feedback loop
GSEA predicted that MND1 might play a role in the ‘E2F-targets’ signaling pathway based on a single-cell RNA-seq dataset (Figure 6A). A positive correlation between MND1 and E2F1 was also noted in both TCGA tissues and the CCLE cell lines (Figure 6B). ChIP-seq results from the ENCODE database revealed that E2F1 was enriched in the MND1 promoter region of the 4 analyzed cell lines (Figure 6C). qRT-PCR and Western blotting showed that silencing of E2F1 down-regulated MND1 expression, whereas overexpression of E2F1 up-regulated MND1 in both A549 and PC9 cells (Figure 6D-E). Then, the JASPAR database was used to predict the E2F1-binding site sequences in the MND1 promoter, and putative E2F1-binding sites in the MND1 promoter were located +1 to +12 bp upstream and −269 to −258 bp downstream of the transcription start site. Based on these results, our hypothesis was that E2F1 might transcriptionally activate MND1.
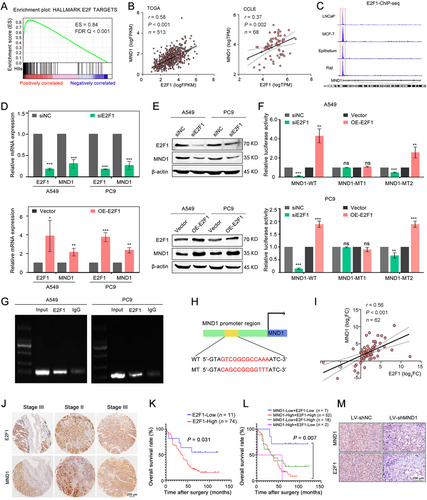
To verify whether E2F1 could bind to the predicted sites in the MND1 promoter, we performed a dual-luciferase reporter assay and cloned 3 luciferase reporter constructs: pGL3-MND1 wild-type, including the MND1 full-length promoter (−1948 to +51 nt); pGL3-MND1 mutation 1 [GTCGGCGCCAAA (+1/+12) was replaced with CAGCCGCGGTTT]; and pGL3-MND1 mutation 2 [TGCGGCGCCAAG (-269/-258) was replaced with ACGCCGCGGTTC]. E2F1 silencing efficiently inhibited the luciferase activity of the wild-type group and mutation 2 group compared with the negative control group, but no significant change was observed in the mutation 1 group in LUAD cells. Accordingly, overexpression of E2F1 significantly enhanced the luciferase activity in the wild-type group and mutation 2 group, but no significant change was noted when the other binding site of E2F1 was mutated (Figure 6F). We further performed ChIP assays to validate the physical interaction between E2F1 and the MND1 promoter region. Primers were designed to capture the precipitated DNA fragment. The DNA fragment containing the E2F1-binding site (+1/+12) was significantly enriched in the chromatin that was precipitated with an antibody against E2F1 (Figure 6G). Figure 6H depicts the nucleotide sequences of the E2F1-binding site in the MND1 promoter.
3.7 MND1 expression is positively correlated with E2F1 in LUAD tissues
The positive correlation between MND1 and E2F1 was validated in 62 LUAD samples using qRT-PCR (r = 0.56, P < 0.001; Figure 6I). Similarly, MND1 protein expression was positively correlated with E2F1 based on IHC staining in TMA (Figure 6J, Supplementary Figure S3E). Moreover, patients with higher E2F1 levels displayed worse OS (Figure 6K). When combined with the MND1 staining results, the subgroup with high MND1 and E2F1 expression exhibited the worst prognosis among all subgroups (Figure 6L). In addition, IHC results of in vivo mice models revealed that the nodules derived from LV-shMND1 cells exhibited markedly reduced E2F1 staining compared with the negative control group (Figure 6M).
3.8 MND1 targeting re-sensitizes DDP-resistant LUAD cells to DDP
Cell cycle alteration potentially leads to drug resistance [39] and G1/S cell cycle transition in particular, which promotes DDP resistance in cancer cells [40]. Considering that MND1 plays a critical role in cell cycle in LUAD, we sought to explore whether MND1 could confer DDP resistance. As expected, the results of the proliferation assay showed that siMND1 promoted the cytotoxic effects of DDP (2 μg/mL) [40] in A549 cells (Supplementary Figure S4A-B), while overexpression of MND1 invalidated the cytotoxic effect of DDP (Supplementary Figure S4C-D). Our data indicated that targeting MND1 could have underlying value in tackling DDP resistance. RTCA system analysis and colony formation assays were performed in A549/DDP cells to evaluate the cytotoxic effect of combined siMND1 and DDP treatment (5 μg/mL). Compared with the negative control or DDP treatment alone, siMND1 plus DDP treatment showed the most powerful inhibitory effects on cell proliferation and colony formation (Figure 7A-B). Further, A549/DDP cells stably infected with LV-shMND1 or shNC were subcutaneously injected into BALB/c nude mice to establish a tumor xenograft model. After intraperitoneal injection of DDP or normal saline, the responses to the treatments in each group were significantly different. Compared to other groups, the nodules in the LV-shMND1 plus DDP group exhibited the slowest growth and eventually the smallest size (Figure 7C-E). Moreover, IHC analysis confirmed that the MND1 silencing group exhibited remarkably fewer Ki-67-, MND1-, and E2F1-positive cells compared with the control group (Figure 7F).
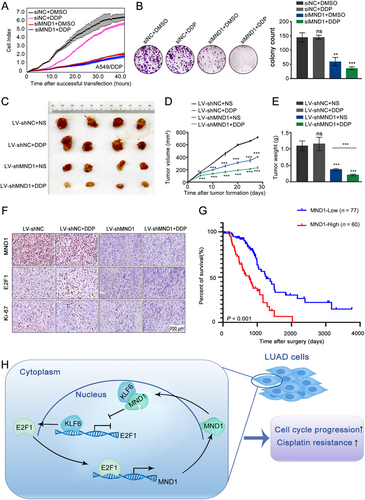
Additionally, data from 137 LUAD patients who received adjuvant therapies, including additional chemotherapy or/and radiotherapy, were extracted from TCGA. Kaplan-Meier analysis revealed that patients with higher MND1 expression had worse overall survival, suggesting that MND1 up-regulation might confer therapeutic resistance to LUAD during clinical treatments (P < 0.001, Figure 7G).
4 DISCUSSION
As shown in Figure 7H, our study provides evidence supporting the hypothesis that up-regulation of MND1 is significantly associated with short survival of LUAD patients. Moreover, we presented evidence that MND1 up-regulates E2F1 expression by directly binding to the tumor suppressor KLF6. Interestingly, E2F1 can also transcriptionally activate MND1 by binding to the MND1 promoter region. These findings demonstrated that E2F1, MND1, and KLF6 form a positive feedback loop and promote malignant progression and induce therapeutic resistance in LUAD by regulating cell cycle. Our study provided a potiential prognostic biomarker and drugable target for LUAD patients.
A previous study has revealed that MND1 was up-regulated in LUAD[16], but the role of MND1 in LUAD was still unknown. Our study has clarified the function and mechanisms of MND1 in LUAD. Both qPCR and TMA assays showed that MND1 expression was significantly increased in LUAD tissues and positively associated with the poor survival of patients with LUAD. Thus, MND1 could be a strong predictor of LUAD prognosis. Cell function and flow cytometry assays indicated that MND1 promoted LUAD cell proliferation in a cell-cycle-dependent manner and induced invasion and migration of LUAD cells. We also found that MND1 promoted LUAD cells proliferation in vivo. However, we had not addressed whether MND1 promotes LUAD cells migration and invasion in vivo. To further investigate this regulatory mechanism, qPCR and western blot assays identified that E2F1 was remarkable alterations after silencing or overexpression of MND1. Considering the powerful role of E2F1 as a key transcriptional engine to promote cell cycle progression and cell proliferation, we assumed that MND1 might exert its proliferation-promoting role in an E2F1-dependent manner.
Considering that MND1 is expressed in the cellular nucleus and it is not a transcription factor, we speculated that MND1 might impact E2F1 expression through binding with other proteins. Co-IP and mass spectrometric analysis was therefore undertaken to screen the putative binding proteins of MND1 and confirmed the interaction of MND1 and KLF6. KLF6, which belongs to a group of transcription factors [41-44], garnered our attention given its high abundance among all the candidates. KLF6 plays a pivotal role in regulating cell development, differentiation, proliferation, and apoptosis [44, 45], and its down-regulation reportedly induces apoptosis in NSCLC [46]. Gao et al. [34] found that KLF6 inhibited renal cancer progression via transcriptional repression of E2F1. In this current study, ChIP and dual-luciferase reporter assays revealed that KLF6 suppressed E2F1 transcription by binding to its promoter region. The results of the current study is consistent with the previous research. Then, rescue experiments showed that MND1 exerted its proliferative function by relieving KLF6-induced suppression of E2F1 transcription. Interestingly, we observed that E2F1 could reciprocally influence MND1 expression as a positive regulator. Luciferase reporter and ChIP assays revealed that E2F1 directly bound to a specific site in the MND1 promoter and activated MND1 transcription. Briefly, MND1 acts as a trigger, whereas E2F1 acts as an engine in this positive feedback loop, regulating cell cycle in LUAD. Our results might reflect a positive feedback loop mechanism between MND1 and E2F1, which amplified their malignant functions in LUAD.
Dysregulation of cell cycle-associated proteins is linked with DDP resistance in human lung cancer cells [47]. DDP-based therapy is the major chemotherapy for advanced LUAD. However, most advanced LUAD patients eventually develop DDP resistance, which severely affects patient outcomes. It is necessary to find alternative molecular targets to overcome DDP resistance. In this study, we discovered that MND1 invalidated the cytotoxic effect of DDP in LUAD cells. A tumor burden/DDP treatment model was constructed to determine whether MND1 targeting re-sensitizes A549/DDP cells to DDP. Silencing of MND1 along with down-regulation of E2F1 conferred sensitivity to DDP treatment compared to the negative control group. In addition, among TCGA LUAD patients who received radio(chemo)therapy, those with increased MND1 expression presented with worse OS compared with patients in the lower MND1 group. These results suggest that, as a potential target in tackling DDP resistance, MND1 provides new insight into DDP resistance. Koncdown of MND1 may be of some value in a new scheme for reversing cisplatin resistance in LUAD.
However, there were some limitations in the current study. Firstly, we did not address whether MND1 accelerates the G1/S transition. A live imaging analysis of cell cycle dynamics using FUCCI staining might better help us understand how MND1 affects the cell cycle progression (shortening or lengthening of cell cycle phases) in LUAD. Secondly, we did not identify the precise binding region for MND1 with KLF6 which might be useful for targeting drug design. We might further address these issues in our future studies.
5 CONCLUSIONS
In conclusion, this study reports the oncogenic role of MND1 and describes a positive feedback loop involving MND1, KLF6, and E2F1 in LUAD. These findings may offer insight into LUAD progression and exhibit therapeutic potential.
DECLARATIONS
ETHICS APPROVAL AND CONSENT TO PARTICIPATE
The present study was approved by the Ethics Committee of the Nanjing Medical University Affiliated Cancer Hospital and was performed in accordance with the provisions of the Ethics Committee of Nanjing Medical University.
CONSENT FOR PUBLICATION
Informed consents were received from patients who participated in this study.
COMPETING INTERESTS
The authors have declared that no competing interest exists.
FUNDING
This work was supported by the National Natural Science Foundation of China (81672295, 81872378, 81702265, and 81802277), China Postdoctoral Science Foundation (2018M640465), Social Development Project of Jiangsu Province (BE2019758), Research Program of Jiangsu Health Department (LGY2016025), and Project of Jiangsu Provincial Medical Talent (ZDRCA2016033).
AUTHORS' CONTRIBUTIONS
RY and GRZ conceived of the study and QLZ carried out its design. QLZ, RS, YKB, and LJM performed the experiments. JWH, HYZ and SWW collected clinical samples. QLZ, RS, TYL, and XMD analyzed the data and wrote the paper. RY, GRZ, WJ, and LX revised the paper. All authors read and approved the final manuscript.
Open Research
DATA AVAILABILITY STATEMENT
Data supporting the findings of this study are available within the article and its supplementary information files.


