VMD-FBCCA classification method for SSVEP brain–computer interfaces
Abstract
A steady-state visually evoked potential (SSVEP) is a brain response to specific frequencies of visual stimuli, including their harmonic frequencies. However, this signal is susceptible to interference from spontaneous and rhythms in electroencephalography (EEG) signals because they overlap from 8 to 40 Hz. This can reduce the recognition accuracy of SSVEP brain–computer interfaces (BCIs). To address this problem, a variational mode decomposition–based filter bank canonical correlation analysis (VMD-FBCCA) algorithm is proposed, which integrates the adaptive characteristics of VMD and the training-free nature of the FBCCA algorithm. First, the EEG signal of each channel is transformed into intrinsic mode functions (IMFs) by the VMD algorithm, which extracts frequency components of the SSVEP from each IMF. Next, a particle swarm algorithm is employed to optimize the weights of the IMFs and reconstruct the EEG signals. This reconstruction selectively enhances the IMFs in the target SSVEP frequency band while suppressing interference from other bands. Finally, the reconstructed EEG is classified using FBCCA to decode the SSVEP-BCI signal. To evaluate its effectiveness, the proposed algorithm is tested on datasets from the BCI Competition. The results demonstrate that VMD-FBCCA outperforms FBCCA, showing improvements in both the average recognition accuracy and information transmission rate (8.91 bits/min). Moreover, the best recognition accuracy achieved for individual subjects is enhanced by .
Key points
What is already known about this topic?
-
Steady-state visual evoked potential (SSVEP) is a popular brain–computer interface (BCI) paradigm with a high information transfer rate and minimal training requirements. There are many recognition algorithms for SSVEPs. However, the intrinsic mode function (IMF) components obtained by variational mode decomposition include interference from spontaneous electroencephalography (EEG) signals, which affects the recognition accuracy of SSVEP BCIs.
What does this study add?
-
To distinguish spontaneous EEG signals and target SSVEP rhythm signals, this study optimizes the weights of IMFs using a particle swarm optimization (PSO) algorithm. This improves the recognition accuracy of SSVEP signals. PSO is employed to find the best IMF weights to ensure that those of SSVEP target rhythms are larger, mitigating the problem of SSVEP and spontaneous EEG signals overlapping within the frequency coverage range.
Abbreviations
-
- BCI
-
- brain-computer interface
-
- EEG
-
- electroencephalography
-
- SSVEP
-
- steady-state visual evoked potential
-
- VMD-FBCCA
-
- variational mode decomposition-based filter bank canonical correlation analysis
1 INTRODUCTION
Brain–computer interfaces (BCIs) are revolutionary human–computer interaction systems that enable users to control external devices directly with their thoughts, bypassing the traditional pathways of peripheral nerves and muscles. BCIs work by recording brain activity, such as electroencephalography (EEG) signals, and then translating them into commands that can be sent to an external device.1 BCIs have been widely used in military applications, medical rehabilitation, and assisting older and disabled people, and a great deal of research progress has been made.
Steady-state visual evoked potential (SSVEP) is a popular BCI paradigm with a high information transfer rate and minimal training requirements.2-4 It refers to the brain's response to visual stimuli that flicker at a constant frequency. The response EEG signal is consistent with the stimulation frequency or its harmonics.5 An SSVEP-based BCI needs to recognize the target frequency to decode the user's intention. There are many SSVEP recognition algorithms, including multivariate synchronization index (MSI) and canonical correlation analysis (CCA) approaches. CCA-based algorithms are widely used because no training is required.
CCA6 finds the maximum correlation between EEG and reference signals to identify the SSVEP target frequency. It can achieve a higher recognition accuracy than MSI algorithms and other classifiers for power spectral density (PSD) features. However, CCA is only effective at extracting information from the base frequency, not from the harmonic frequencies. To solve this problem, a filter bank CCA (FBCCA) algorithm7 has been proposed, which combines fundamental and harmonic frequency components to improve the identification accuracy of EEG signals. This algorithm decomposes the EEG signal into multiple sub-bands through a filter bank; it then uses CCA to find the maximum correlation between each sub-band component of the EEG and reference signals to identify the SSVEP target frequency. FBCCA improves recognition accuracy and is more effective than earlier CCA algorithms.
In addition, CCA-based algorithms need signal preprocessing to remove noise artifacts in EEG signals, which may be caused by eye or muscle motion, before feature extraction. However, standard preprocessing algorithms cannot effectively remove the noise in EEG signals. Ge8 proposed a decoding algorithm based on FBCCA and beamforming, which enables high-precision algorithms without training for the research of SSVEP-BCI systems.9-11 The performance of these improved algorithms is better than that of CCA, but only traditional filters are used in noise artifact removal, proving insufficiently effective.
The recognition accuracy of FBCCA not only depends on the reference signal but also on clear EEG data without noise artifacts. Therefore, the question of how to efficiently remove noise artifacts in EEG signals is important.12 Empirical mode decomposition (EMD) is a highly efficient denoising algorithm,13 that decomposes complicated data into a small number of intrinsic mode functions (IMFs) for noise elimination. These IMFs provide time-dependent instantaneous frequencies, aiding in precise structure identification. A major drawback of EMD is mode mixing, which causes aliasing in the time–frequency distribution. The ensemble EMD algorithm14, 15 addresses mode mixing in EMD by leveraging its scale separation ability. Adding finite noise ensures proper segregation of different-scale signals into distinct IMFs.
However, EMD algorithms are limited to the analysis of empirical modes and have difficulty in determining endpoint effects and stopping conditions. A fully non-recursive variational mode decomposition (VMD) has been proposed16 that incorporates the signal into a variational model and leverages an optimized constrained version to achieve decomposition, resulting in more stationary sub-signals.17, 18 Because the secondary penalty factor in VMD can improve convergence and remove noise in decomposed modes, this algorithm can be used to remove visual and ECG artifacts19, 20 in EEG signals. However, the IMF components obtained by VMD have frequency overlap between the SSVEP and the spontaneous EEG signal, which affects the recognition accuracy of SSVEP BCIs.21-23
To distinguish between spontaneous EEG signals and target SSVEP rhythm signals, the main idea of this paper is to optimize the weights of IMFs using a PSO algorithm.24 Increasing the weights of the target SSVEP rhythm signal and reducing the weights of the spontaneous EEG signal ensures that the target SSVEP rhythm is strengthened in the reconstructed EEG to improve the recognition accuracy of SSVEP BCIs.
-
Variational mode decomposition–based filter bank canonical correlation analysis (VMD-FBCCA) is proposed, an algorithm that combines the adaptability of VMD and the training-free advantages of FBCCA algorithms. It reconstructs the modes containing the main signals to remove noise artifacts from EEG signals effectively. By extracting useful information from harmonic frequency components, this method improves the recognition accuracy of SSVEP signals.
-
PSO is employed to find the best IMF weights to ensure that the weights of SSVEP target rhythms are larger and those of spontaneous EEG activity are smaller. It mitigates the problem of overlap between SSVEPs and spontaneous EEG signals within the frequency coverage range.
The remainder of the paper is structured as follows: Section 2 reviews related work on CCA and FBCCA. Section 3 introduces VMD, PSO, and the VMD-FBCCA algorithm. Section 4 presents the experimental results, and Section 5 discusses them. Section 6 concludes the paper.
2 RELATED WORKS
2.1 Canonical correlation analysis
To identify the target frequency of the SSVEP, CCA determines the canonical correlation between the SSVEP and reference signals across various stimulation frequencies. The frequency corresponding to the highest correlation is designated as the target frequency.
2.2 Filter bank CCA
3 VMD-BASED FBCCA
3.1 Variational mode decomposition
Algorithm 2. VMD
As can be seen from the above discussion, the VMD algorithm involves solving a constrained variational problem, using mathematical tools such as quadratic penalty terms, Lagrange multipliers, and augmented Lagrange functions, to find the optimal IMFs that satisfy the bandwidth and reconstruction constraints. It updates the IMFs and their center frequencies iteratively until a convergence criterion is met, such as a small change in the IMFs or center frequencies between iterations. In the presence of overlapping frequencies, the key advantage of the VMD algorithm is its variational principle, which allows the algorithm to consider the local characteristics of the signal during the decomposition process. By optimizing the bandwidth and center frequency of each IMF, the VMD algorithm can adaptively separate signal components corresponding to specific SSVEP frequencies.
Because the IMF components decomposed by the VMD are still only components of the original SSVEP signal, and there is still a problem of frequency coverage overlap between it and spontaneous EEG signals, such as waves (8–12 Hz), it needs to optimize the IMF weights to weaken the IMF components with interference bands. In this paper, the PSO algorithm is employed to complete the optimization process.
3.2 Particle swarm optimization
PSO is a random population algorithm inspired by the intelligent swarming behavior of birds.26, 27 It is straightforward to implement, requires little parameter adjustment, and can achieve rapid convergence.28
3.3 VMD-based FBCCA
The framework of the VMD-FBCCA algorithm is illustrated in Figure 1. It has two core modules, VMD and FBCCA. The EEG signal is first decomposed by the VMD algorithm and then reconstructed with the optimal weight obtained by PSO. The FBCCA core module extracts features from the fundamental and harmonic frequencies in the reconstructed EEG signal, achieving classification of SSVEP signals; for more details, refer to Ref. [7].
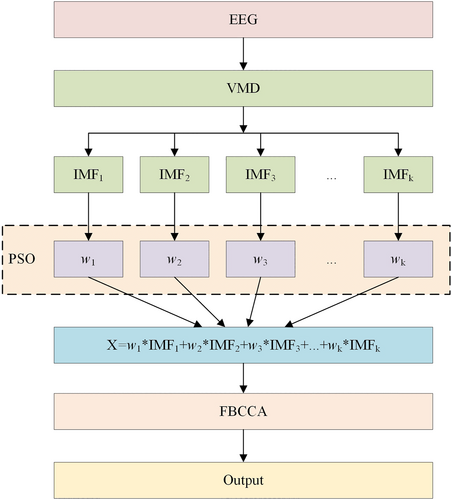
Framework of VMD-FBCCA. VMD-FBCCA, variational mode decomposition–based filter bank canonical correlation analysis.
Algorithm 3. Training phase of VMD-FBCCA
-
Input: , , , ,
-
Output:
-
1: , ;
-
2: Initialize , ;
-
3: Decompose EEG into IMFs by VMD as shown in 3.1:
-
4: ;
-
5: while the stopping criterion is not met do
-
6: for m = 1:M do
-
7: ;
-
8: = FBCCA, as shown in algorithm 1;
-
9: Compute classification error rate ;
-
10: if then
-
11: , ;
-
12: end if
-
13: if then
-
14: , ;
-
15: end if
-
16: end for
-
17: for m = 1:M do
-
18: ;
-
19: ;
-
20: end for
-
21: ;
-
22: t = t + 1
-
23: end while
-
The VMD algorithm is used to decompose the EEG of each channel into IMFs of different frequency bands.
-
The EEG is reconstructed with the best weight obtained by PSO during the training phase. The weighted sum of IMF components is calculated according to Equation (14).
-
Using FBCCA to classify the reconstruct EEG signal.
This VMD-FBCCA algorithm combines the adaptive VMD and training-free FBCCA algorithms. It reconstructs the modes containing the main signals to remove noise artifacts from EEG signals effectively and extracts the useful information embedded in the harmonic frequency components to improve the recognition accuracy of SSVEP signals. In addition, the PSO algorithm, which is easy to implement and converges rapidly, is used to optimize the weights of IMFs in different frequency bands to better distinguish SSVEPs from spontaneous EEG signals and improve the recognition accuracy of SSVEPs.
4 EXPERIMENTS AND RESULTS
4.1 Experimental datasets
The experimental dataset is derived from the BCI Controlled Robot Contest held during the World Robot Contest in 2021.29 The paradigm of the dataset is SSVEP-based multi-target keyboard spelling, with 40 stimulation targets. The stimulation frequency is from 8 to 15.8 Hz, with an interval of 0.2 Hz, and the phase difference between adjacent frequencies is 0.5. This dataset was recorded from 12 healthy subjects using eight electrodes: POz, PO3, PO4, PO5, PO6, Oz, O1, and O2. For each subject, there are three training blocks and three test blocks, and each block has 40 trials. Because noise and artifacts influence signal recognition, the original EEGs were filtered through a 6–100 Hz bandpass filter and a 50 Hz notch filter to eliminate noise caused by equipment, alternating current, and ocular artifacts.
4.2 Parameters setting
The decomposition level is an important parameter affecting the decomposition performance of VMD. If is too small, this will lead to insufficient decomposition of EEG signals. If it is too large, the frequencies will overlap, and more computation time will be required. In either case, the reconstruction of EEG signals will be negatively affected. In this work, was set to 5.
For a constant decomposition level , the bandwidth of a component yielded by the decomposition is inversely proportional to the penalty factor , If is too large, this will cause the reconstructed signal to lose some of the information from the original signal. If it is too small, spectral mixing and overlapping between adjacent modes will occur. In this paper, , the fidelity coefficient , and the stop condition .
4.3 IMF weight results after PSO optimization
The PSO algorithm optimizes the weight parameters using the training data from each subject (228 trials) to minimize the value of the fitness function. Figure 2 shows iteration diagrams for the fitness value of the PSO-optimized weight of the 12 subjects.
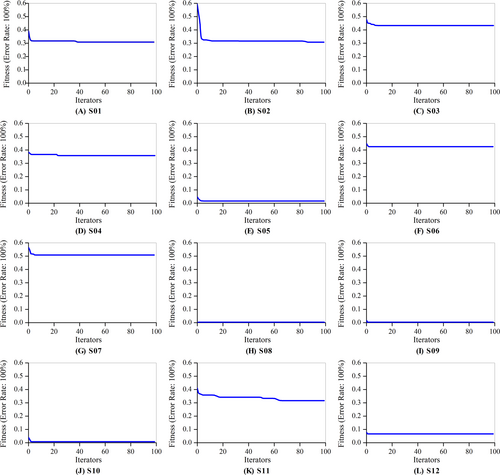
Parameter optimization iteration diagrams for 12 subjects.
It can be seen that the fitness value (error rate) in each of the 12 diagrams gradually decreases over the course of the iterations and converges to a stable value. Among them, S02, S03, and S11 show a clear decrease in error during the convergence process. The error reduction of S01, S04, S05, S06, S07, and S10 is relatively small, whereas in the remaining cases, S08, S09, and S12, the error decreases only marginally. Overall, this means that the PSO algorithm exhibits a fast convergence speed and achieves a degree of error reduction.
When the SSVEP signal is decomposed into variational modes, the number of IMF components needs to be defined in advance. For a given value, it is necessary to randomly select the initial weight value within the limit condition range, and then the PSO algorithm determines the fitness value of each particle according to the fitness function and aggregates each particle to the individual optimal weight and global optimal weight of the particle with the best fitness value. The process is iterated under the finite cycle condition, updating the particle weight and speed, reducing the fitness value as much as possible, and finding the optimal solution.
In this study, 60 (12 subjects 5 intrinsic modals) weights were optimized using the PSO algorithm. The optimized weights are shown in Figure 3; the darker the color, the greater the weight. It can be seen that all weights for S03 and S06 are >4.0, whereas all weights for S05, S07, S08, S09, S10, S11, and S12 are >0. Some weights for S01, S02, and S04 are positive and others negative. This illustrates the variability of SSVEP signals between different subjects.
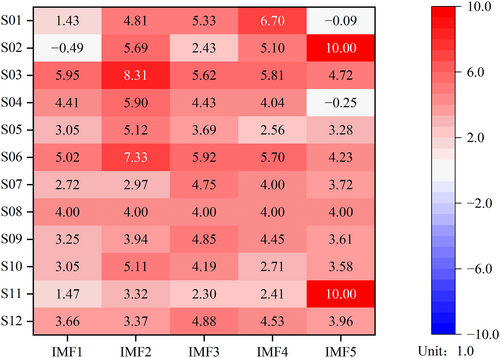
Weights obtained after optimization for 12 subjects.
Two points should be noted here. First, the negative weights, as seen with S02's IMF1 and S01's IMF5, imply that these IMFs have a negative impact on the results and need to be suppressed. This is analogous to the suppression of a 50 Hz power frequency interference with a notch filter. Second, some extreme values are obtained, such as 10.0 for S02's IMF5. Because the PSO optimization process relies on the fitness function to adjust the optimization direction, the adjusted parameters may not be physically meaningful. Thus, although increasing the IMF5 weights improved the SSVEP recognition performance, there may be differences in physical understanding. Therefore, we have limited the range of weights to within 10 and do not allow them to be increased further to prevent possible deterioration.
Except for the extreme value, the weights for IMF1, IMF2, and IMF3 are relatively large, meaning that the features of IMFs at medium and low frequencies (4–30 Hz) are related to the high recognition accuracy. This also verifies the difference between SSVEP signals in different frequency bands.
4.4 Comparison of VMD-FBCCA results with other methods
This subsection compares the SSVEP recognition accuracy and ITR of the VMD-FBCCA, FBCCA, EMD-CCA, and ensemble empirical mode decomposition (EEMD)-CCA algorithms on the same dataset. In the experiment, the reference signal harmonic number of FBCCA was set to 5, and the weight parameters and were set to 1 and 0.96, respectively. The parameter decomposition mode number for EMD-CCA and EEMD-CCA was set to 5. Table 1 presents the recognition accuracy of the four algorithms across the 12 subjects, and in each row, the bold value is the best one among the results of four algorithms. Figure 4A shows the ITR results in a bar chart.
| Subjects | FBCCA | EMD-CCA | EEMD-CCA | VMD-FBCCA |
|---|---|---|---|---|
| S01 | 49.17 | 55.83 | 61.25 | 69.17 |
| S02 | 40.00 | 41.67 | 45.74 | 69.17 |
| S03 | 55.83 | 55.83 | 57.45 | 56.67 |
| S04 | 63.33 | 63.33 | 63.33 | 64.17 |
| S05 | 94.17 | 94.17 | 94.17 | 98.33 |
| S06 | 53.33 | 53.33 | 54.53 | 57.50 |
| S07 | 42.50 | 43.33 | 45.50 | 49.17 |
| S08 | 100.00 | 100.00 | 100.00 | 100.00 |
| S09 | 99.17 | 99.17 | 99.17 | 100.00 |
| S10 | 97.50 | 98.33 | 98.87 | 99.17 |
| S11 | 58.33 | 61.23 | 63.33 | 68.33 |
| S12 | 91.67 | 91.67 | 92.32 | 93.33 |
| AVG | 70.42 | 71.49 | 72.97 | 77.08 |
| STD | 23.95 | 23.15 | 21.98 | 19.54 |
- Abbreviations: EMD-CCA, ensemble EMD-CCA; EMD-CCA, empirical mode decomposition-canonical correlation analysis; VMD-FBCCA, variational mode decomposition–based filter bank canonical correlation analysis.
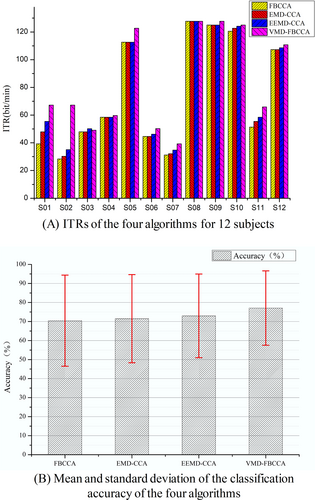
Comparison of the results of four algorithms.
Due to the high accuracy of S05, S08, S09, S10, and S12 in FBCCA, the accuracy of VMD-FBCCA did not change substantially, remaining between 90% and 100%. However, the optimization effects were more significant for S01, S02, and S11, for which the accuracy increased by 20%, 29.17%, and 10%, respectively. In addition, for S06 and S07, the accuracy increased by 4.17% and 6.67%, respectively. The optimization effect for S03 and S04 was not significant, which may be related to the subject's state in the experiment or a poor response to SSVEP.
Except for S03, the accuracy of VMD-FBCCA is higher than that of EEMD-CCA in all subjects. Moreover, the average recognition accuracy and ITR of the VMD-FBCCA algorithm are higher than for the other three methods. Especially compared with the FBCCA algorithm, VMD-FBCCA achieved a substantial improvement, with an average accuracy improvement of . For S02, the accuracy improved by , with an average ITR improvement of 9.86 bits/min. Thus, the VMD-FBCCA algorithm is both accurate and efficient.
Perfect scores of 100.00 were obtained for subjects S08, S09, and S10 by multiple algorithms. This is because these subjects had strong EEG signals with pronounced SSVEP responses that are easy to recognize. These results indicate the great variability in the difficulty of recognizing SSVEP responses between different subjects.
To avoid generalizing individual results, we conducted statistical analysis on the results of 12 subjects for all four algorithms, and we calculated the average classification accuracy and standard deviation. In Table 1, the “AVG” is the average classification accuracy, and “STD” means standard deviation. They are shown in Figure 4B, in which the bar represents the average accuracy and the T-line is the standard deviation. It can be seen that the average classification accuracies of FBCCA, EMD-CCA, EEMD-CCA, and VMD-FBCCA are , , , and respectively. The corresponding standard deviations are , , , and , respectively. The average classification accuracy of VMD-FBCCA is higher than those of the other three algorithms, and its standard deviation is also smaller than theirs. Therefore, it can be deduced that the VMD-FBCCA algorithm is superior in performance to the other three algorithms.
5 DISCUSSION
5.1 VMD-FBCCA performance
The VMD-FBCCA algorithm for decoding SSVEP signals can be understood as a process of decomposition, denoising, weight optimization, and reconstruction analysis of EEG signals. The EEG signal decomposition based on VMD uses a variational optimization method to determine the center frequency and bandwidth of the EEG signal in each channel. This method can easily obtain an adaptive narrowband IMF component, addressing challenges like end effects and modal component aliasing that can arise in methods like EMD. VMD effectively decomposes signals into multiple, relatively stable subsequences with varying frequency bandwidths.
Here, the bandpass filtering and the VMD algorithm need to be addressed. The bandpass filtering commonly used in general preprocessing has stable amplitude–frequency characteristics inside and outside the pass band. However, there is a long transition band where SSVEP signals can easily be distorted. To identify the target frequency of the SSVEP, narrowband IMF components are more suitable for identification through correlation analysis. In addition, all modes decomposed by VMD contain the main signal modes and noise modes, and by reconstructing the main signal modes, the noise artifact can be effectively removed, which can make up for the lack of bandpass filtering.
By comparing the recognition accuracy and ITR performance of VMD-FBCCA and the other three algorithms in Table 1 and Figure 4A, it can be seen that the VMD-FBCCA algorithm is superior to the other three algorithms, especially the FBCCA algorithm. This is because VMD has a remarkable noise reduction impact on the decomposition of EEG signals, enhancing both the signal-to-noise ratio and the recognition accuracy achieved after IMF weight optimization by the PSO algorithm.
5.2 Discussion of PSO optimizational results
In this paper, the PSO algorithm employs the recognition error rate as its fitness function, with the weight values serving as the particles. Through iterative optimization, the optimal weight coefficients of the IMFs are obtained. As illustrated in Figure 2, under the optimization process of the PSO algorithm, the recognition error rate continuously decreases and converges within dozens of iterations.
PSO guides the IMF weight values to evolve toward those that minimize the error. After PSO completes the optimization of the IMF reconstruction parameters, it will ensure that the classification error of FBCCA is minimized. Throughout the entire process, the VMD algorithm itself cannot distinguish between the components of SSVEPs and noise but relies on the parameters optimized by PSO to complete the weighting of different components. It can be considered that the PSO algorithm, as a bridge between VMD and FBCCA, organically combines the two methods. The recognition accuracy of VMD-FBCCA for SSVEP signals has been improved, further demonstrating that the PSO algorithm has a positive effect on weight optimization.
Because the SSVEP signal in the experiment is continuously stable in the 8–16 Hz frequency band, whereas the spontaneous rhythm is randomly unstable in the 8–13 Hz frequency band and the rhythm is randomly unstable in the 13–30 Hz frequency band. The frequency coverage overlap between SSVEP and and rhythm EEG signals will affect the characteristic frequency of the SSVEP.
Figure 5 shows the PSD of the original and reconstructed EEGs for subject S02. Comparing Figure 5A,B, it can be seen that the EEG signal reconstructed by VMD-FBCCA weakens the SSVEP signal in the 1–8 Hz band and enhances the SSVEP signal in the 8–30 Hz band. The IMF weight changes of 11 and 22 Hz are especially pronounced. The same weakening and enhancing phenomenon was present for the other subjects.
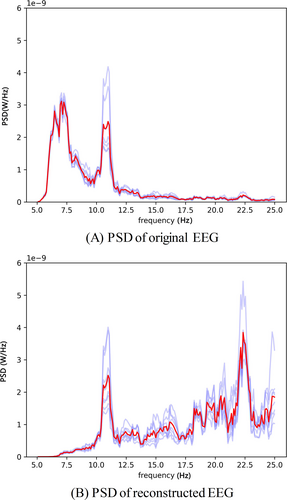
PSD of original and reconstructed EEGs from S02. EEGs, electroencephalography; PSD, power spectral density.
From the IMF component weight optimization results in Section 4.3, it can be seen that the IMF weights of SSVEP target rhythms are relatively large after optimization with the PSO algorithm and that the recognition accuracy of VMD-FBCCA on SSVEP signals is improved. It is verified further that optimizing EEG signals can improve the recognition accuracy.
In the training phase of this algorithm, we set the classification error of FBCCA as the fitness function for PSO. Therefore, in the optimization process, the PSO algorithm will guide the IMF weights to evolve toward the values that minimize error. After PSO completes the optimization of the IMF reconstruction parameters, it will ensure that the FBCCA classification achieves maximum accuracy. Throughout the entire process, the VMD algorithm itself cannot distinguish between the SSVEP and noise components but relies on the parameters optimized by PSO to complete the weighting of different components.
6 CONCLUSION
This paper proposes the VMD-FBCCA algorithm to address the problem of overlapping frequency coverage between evoked and spontaneous EEG signals, which affects the characteristic frequency of SSVEP and thereby reduces the recognition accuracy of BCI systems. First, the EEG signals of different channels are decomposed into IMF components with different central frequencies by VMD. Then, PSO is employed to optimize the weight of each IMF, and the optimized weights are used to reconstruct the EEG signal. Finally, FBCCA is used to recognize and classify the reconstructed EEG signals.
The proposed VMD-FBCCA algorithm is tested on data from a BCI competition, and the experimental results demonstrate that it outperforms other algorithms. This algorithm combines the adaptability of VMD and the training-free advantages of FBCCA. In addition, PSO is used to optimize the weights of IMFs in different frequency bands to better distinguish SSVEPs from spontaneous EEG signals and improve the SSVEP recognition accuracy.
The proposed algorithm has the potential to lead to improved BCI systems, and it offers a novel perspective for SSVEP-BCI research. Future research will emphasize enhancing the robustness of the VMD-FBCCA algorithm and refining the reference signal to boost its performance. Additionally, we aim to apply this algorithm to the development of SSVEP-BCI systems.
AUTHOR CONTRIBUTIONS
Ping Tan: Funding acquisition; investigation; methodology; project administration; supervision; writing–review & editing. Fengsheng Wang: Writing–original draft. Kaijun Zhou: Resources; validation. Yi Shen: Visualization.
ACKNOWLEDGMENTS
This work was supported by National Social Science Found of China (19BGL111), Key Project of Xiangjiang Laboratory (23XJ02006, 24XJJCYJ01001), and Scientific Research Project of the Education Department of Hunan Province (23A0470).
CONFLICT OF INTEREST STATEMENT
The authors declare that they have no conflicts of interest.
ETHICS STATEMENT
The experimental dataset utilized in this study is derived from the BCI Controlled Robot Contest held during the World Robot Contest in 2021,29 ethics approval was not needed in this study.
Open Research
DATA AVAILABILITY STATEMENT
All data used to support the findings of this study are included within the article. The data can be obtained from the corresponding author upon request.


